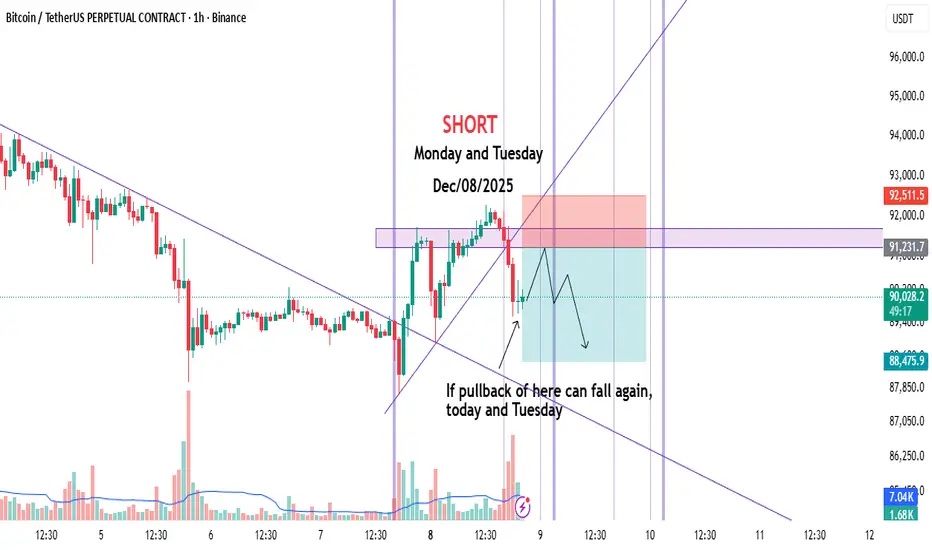
Daily Bitcoin Trade | Short | Monday | Dec/08/2025Hi Guys.
Given the trendline break and the static resistance formation, Bitcoin could be shorted today and tomorrow.
This is my personal setup.
Please be careful with your capital and don't forget the risk.
This is not an offer to buy or sell.
Good Luck :)
Market insights
#BTCUSDT.P 2H ChartPrice previously bounced off a discounted area of demand and left a freshly printed demand zone on its way up. In addition, it recently got rejected off a minor area of supply and it is consolidating showing no major movements. Price is expected to tap into our demand zone where we have placed our limits aiming to break the previous swing high at $94,185.

TradeCityPro | Bitcoin Daily Analysis #245👋 Welcome to TradeCity Pro!
Let’s move on to the Bitcoin analysis. After the fake move we had yesterday, today Bitcoin has entered a ranging box.
⏳ 1-hour timeframe
Yesterday on Bitcoin we had a trigger at the 91447 zone that we could use as a long trigger.
🎯 Before that, we also had a trigger on Bitcoin at 89849 which had been activated, and with the break of 91447 the second trigger was also activated.
🎲 After this trigger was activated, given the trend weakness we had on Bitcoin, the price could not stabilize above 91447, and with that move being faked, it dropped again to 89849.
⛏ The 89849 zone is an important support area on Bitcoin, and the next support we have on Bitcoin is 88890.
✔️ Considering that Bitcoin has faked both the 89849 low and the 91447 high once, we can say currently there is no specific trend in the market, and we can open both short and long positions.
📊 For a long position, again we can enter with the break of 91447 and open our position.
✔️ In case the market drops, we have two short triggers:
the first is 89849 and the second is 88890, and by breaking either of them we can have a trigger for a short.
❌ Disclaimer ❌
Trading futures is highly risky and dangerous. If you're not an expert, these triggers may not be suitable for you. You should first learn risk and capital management. You can also use the educational content from this channel.
Finally, these triggers reflect my personal opinions on price action, and the market may move completely against this analysis. So, do your own research before opening any position.

BTCUSDT Trade Plan (December 08, 2025)BTC Trade Plan (December 08, 2025)
(D1 Bearish / H4 Sell Rallies → Compression / H1 Neutral / M15 Chop)
⬛️ 1. Higher Timeframe Context (D1 and H4)
• D1 bias: bearish (descending channel post-ATH)
• D1 range (approx): 84,000 – 126,000 (current lower third)
• Key D1 zones:
• Supply: 100–105k (broken)
• Demand: 88–90k channel low
• H4 bias: sell rallies turning compression (ascending triangle forming)
• H4 zones of interest:
• H4 Sell Zone 1: – recent rejection + supply cluster
• H4 Buy Zone 1: – weekend low + trendline
Active setups counter-trend long on dip (whale accumulation support), trend-aligned short only on clear rejection.
⬛️ 2. Preferred Setups by Horizon
🔳 2.1 Swing Setup (D1/H4)
Counter-trend long the channel low / whale accumulation zone. Time horizon: multi-day to weeks.
🔲 2.2 Intraday Setup (H1 focus)
Buy dips to 89.5-90k or breakout above 92k. Time horizon: intraday to overnight.
▫️ 2.3 Scalp Setup (M15 focus)
Scalp range 90-92k or absorption plays — higher risk in chop.
▪️ 2.4 Arbitrage/Pairs: BTC dominance rising → BTC outperforming alts short-term.
🟩 3.1 Long Setup (Trend-Aligned with On-Chain / Swing-Intraday)
• Execution timeframe: H4/H1
• Trigger timeframe: M15
• Entry zone:
• Pattern tags: Trigger conditions:
• Successful defense 88-90k zone + CVD higher low
• H1/H4 BOS up on volume
• Whale accumulation continuation
🟥 3.2 Short Setup (Counter-Trend / Scalp Only)
• Execution timeframe: H1
• Trigger timeframe: M15
• Entry zone:
• Pattern tags: Trigger conditions:
• Clear rejection with delta divergence high
• Failure to break 94k pre-FOMC
🔴 4. Stops (Invalidation Levels)
Long setups: 87,500 (channel break = bear confirmation)
Short setups: 94,500 (breakout = squeeze)
🟢 5. Targets
Long (swing/intraday):
• TP1: 92,000 (VWAP/H1)
• TP2: 94,000-95,000 (supply test/H4)
• TP3: 100,000+ (HVN/D1 optional)
Short (scalp):
• TP1: 90,000
• TP2: 88,500
⬛️ 6. Position Sizing
• Baseline trend-aligned long (on-chain supported): 1.0%
• Counter-trend short: 0.4%
• Adjustments: +20% (whale buying + clean lev + Fed tailwind) → Effective: longs 1.2% risk, shorts 0.3% max
⬛️ 7. Risk Flags
• FOMC Wednesday → vol expansion risk
• Thin liquidity mid-week
• Residual weekend trauma → fake moves possible
• Macro correlation re-assertion if equities dump
⬛️ 8. Flip Conditions
Bull → bear flip: clean close below 88k with volume + funding negative
Bear → bull flip: H4 close >94.5k + CVD reset + whale continuation
⬛️ 9. Alternative Scenario
Reject hard at 92-94k → descending triangle breakdown → fast move to 84-87k LVN void (bear trap completion, high risk short only with tight stop).
⬛️ 10. Model Self-Critique
• Assumptions: whale accumulation continues, Fed delivers dovish cut, no macro shock
• Vulnerabilities: sudden risk-off equities dump, whale distribution resumption, FOMC hawkish surprise
• Behavioural: do not chase breakouts pre-FOMC, do not average into losing shorts against whales
⬛️ 11. Uncertainty and Constraints
Uncertainty: medium → require flow + pattern confirmation, no high lev, prefer size on confirmed absorption only.

BTC/USDT Analysis. Uncertainty, but Long Bias Remains
Hello everyone! CryptoRobotics trader-analyst here, and this is your daily market update.
Yesterday, Bitcoin failed to show a clear directional bias and continued trading within a narrow range, accumulating volume. Pressure on the cumulative delta remains on the sellers’ side, especially on spot markets, which adds uncertainty to the current structure.
Despite this, the overall long bias remains intact: the broader structure has not been broken, and the probability of upward continuation after a local liquidity sweep is still high. However, Bitcoin may first retest the $87,800–$86,400 (volume zone) before forming a new bullish impulse.
During this phase of consolidation, it is more prudent to stay out of the market and wait for a clearer setup — either a reaction from key support or a breakout through resistance. This will provide a much cleaner risk profile for new long positions.
Buy Zones
$87,800–$86,400 (volume zone)
$84,000–$82,000 (volume anomalies)
Sell Zones
$94,000–$97,500 (volume zone)
$101,000–$104,000 (accumulated volumes)
$105,800–$106,600 (local resistance)
This publication is not financial advice.

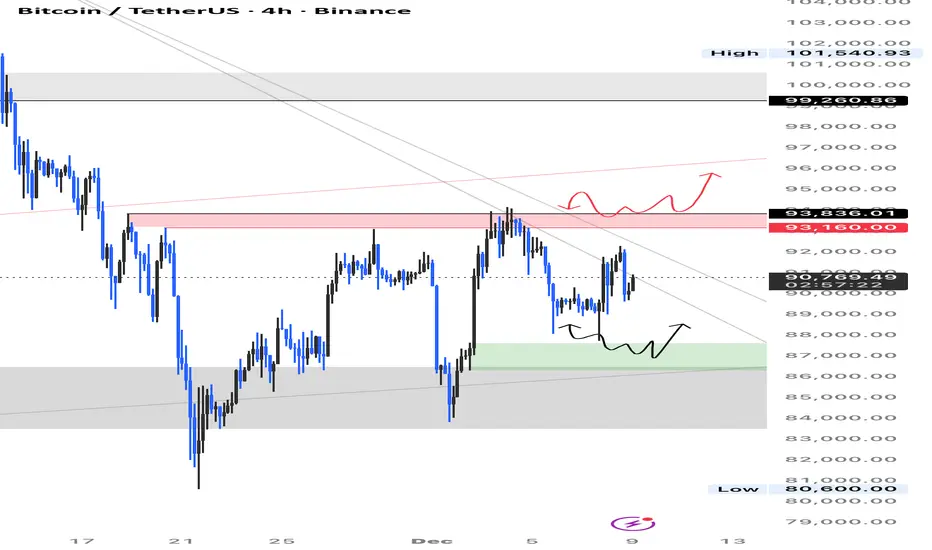
BTC/USDT | Consolidation and fall (READ THE CAPTION!)By examining the 4H chart of BTCUSDT, we can see that BTC is struggling to make a move and is consolidating over the IFVG. If it fails to make a move, a fall to the Demand Zone at 86,600 is possible. However, if it manages to go up, it'll face the FVG at 94,500 level, which then determines whether BTC can make an upwards move or falls again.

Bitcoin (BTC): Seeing Bullish Signs | Need To Re-Claim 100 EMAThe 100 EMA has been tested multiple times on BTC, yet buyers did not manage to fully secure this area. What we see is a continuation of attempts to break this zone completely and secure it, and as buyers are showing volume, we are looking for it to happen.
Setup looks decent; the zone of liquidity is our stop zone, where the major target is the 200 EMA as of now!
Swallow Academy


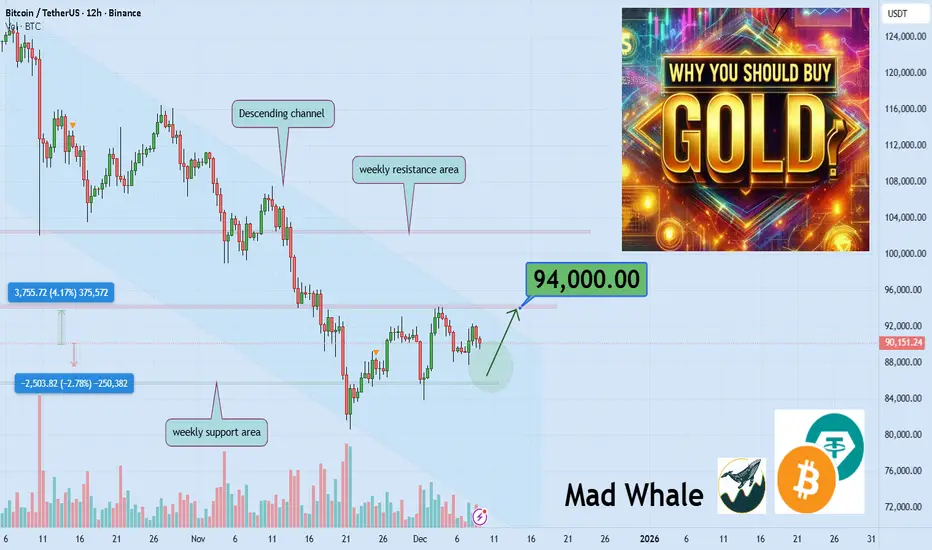
How to Buy Gold, Which Type to Choose, and Avoid Scammers?!If you want to profit in this inflationary market, you need to know how to buy gold, which type to choose, and how to protect yourself from scammers. Choosing the right type of gold and a reliable source is the key to success. Careful research and safety measures will protect your investment from unnecessary risks.
Hello✌️
Spend 3 minutes ⏰ reading this educational material.
🎯 Analytical Insight on Bitcoin:
From a technical standpoint, Bitcoin needs to fill that unusual gap it sharply created to the downside a few days ago. The price is currently forming a head and shoulders pattern, and everything now hinges on the crucial support level sitting right below its neckline. If this support holds firm, we can expect a rebound and the bullish scenario I've mapped out on the chart becomes likely. However, if it gives way, a further decline toward the next target is the more probable path. I've defined targets for both scenarios. Personally, judging by the technical confluence, I still see a credible chance for a recovery and a move upward.
Now , let's dive into the educational section,
💰 Inflation and Its Impact on Investment
Inflation is the main reason investors are returning to gold.
As currency value declines, safe-haven assets like gold become more attractive.
Investors should understand that gold can preserve wealth in almost any condition, but how you buy it matters a lot.
🏅 The Best Way to Buy Gold
Jewelry gold has high taxes and manufacturing costs, so profits are limited.
Buying physical melted gold is the best option, provided there are no legal restrictions in your country.
In countries where physical melted gold is restricted, reputable non-physical gold can be a suitable alternative, but check the company’s credibility and real gold backing carefully.
Always purchase from certified, reliable companies.
Never put all your investment in one asset; diversification is essential.
🧠 Investor Psychology and Behavior
Greed and fear can disrupt your decisions.
Many people enter the gold market without research and fall victim to fraudulent companies.
Controlling emotional behavior through mental discipline and technical analysis is crucial.
🔍 Practical Tips for Buying Gold
Buy physical melted gold from trusted sources.
For non-physical gold, carefully verify the company’s credibility and backing.
Always limit your investment risk and avoid putting all your funds into a single asset.
Carefully review contracts and purchase terms before committing.
📈 TradingView Tools and Features
Volume Profile: Identify key supply and demand zones in the gold market
Moving Average: Track long-term and short-term trends
RSI: Detect overbought or oversold conditions and market sentiment
Alerts: Set notifications for important price changes
Watchlist: Manage and monitor your assets regularly
💡Summary
Buying physical melted gold from a certified company is the best way to hedge against inflation and protect wealth. In countries with restrictions on physical gold, reputable non-physical gold can be a practical alternative. TradingView tools help make your analysis precise and actionable.
Personally, I expect the global gold ounce price to reach 5000 units by mid-2026, making now a strategic time for careful planning and smart investment.
🏆 3 Important Recommendations
Always diversify your investments across multiple assets to reduce risk.
Buy gold with knowledge and technical analysis, avoiding market-driven emotional decisions.
Thoroughly research any company offering physical or non-physical gold, checking credibility and actual gold backing to prevent scams.
✨ Need a little love!
We pour love into every post your support keeps us inspired! 💛 Don’t be shy, we’d love to hear from you on comments. Big thanks, Mad Whale 🐋
📜Please make sure to do your own research before investing, and review the disclaimer provided at the end of each post.
Wyckoff Distribution. Long term liquidity levels reached.Liquidity we have been tracking for months from orderbook instability in our lower time frame threshold tracker has just been absorbed, see horizontal boxes on screen. I believe we are happy here, waiting for fed…

Emotional Patterns: What Your Trades Reveal About YouTrading feels technical on the surface, yet the deeper layer is psychological. Charts highlight opportunities, but the way you behave inside those opportunities shapes the outcome. Each trade reflects how you respond to pressure, uncertainty, and risk. Over time, these reactions create emotional patterns that influence results more than strategy.
One early pattern appears after a loss. A losing trade often triggers frustration, and that frustration pushes traders into fast entries aimed at regaining control. The decision becomes driven by emotion rather than process, and this behaviour can quickly lead to a cycle of overtrading.
Winning streaks create a different pattern. Confidence expands, and many traders begin increasing size, loosening rules, or entering before confirmation because recent success feels reassuring. This overextension usually leads to sharp setbacks when the market shifts.
Another frequent pattern is hesitation. Traders with inconsistent execution tend to freeze at key moments. They wait for additional confirmation, delay entries, or watch clean setups move without them. The pause often comes from the memory of previous mistakes rather than a lack of technical understanding.
Entries reflect trust in the system. Exits reflect trust in personal decision-making. Closing a trade too early often shows discomfort with open profit. Holding a losing trade too long often comes from discomfort with accepting a loss. These behaviours reveal the trader’s relationship with risk far more clearly than any written reflection. The chart becomes a mirror.
Recognising emotional patterns provides clarity. When recurring behaviours appear—chasing, hesitating, forcing trades, avoiding losses—they become easier to interrupt. Once a pattern is visible, it starts losing influence.
Structure then supports the change: rules, checklists, routines, and clear confirmation criteria. These elements stabilise execution and reduce the impact of emotional impulses.
A strategy defines potential entries, but emotional patterns determine whether the trader can execute consistently enough to benefit from it. Awareness strengthens decision-making. When you understand what your trades reveal about your behaviour, you can adjust it and bring execution closer to intention.
This is where consistency begins.

Bitcoin Price Prediction: Recovery To $100,000 Could Be Tainted Bitcoin’s price is at $90,399 at the time of writing, sitting just below a downtrend that has persisted for one and a half months. BTC is attempting to flip $90,400 into a support level, which would mark the first step toward reversing the trend.
If macro conditions align and rate cuts revive broader market optimism, BTC could rebound sharply. A clean bounce from $90,400 may drive a retest of $95,000, and breaking that resistance would open a clear path toward the long-anticipated $100,000 level.
However, if short-term holders sell into strength, Bitcoin may struggle to maintain upward pressure. A rejection from $95,000 or failure to break the downtrend could send BTC back toward $86,822, invalidating the bullish scenario.

EcoByG Bitcoin Daily Analysis #6 — Daily BTC Market UpdateWelcome to My Analysis.
Now, let’s break down today’s Bitcoin structure.
Bitcoin attempted once again to break through the liquidity zone at 91,800–92,300, but since buyers showed no demand in that area, price was rejected again and returned back into the equilibrium zone.
Here, the moving averages have tangled back together, showing indecision.
The moving average values are:
28, 58, and 99.
The RSI shows that there is still no meaningful momentum entering the market — meaning Bitcoin hasn’t picked a direction yet.
This suggests the market needs more time before participants decide whether to put serious money in or not.
Most traders prefer to stay patient for now.
For short setups, the earliest possible level is around 89,000,
but for long setups, we still don’t have proper confirmation above 92,300.
Taking a long here would be unsafe and risky, and it’s better to give the market more time.
Trading volume is still balanced between buyers and sellers, which means the market remains in equilibrium.
⚠️ Risk Alert ⚠️
Futures are not beginner-friendly. These triggers require solid experience.
Before using them, study risk management and practice with the learning content here.

BTCUSDT: Update On Todays Market.BTCUSDT continues to scale slowly upward after dropping down to $80,534. the pair is moving on a momentum of higher highs and lows. presently the price is heading down towards the next low, in respect of the structure. the best alternative at this point is buying at lows and selling at highs
Possible outline;
A confirmed reversion above $84,071. would trigger a buy position, eyeing $96,146 as target.
Lets see how it plays out.
keep it simple, keep it trading.
Thanks for reading.

BTC Most Likely Scenario -- 98K -> 70KBTC Most Likely Scenario -- 98K -> 70K
Probability for BTC next move is to go to 98k-100k level. Then go take the liquidity between 70-74k. We probability will make a bullish divergence on that level. Will see then if we make a LH in upcoming months or another ATH.

BTCUSDT.P - December 9, 2025Price is compressing under a descending trendline after a prior upswing, with the market holding above a key support band around 86,000–87,000 that defines the proposed long entry area. A clean breakout and acceptance above the descending trendline and overhead resistance near 94,500 would signal bullish trend continuation toward the 105,000–106,000 profit zone. Failure to hold the 86,000–87,000 support and a decisive break below would invalidate the long bias and open downside risk toward the lower support cluster around 77,000–78,000.

$BTC/USDT ANALYSISBitcoin is moving inside a symmetrical triangle on the 8-hour chart and the price is sitting near the middle of the range, trading below the 50MA which is acting as a resistance zone on top. Bulls are defending the lower trendline while sellers are active near the upper trendline, creating a squeeze where volatility is slowly reducing. If price holds above support, it may continue to move sideways inside the triangle, but a strong candle above the 50MA and triangle top would show strength, while a drop toward the ascending support would show weakness. Right now market is neutral and waiting for a clear break from this pattern, so upcoming moves around these trendlines will decide the next direction.


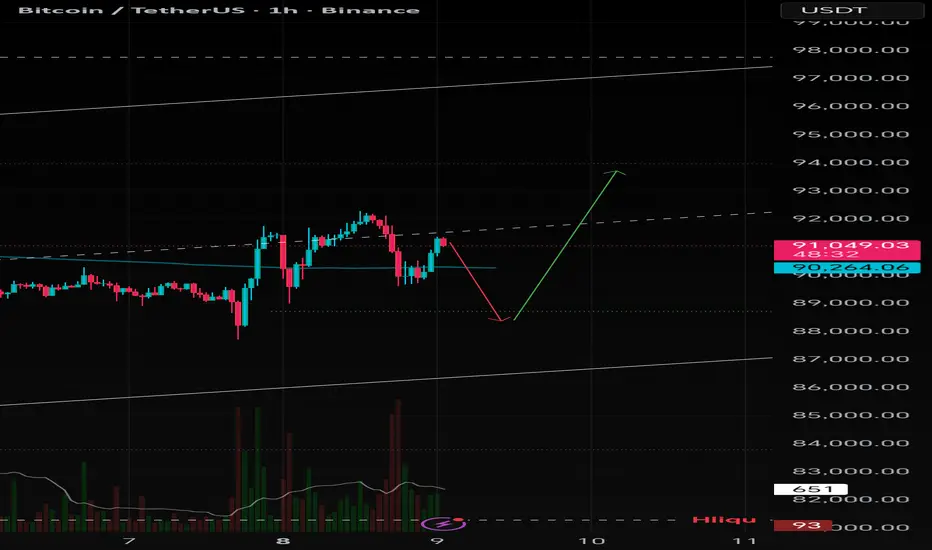
My view
***Price will drop to the green line.** That’s my key support level.
* **Then it will bounce back up.** I expect a reversal after touching that green line.
***The overall trend is still up.** The big white uptrend line at the top shows the main direction hasn't changed yet.
***It’s a pullback, not a crash.** This dip to the green line is just a normal correction before the next move higher
$BTC: Red Box Breakout Awaited! CRYPTOCAP:BTC is still following our plan with no changes. As expected bounced from marked demand area and is still trading within the range. I hope that once red box breaks out, we’ll finally see some good movement in both #alts and $BTC.
BTCUSDT // We cannot see regular closings above the Kaufman indicator in the area I have indicated with a circle. For an increase, we must look for at least 3 closings above the Kaufman indicator.

BTC Technical analysis 4H time frame📊 BTCUSDT 4H Analysis
Trend Analysis
BTC is still in a medium-term downtrend because price remains under the 4H EMA ribbon, especially the heavy red EMAs (bearish control).
But short-term trend has flipped bullish, as BTC is reclaiming the lower EMAs and pushing into the resistance cluster at $92,000 – $94,000.
Key Support & Resistance Levels
Resistance
4H R1: $92,200
4H R2: $93,000
4H R3 / Major Resistance Zone: $93,500 – $94,000 ← very strong supply
Support:
Major Support: $89,800 – $90,300
Critical Support: $86,000 – $87,000
Local ascending trendline support also aligns with the critical zone — strong confluence.
Candlestick Interpretation
Current candlestick structure shows a series of strong green-bodied candles approaching resistance. No reversal pattern yet.
BTC is attempting a controlled bullish continuation sequence, but confirmation requires a close above $92,300 to validate a trend reversal attempt.
Indicators & Oscillators
MACD crossed bullish
Histogram is increasing
Momentum is rising but still below the zero line → trend reversal not confirmed yet
EMA Ribbon- BTC is fighting the mid-band. A breakout above $93k would flip the ribbon bullish on 4H
Indicators show early bullish strength, not yet full trend reversal.
Volume Analysis
Volume increased on the bounce from $89k, but buying volume approaching resistance is not strong enough yet. For a breakout above $94k, we need volume expansion + long candle body closure
Wave Analysis (Simplified Elliott Structure)
Current move looks like a Wave B upward correction unless $94k breaks. A break above $94k activates Wave 3, targeting $98.2k–$100k. Failure below $92.3k leads into Wave C downward to $88.5k then $86k
Intraday Trading (4H)
Long after confirmed 4H close above $92,300
SL: $91,200
TP1: $93,000
TP2: $93,500–$94,000
OR
Short rejection at $93,500–$94,000
SL: $94,450
TP: $92,200 then $91,500
Swing Trading (Multi-day)
Swing long only after daily close above $94k
SL: $91,800
TP1: $97,500
TP2: $100,000
Swing short if price loses $89,800
SL: $91,300
TP: $87,000 → $85,500
***NOT Fianacial advice, just a technical ananlysis***
