Bitcoin’s Next Move? ETH Heating Up & Altcoin Liquidity Shifthey I’m Skeptic,
in this one we’re looking at BTC’s breakout attempt, the good & bad signs in the daily candle, and why ETH & other alts are moving while BTC is ranging.
also sharing my triggers for both BTC & ETH, plus what I’m watching on BTC.D for the week ahead.
manage your risk, don’t fomo — peace out :)
BTCUSDT trade ideas

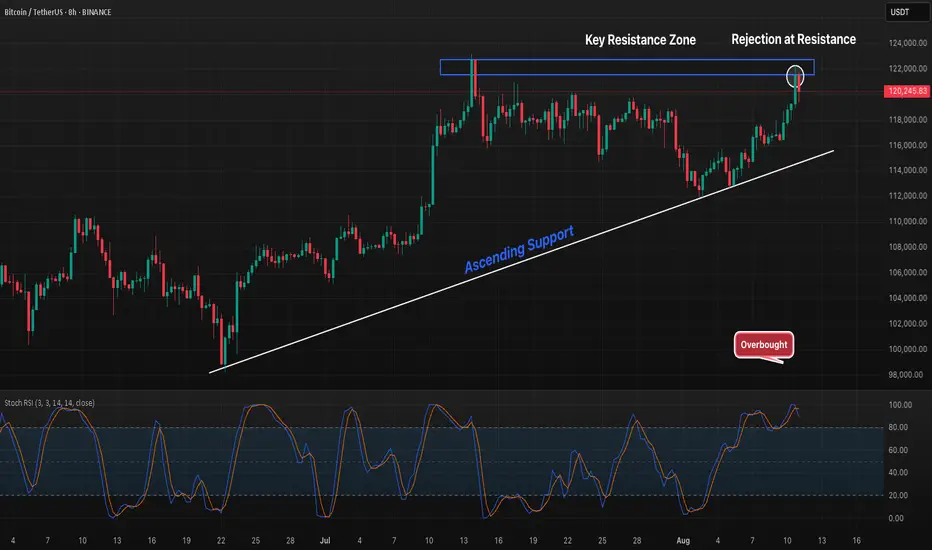
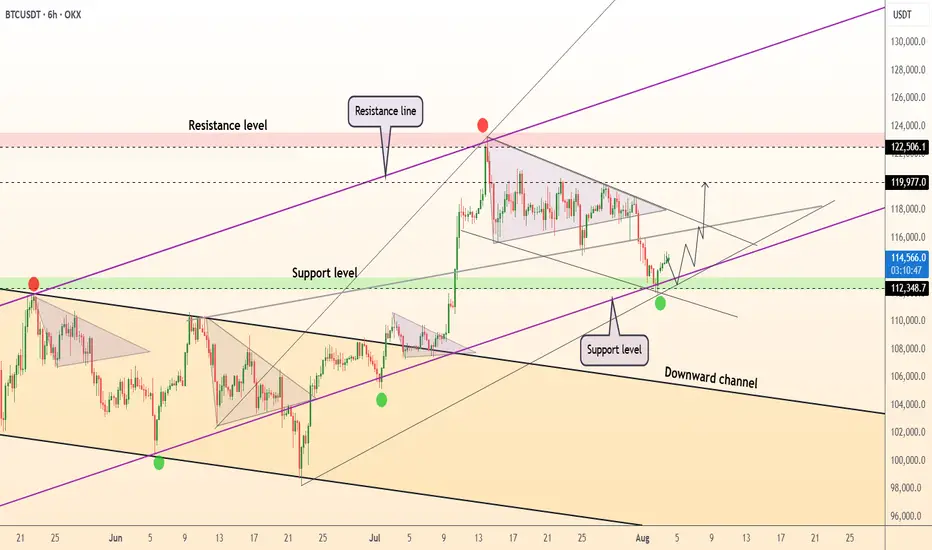
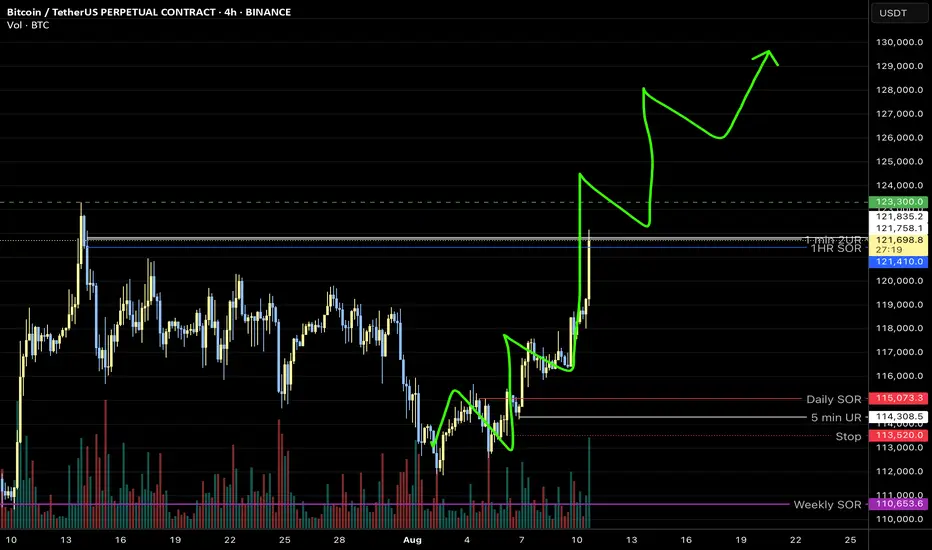
BTC 8H Ascending Support Test, But Will Resistance Reject Again?Bitcoin has been climbing along a steady ascending support line, now testing a key resistance zone around $122K that has previously acted as a strong rejection point. The Stoch RSI is deep in overbought territory, suggesting potential short-term selling pressure. A breakout above this resistance with strong volume could open the door to further upside, while another rejection may send price back toward the trendline for a retest.
BITCOIN.BITCOIN , On 4hr we found a rejection using our 4hr line chart candle close and took advantage of the sale. The secret is to chart multiple brokers ,brokers candle stick closes are 100% different from line chart perspective while trading any thing in the financial market...(stocks,bonds,crypto,forex)
since we rely on the structure of the market for forward guidance we chart multiple broker for variation in candle closes .
the price action is watched in Realtime for a close into another structural buy zone .the current break out could retest 116k-117k and set up a buy wave based on the principles of break and retest.
the goal is to see if we break and sustain above 123k and look at 124k and 130k ascending trendline acting as dynamic supply roof and resistance to upswing which the current all-time high is a victim of the top layer supply roof .
united state economic data report will give a clear direction and signal into next FOMC OUTLOOK.
THE CPI measures the Change in the price of goods and services purchased by consumers, excluding food and energy
Core CPI m/m forecast 0.3% previous 0.2%
CPI m/m forecast 0.2% previous 0.3%
CPI y/y forecast 2.8% previous 2.7%
FOMC Member Barkin Speaks
14th
the core PPI m/m measures the Change in the price of finished goods and services sold by producers, excluding food and energy
Core PPI m/m forecast 0.2% previous 0.0%
PPI m/m forecast 0.2% previous 0.0%
Unemployment Claims forecast 225K previous 226.
this DATA will affect the 10 year treasury bond yield and dollar index as the signal will be watched by FEDS.
TRADING IS 100% PROBABILTY
LOWER YOUR EXPECTATION
RISK TO REWARD RATIO SHOULD BE IN YOUR CHECKLIST AND TRADE REASON.
ANY GOOD TRADE CAN TURN TO A BAD TRADE.
A TRADER WITHOUT LIQUIDITY IS A DEMO TRADER
A HUNTER GUN WITHOUT BULLET IS A TOY GUN.(HUNTERS MINDSET)
PROTECT YOUR CAPITAL.
GOOD LUCK
#BTC #BITCOIN

Sellers – the final bastion
summery
We will analyze Bitcoin on the daily timeframe regarding this critical week
Analysis
A daily candle that has drilled through the heavy resistance level of 120,000 up to around 123,000 can only mean one thing: if the candle closes in this manner, I anticipate a healthy bullish move in the lower timeframes this week .
However, we must remember that today’s candle needs to close green, and tomorrow’s candle should never be a weak or small one.
Trade Plan
You should be ready to open positions in the lower timeframes tomorrow, but never forget risk and capital management!
Disclaimer
This content is purely analytical in nature and should not be interpreted as financial advice or a trading signal. All trading decisions and their outcomes are entirely the responsibility of the trader. The cryptocurrency market is highly volatile and may lead to the loss of part or all of your capital. Always conduct your own analysis and apply proper risk and capital management before entering any trade.
#Bitcoin #BTC #CryptoAnalysis #TechnicalAnalysis #CryptoTrading #TradingPlan #PriceAction #CryptoMarket #CryptoStrategy #RiskManagement #Altcoins #CryptoSignals #MarketAnalysis #DayTrading #SwingTrading

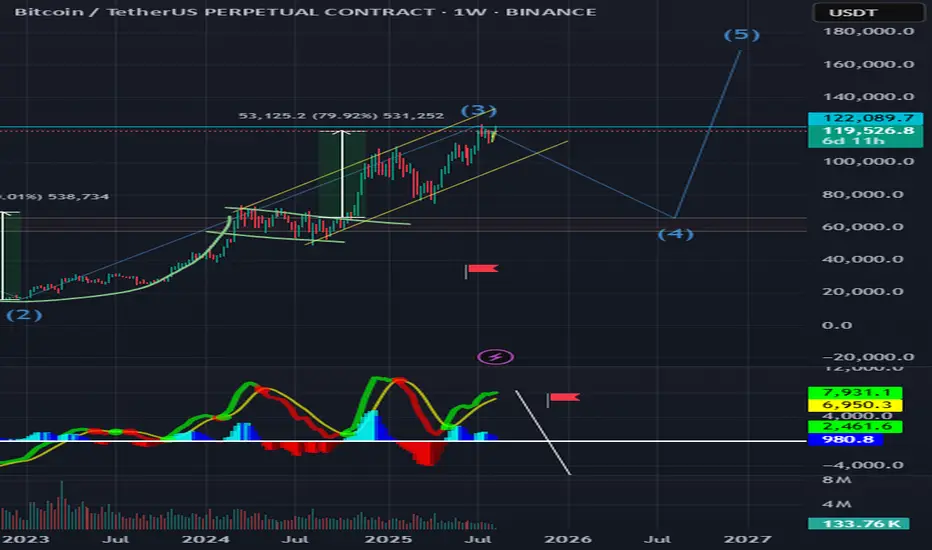
BTC - Cup & Handle Completed, Wave 4 is Coming...The long-term cup & handle pattern has played out, completing wave (3) around the $122K zone. According to Elliott Wave structure, BTC is now likely to enter wave (4), which could mean a deeper correction toward the $60K–$70K range before the final wave (5) push.
Wave 5 could target new all-time highs later, but for now, caution is key — this phase may shake out weak hands before the next rally.
Key Points:
Cup & handle breakout already done.
Wave 3 peak in place.
Wave 4 correction expected before Wave 5 to ATH.
Not financial advice.
BTC is bullish but correcting itself to balance the risk/rewardWe see here the chart, i dont recommed to short btc, but still i think we can expect a short down swing where we could buy some spot positions or call options to sizen up our position.
My data and chartbased analytics about this week:
110-112k - lower support
115-118k - medium support
I'm not lookout for new ATH this month such as 124-126k but its possible. I do look more for longterm ATH in oct. / nov. 2025 by around 145-180k
Feel free to share your opinion in the comments below!

BTC Analysis – The Most Likely Scenario
BTC Analysis – The Most Likely Scenario 🔥🚀
♦️ BTC ♦️
If today’s daily candle closes bullish and tomorrow we see a red engulfing candle ➡️ time to close positions.
But if we only see a rejection from the 120,000.00 level today ➡️ tomorrow the probability of breaking this zone increases.
🟡 On the monthly timeframe, it’s better to have a stronger candle with a larger body.
🟡 Lately, US traders have been 2-3 days behind Asian traders, so we could see momentum building in the US session in the next few hours.
If BTC.D rises above 60.98 ➡️ look for coins that are bullish against BTC pairs and go long.
If BTC.D keeps dropping or rejects from 60.98 ➡️ most altcoins will pump, and triggers will be easier to find on their charts.
♦️ TOTAL ♦️
Uptrend confirmed ✅ Finally broke the key 3.92 level. Look for triggers in BTC or alts.
♦️ TOTAL2 ♦️
Uptrend ✅ Broke the key 1.53 level.
Break of 1.57 = next trigger.
Break of 1.62 = last entry chance before a possible bull run.
♦️ USDT.D ♦️
After 19 days, we’re back testing 4.13.
Break above = 🔥 major bullish potential.
Rejection = should not go back above 4.20.
♦️ Most Likely Scenario ♦️
BTC stays bullish with rising dominance 📈. Then BTC needs to rest & range, at which point dominance will drop. If this happens, alts — which have been moving small and slow — could explode with huge momentum.
Best to open positions before BTC starts ranging, because once it rests and dominance starts falling, you won’t get an easy entry.
Given current market conditions, rejections and stop hits in alts are possible. But personally, I’d rather enter at these levels and take a stop-loss than miss the move entirely. 😎
🚀 Smash the rocket, follow for more setups, and stay ready for the next big move!

Supertrend – Multi-Timeframe Support & ResistanceSupertrend – Multi-Timeframe Support & Resistance
This script overlays multiple Supertrend bands from higher timeframes on a single chart and treats them as dynamic support and resistance. The goal is simple: see the bigger picture without leaving your current timeframe.
What it does
• Calculates Supertrend using the same ATR Length and Factor across 5m, 15m, 30m, 1h, 4h, 8h, 12h, and 1D.
• Pulls each timeframe via request.security(..., lookahead_off) so values only update on candle close. No look-ahead, no “teleporting” lines.
• Plots each timeframe’s Supertrend as an on-chart band with increasing transparency the higher you go, so you can visually separate short-term vs higher-timeframe structure.
• Colors indicate direction:
• Green = bearish band above price (acting as resistance)
• Red = bullish band below price (acting as support)
• Drops compact labels (5m, 15m, 30m, etc.) every 20 bars right on the corresponding Supertrend level, so you can quickly identify which line belongs to which timeframe.
Why this helps
Supertrend is great for trend definition and trailing stops. But one timeframe alone can whipsaw you. By stacking multiple timeframes:
• Confluence stands out. When several higher-TF bands cluster, price often reacts.
• You see where intraday pullbacks are likely to pause (lower TF bands) and where trend reversals are more meaningful (higher TF bands).
• It’s easier to align entries with the dominant trend while still timing them on your working timeframe.
How it works (quick refresher)
Supertrend uses ATR to offset a median price with a multiplier (Factor). When price crosses the band, direction flips and the trailing line switches sides. This script exposes:
• ATR Length (default 10): sensitivity of the ATR. Smaller = tighter band, more flips. Larger = smoother, fewer flips.
• Factor (default 3.0): multiplier applied to ATR. Larger = wider band, more conservative.
The same settings are used for all timeframes for clean, apples-to-apples comparisons.
How to use it
• Trend alignment: Prefer longs when most higher-TF lines are below price (red support). Prefer shorts when most are above price (green resistance).
• Pullback entries: In an uptrend, look for pullbacks into a lower-TF red band that lines up near a higher-TF red band. That overlap is your “zone.”
• Breakout confirmation: A strong break and close beyond a higher-TF band carries more weight than a lower-TF poke.
• Stops and targets: Use the nearest opposing band as a logic point. For example, in a long, if price loses the lower-TF red band and the next higher-TF band is close overhead, trim or tighten.
Signals you can read at a glance
• Stacking: Multiple red bands beneath price = strong bullish structure. Multiple green bands above price = strong bearish structure.
• Compression: Bands from different TFs squeezing together often precede expansion.
• Flip zones: When a higher-TF band flips side, treat that level as newly minted support/resistance.
Design choices in the code
• lookahead_off on all request.security calls avoids repainting from future data.
• Increasing transparency as the timeframe rises makes lower-TF context visible without drowning the chart.
• Labels every 20 bars keep the chart readable while still giving you frequent anchors.
Good to know (limits and tips)
• This is an overlay of closed-bar Supertrend values from higher TFs. Intrabar moves can still exceed a band before close; final signal prints at candle close of that timeframe.
• Using the same ATR/factor across TFs makes confluence easier to judge. If you need independent tuning per TF, you can clone the security calls and add separate inputs.
• On very low timeframes with many symbols, multiple request.security calls can be heavy. If performance drops, hide one or two higher TFs or increase the label spacing.
Risk note
This is a context tool, not an auto-trader. Combine it with structure (HH/HL vs LH/LL), volume, and your execution rules. Always test on your market and timeframe before committing real capital.
Bitcoin & $132,800Bitcoin broke above the resistance at $118,300 and, with no further resistance, is approaching the 2nd resistance of August's pivot at $132,800.

Analytics: market outlook and forecasts
📈 WHAT HAPPENED?
At the beginning of last week, Bitcoin reached the resistance level of $115,000-$116,300 (a mirror volume zone) and experienced a quick correction. However, at this level, there was a strong absorption of sales, as the volumes clearly indicated active buys, and by Wednesday, the focus shifted towards long positions.
The only surprise was a slight stop in the $117,600-$118,600 zone (accumulated volumes). In general, we passed it with almost no resistance, which is a sign of buyer strength.
An additional catalyst for growth was President Donald Trump's executive order on August 7, which allows Americans to invest in cryptocurrency through their retirement accounts. This decision could pave the way for a multibillion-dollar influx of new funds into the cryptocurrency market.
💼 WHAT WILL HAPPEN: OR NOT?
Now we’re almost close to the ATH, but at the moment there is a small resistance in the range of $121,500-$122,300. It’s not yet clear in which direction the volume will move, but in case of a breakout of the ATH, this zone can become the nearest support in the case of a correction.
If sells are activated at the current levels, it’s worth paying attention to the level of ~$120,000 (pushing volumes). In this case, a local sideways movement is possible between the level of ~$120,000 and the zone of $122,300-$121,500.
Buy Zones:
~$120,000 (pushing volumes)
$117,500–$116,000 (accumulated volumes)
$115,300–$114,000 (accumulated volumes)
📰 IMPORTANT DATES
On macroeconomic events this week:
• August 12, Tuesday, 12:30 (UTC) - publication of the basic consumer price index (CPI) of the United States for July, as well as in comparison with July 2024;
• August 13, Wednesday, 6:00 (UTC) - publication of the consumer price index (CPI) of Germany for July;
• August 14, Thursday, 6:00 (UTC) — publication of the UK's GDP for the second quarter and for June;
• August 14, Thursday, 12:30 (UTC) — publication of the number of initial unemployment claims and the US producer price index (PPI) for July;
• August 14, Thursday, 23:50 (UTC) — publication of Japan's GDP for the second quarter;
• August 15, Friday, 12:30 (UTC) — publication of the volume and base index of US retail sales for July.
*This post is not a financial recommendation. Make decisions based on your own experience.
#analytics

DeGRAM | BTCUSD reached the support level📊 Technical Analysis
● BTCUSD has bounced from confluence support at 112.3k–114.8k, reclaiming the ascending support line and validating the lower boundary of the rising triangle.
● Price action suggests a bullish continuation setup with targets at 119.9k and extension to the upper resistance near 122.5k–125k.
💡 Fundamental Analysis
● US labor data slowdown and dovish Fed commentary have pulled real yields lower, boosting crypto demand.
● Glassnode reports ongoing whale accumulation and rising stablecoin inflows, signaling positive capital rotation into BTC.
✨ Summary
Long above 114.8k. Targets 119.9k → 122.5k+. Setup invalidated on a break below 112.3k support.
-------------------
Share your opinion in the comments and support the idea with a like. Thanks for your support!
Bitcoin Price Near ATH, More Upside LikelyBINANCE:BTCUSDT is still trading inside its ascending channel on the daily chart, pressing against the $123,230 Fibonacci 1.0 extension: the same level that capped the July 14 rally. This zone remains the immediate breakout target, with $130,200 as the next upside marker if bulls clear it with strong volume.
Key supports to watch are $120,806 (Fib 0.786) and $118,903 (Fib 0.618). Holding above these levels keeps the BINANCE:BTCUSDT bullish structure intact; a close below could stall momentum.
The RSI sits near 66, well below July’s overbought 75+, suggesting there’s still room for upside before technical exhaustion kicks in. Supporting metrics like SOPR at 1.00 (versus overheated 1.03–1.05 in July) and Taker Buy/Sell Ratio at 1.14 confirm that profit-taking is limited and spot buying remains strong.
Overall, if $123,200 gives way, Bitcoin could see a faster, stronger push to new all-time highs than its last attempt. And for BINANCE:BTCUSDT , $123,200 would first mean that a new all-time high is in.

Bitcoin 4H Imbalance to Hold PriceConfirmation: 4H imbalance to hold and push price high
Opportunity: When I get a sharp turn on 15min I will execute my entry.

$BTCXAG - BITCOIN TO SILVER - BULLMARKET IS NOT OVER!I bet you haven't seen this chart anywhere! The Bitcoin to Silver chart is preparing for another explosion!
And yes, BULLMARKET IS NOT OVER!


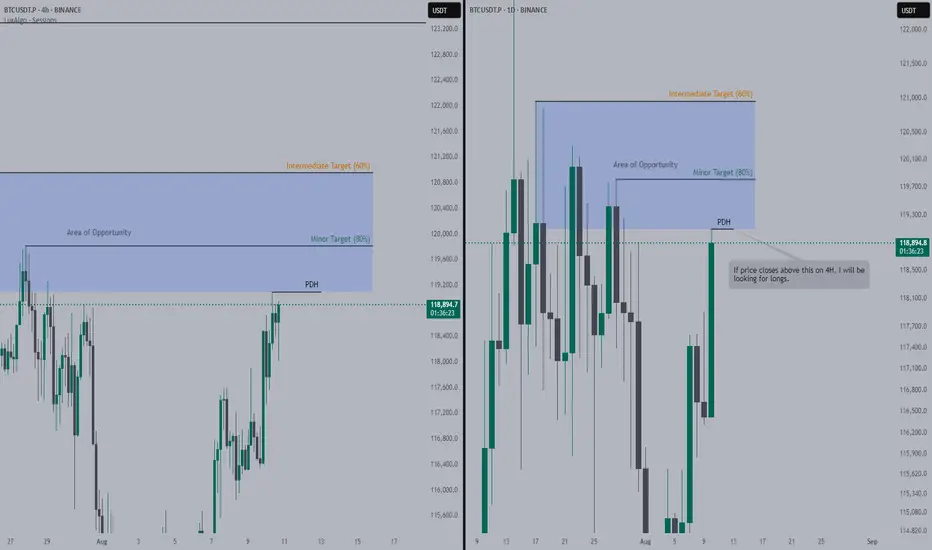
Bitcoin is Pumping, Looking to Fly with itConfirmation: Price closes above PDH (Previous Day High).
Opportunity: Price trades within Area of Opportunity (AoO), we will be looking for longs.
BTC/USDTFor continued upside, a pullback toward the weekly open would be healthy.
A move below the $114K–$115K zone could open the door for a deeper correction.
Current upside target sits at $130K.

BTC - Irrational Exuberance or breakout continuation Consolidation occurring in the shape of a rising wedge, a traditionally bearish pattern, as traders assess the recent series of volume assisted breakouts.
A natural tendency is to test support before breaking out a third time so be prepared for some pullbacks to previous pivot high support levels.

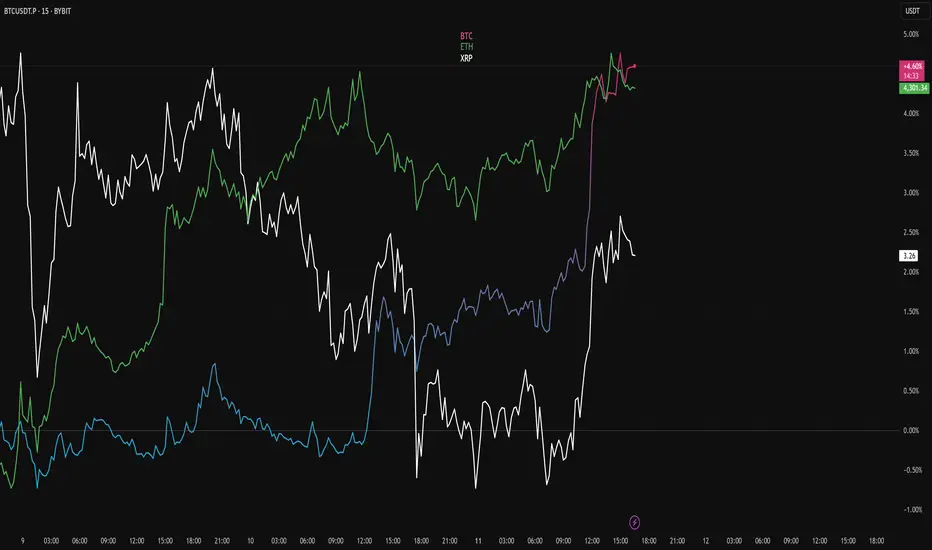
TOP 3 MARKET CAPBTC · ETH · XRP Multi-Chart with RSI Overlay
A clean TradingView setup comparing BTC, ETH, and XRP side-by-side on a % scale, colour-coded for quick correlation tracking:
Orange = BTC
Blue = ETH
Green = XRP
Includes a custom RSI indicator showing all three assets in one pane for instant momentum comparison.
Perfect for spotting divergences, leading moves, and correlation breaks across the majors.
BTC Breaks 116k!We did break the 116k level. But it is not clear yet whether the breakout is bullish or not.
Plotted range extremes let's see

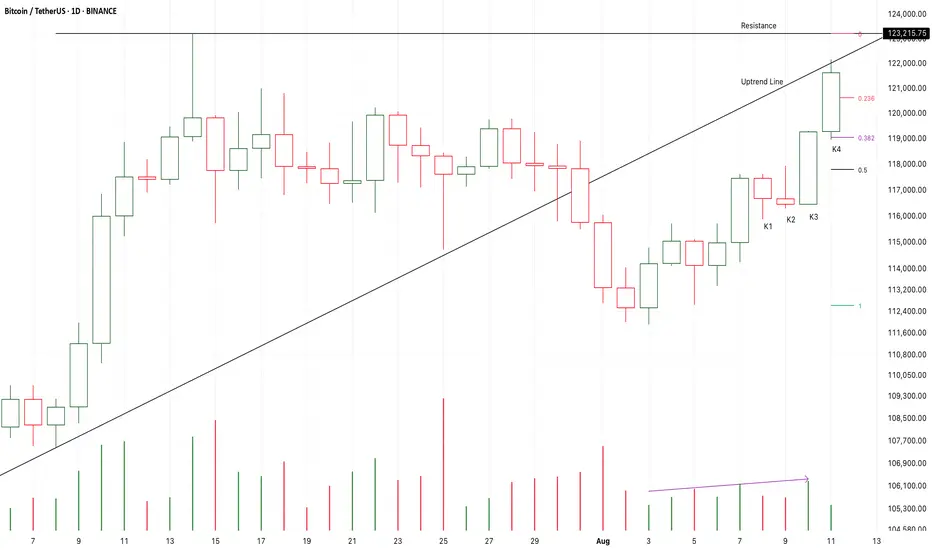
Chart Pattern Analysis Of Bitcoin.
K3 and K4 verified an accelerating motive wave of a short-term uptrend.
I am leaving from 119K to 123K.
I am expecting a consolidation around the resistance.
If the following candles fall to test 0.5fib area,
I will try to buy it there.
Long-118K/Target-125K/Stop-116.5K
Bitcoin Overall: look for 9 wave impulseThere has been no retracement within the current price range. As a result, this is looking very much like a classical Elliot wave impulse. This one should have nine waves before another corrective phase.
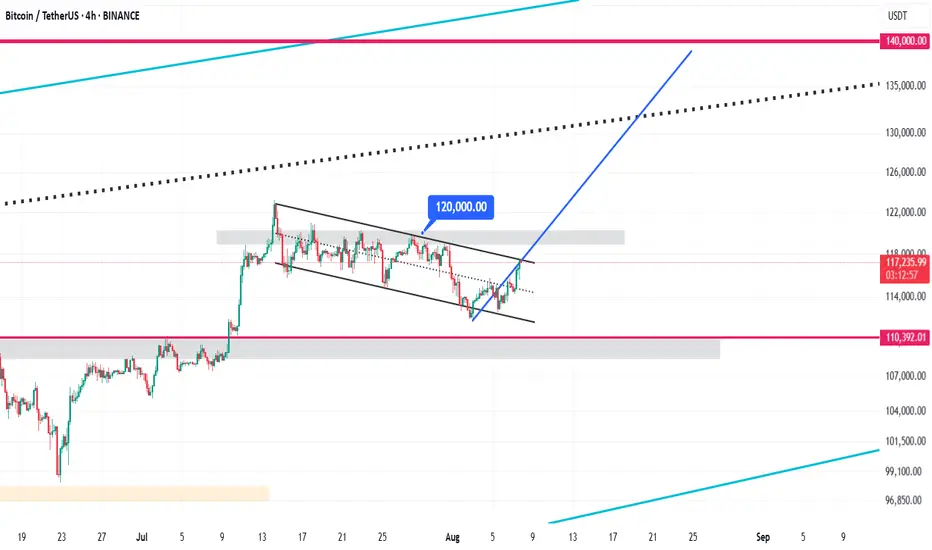
Bitcoin Bullish Flag Pattern Analysis & $140,000 Target🚩 Bullish Flag Pattern Formation
Bitcoin is currently forming a bullish flag pattern on the 4-hour chart. This pattern typically appears after a sharp upward move and represents a short-term consolidation within a descending channel. It usually signals a continuation of the strong bullish trend. Currently, the price is oscillating between the upper and lower boundaries of this channel, poised for a potential breakout.
⏳ Duration of the Correction Phase
The correction inside this channel has lasted from July 14 to August 8, 2025, spanning approximately 25 days. This relatively long consolidation period indicates a deep stabilization phase, allowing the market to gather momentum for the next upward wave. During this time, Bitcoin traded in a tight range between the channel’s support and resistance levels.
⚠️ Critical Resistance at $120,000
The key resistance level to watch is $120,000. If Bitcoin can break this level decisively with strong volume and confirming candles, the bullish flag pattern will be validated, signaling a continuation of the upward trend. This breakout point is considered an optimal entry for new long positions.
🎯 Price Target at $140,000
The target price derived from the bullish flag pattern, calculated by measuring the flagpole and projecting it from the breakout point, is around $140,000. This represents approximately a 20% gain from the breakout and may serve as a significant psychological resistance level.