Lingrid | BTCUSDT Potential Bullish Trend Continuation SetupBINANCE:BTCUSDT is holding above the trendline after defending the higher-low zone, keeping the broader bullish structure intact. The recent pullback swept short-term liquidity before price stabilized near the 89,000 support band, where buyers stepped back in. This behavior suggests the move lower was corrective rather than the start of a reversal.
As long as price remains supported above 89,000 and respects the ascending structure, CRYPTOCAP:BTC has room to grind higher toward the upper resistance cluster around the weekly high near 96,000. A successful push through that zone would signal trend continuation, while short-term consolidations along the trendline remain constructive for further upside.
➡️ Primary scenario: higher lows hold → continuation toward 96,000 resistance area.
⚠️ Risk scenario: loss of 89,000 support invalidates the bullish setup and shifts focus back toward deeper support.
If this idea resonates with you or you have your own opinion, traders, hit the comments. I’m excited to read your thoughts!
Market insights

BTC Trading Inside a Well-Defined RangeBitcoin continues to move inside a horizontal range with clearly visible zones used by smart money.
🔴 Distribution Zone (sells): 94,000 96,000
This area has repeatedly shown aggressive selling pressure. Smart money hunts liquidity here, taking out short stops and creating short-term reversals. As long as BTC stays below this zone, there is no confirmed bullish breakout.
🔵 Accumulation Zones (buys):
90,000 – 88,500
87,000 – 84,500
These zones show clean, consistent buyer reactions. Every deeper dip gets bought instantly — classic smart-money behavior when building positions step-by-step and defending key levels.
BTC is essentially trading between two zones of major interest.
Top = distribution.
Bottom = accumulation.
This is a typical balance phase before the market chooses a direction.
What matters now:
Price is pushing toward the top of the range without making new lows — buyers still hold the initiative.
But without a breakout above 96K, this remains a range controlled by smart money.
My focus:
Watch who takes initiative at the boundaries
Wait for either a strong breakout above 96K with volume, or a deeper test of the accumulation zones
No predictions inside the range only reacting to clear signals
For now BTC continues to trade in a structure where accumulation and distribution are clearly visible. True decisions happen at the edges.

FED RATE CUT idea - bull trapA head-and-shoulders setup suggesting a potential Fed rate cut on December 10, followed by a fake-out (bull trap).

BTC long ideadespite all the choppiness and seemingly radical moves, I believe bitcoin is still on course towards 98000.

Bitcoin 09.12.2025The price has spent a period moving between VAL → POC → VAH.
We can now see that it is successfully tapping into the upper zone of the VAH.
If buyers continue to show interest in this upper area, we may witness some notable reactions and potential shifts in market behavior.

BTC updates
Here’s the Bitcoin result as well: it has gained 4%, and as expected, the 90,500 level pushed the price upward with high precision.
If you’d like to see more of my analyses, make sure to follow.

BTC will drop soon....this is massively manipulatedThis may be related to the potential rate cuts which is being "priced in," but nothing fundamentally is improving BTC position and it still doesn't solve any real problems and will go back to 80k or even lower real soon. Retailers will jump in as exit liquidity and will get wiped out when it drops back from the massive losses taking place. Great to time to get into MSTZ! Easy 5-10% upside IMHO....

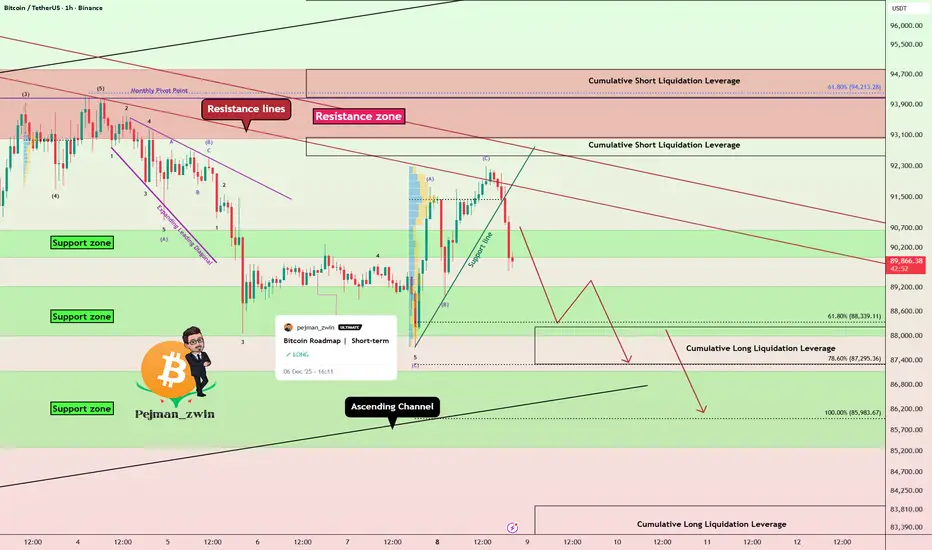
Bitcoin Breakdown After Perfect Bounce — Short Setup LoadingAs I expected , Bitcoin bounced from the support zone and reached its targets.
Right now, Bitcoin has rejected from resistance lines and successfully broke both the support line and the support zone($90,650-$90,000).
From an Elliott Wave perspective, it appears that Bitcoin has completed a ZigZag structure, and we should now anticipate the start of a bearish wave sequence.
The S&P 500 index( SP:SPX ) also shows a bearish outlook, and given Bitcoin’s correlation with SPX, further downside in BTC is not surprising.
At the same time, USDT.D%( CRYPTOCAP:USDT.D ) has turned bullish again—at least in the short term—which can add additional pressure on Bitcoin.
I expect Bitcoin to continue its downward movement, at least toward the next support zone($87,140-$85,290) and the lower line of the ascending channel.
Note: It’s better to wait for a bullish correction before entering, and then take a short position according to your own strategy.
Cumulative Short Liquidation Leverage: $98,260-$96,690
Cumulative Short Liquidation Leverage: $93,040-$92,560
Cumulative Long Liquidation Leverage: $94,840-$94,100
Cumulative Long Liquidation Leverage: $83,900-$82,400
Target: $87,733
Stop Loss(SL): $92,723(Worst)
Points may shift as the market evolves
💡 Please respect each other's opinions and express agreement or disagreement politely.
📌Bitcoin Analysis (BTCUSDT), 1-hour time frame.
🛑 Always set a Stop Loss(SL) for every position you open.
✅ This is just my idea; I’d love to see your thoughts too!
🔥 If you find it helpful, please BOOST this post and share it with your friends.

Bitcoin Trading range between two Points Resistance or Support Bitcoin Price is currently fluctuating within a defined range between 92k and 89K. The highlighted zone shows a period of consolidation with both bullish and bearish reactions inside the range.
Technically Bitcoin is maintaining its position inside this channel, but the overall structure is leaning bearish as price repeatedly tests the lower boundaries focus on the key levels, price may decline deeper toward the next major support areas at 87K and possibly 85K
If price holds above 90K a bullish rebound is possible, with potential upside targets at and 93K further at the upper channel level near 95k bullish scenario, where price bounces upward and breaks the upper region of the range, rising toward the marked targets.
If the price reacts to the bearish side where price fails to hold above support and follows a downward continuation downside then support level would be 87K to 85K,
You may find more details in the chart,
Trade wisely best of luck buddies.
Ps; Support with like and comments for better analysis thanks for supporting.

BTCUSDT Bullish channel holding strongAs observed on the chart, Bitcoin is trading within a newly formed ascending channel and is currently testing the lower boundary of this structure. This level represents a strategic support zone within the bullish technical framework, offering a favorable opportunity to consider initiating or adding to long positions with appropriate risk management.
Also if this channel resistance break to the upside then market is again bullish after a while.
DISCLAIMER: ((trade based on your own decision))
<<press like👍 if you enjoy💚

BITCOIN - BULLISH OUTLOOK CRYPTOCAP:BTC - I see an ascending consolidation 📈
No reason to be bearish on this dip yet, as we haven't revisited the previous key support that was broken earlier.
As I said, I anticipate a bullish reaction in the #alts market soon. #BTC is likely going to lead the way 📈
Key resistance levels I'm watching:
$ 93,500 📈
$ 98,500 🎯
$ 100,000 (weak)
101,000 − 101,500 🎯
$ 103,450 (weekly 50% fib)
If bulls manage to close a weekly candle above $ 103,000, that would mean we are likely going to see another price expansion to complete a new wave upward toward ATH & beyond 📈 (macro insight).
I'm 95% sure that late shorts are going to get liquidated here. Be cautious! 🔴
Let's keep building and share good vibes 🚀
Level by level team🎯- Not financial advice.

The Transformation Every Trader Must Make!!!Every trader begins with the same goal: “I want to make money.”
But the traders who last, the ones who grow, evolve, and eventually become consistent, go through a quiet transformation:
They shift from thinking about money...
to thinking about probability, structure, and process.
Here’s the transformation in three stages:
1️⃣From Outcome-Driven → Process-Driven
Beginners measure success by whether a trade wins or loses.
Professionals measure success by whether they followed their plan.
- Because a good trade can lose.
- And a bad trade can win.
- Confusing the two destroys growth.
Your job is not to win every trade!
Your job is to execute with integrity.
2️⃣From Prediction → Preparation
Beginners try to guess where the market will go.
They draw a level… then hope.
Professionals don’t predict, they prepare.
They plan both sides:
- If price does X, I do Y.
- If price breaks Z, I step aside.
- If the structure shifts, I adapt.
Prediction feeds the ego.
Preparation feeds the account.
3️⃣From Emotional → Probabilistic Thinking
Beginners think every trade is “the one.”
Professionals think in sample sizes.
- One trade means nothing.
- Five trades mean nothing.
- Fifty trades reveal the truth.
When you think probabilistically:
- Fear shrinks.
- Confidence grows.
- Discipline becomes natural.
Because now you see the market for what it is:
a place where anything can happen, but certain behaviors win over time.
📚 The Real Lesson
Trading becomes easier when you stop trying to force results and start building a process that produces results over the long run.
The market doesn’t reward intensity.
It rewards consistency, clarity, and adaptability.
Your transformation begins the moment you shift from:
“I need this trade to win”
to
“I need to follow my plan.”
That’s when you stop gambling… and start trading.
⚠️ Disclaimer: This is not financial advice. Always do your own research and manage risk properly.
📚 Stick to your trading plan regarding entries, risk, and management.
Good luck! 🍀
All Strategies Are Good; If Managed Properly!
~Richard Nasr
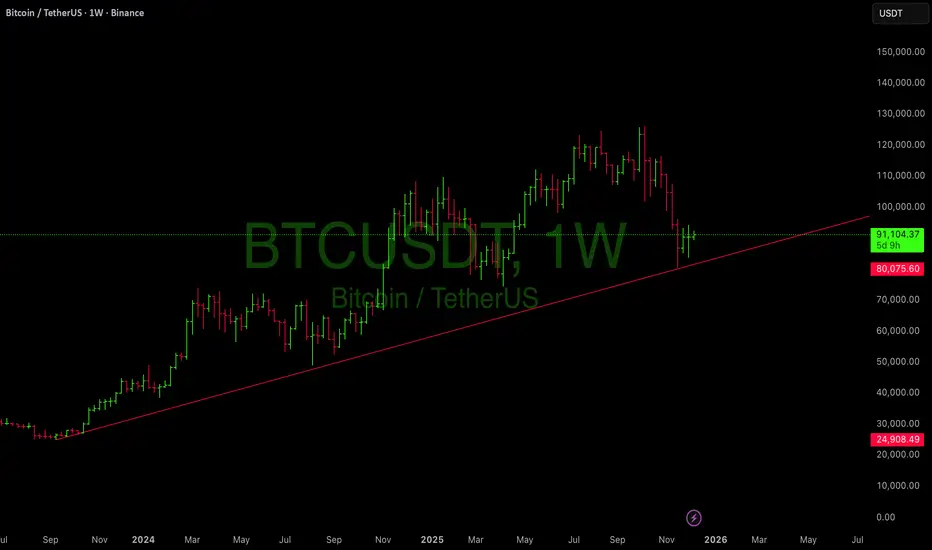
BTC – Trendline Retest Success | Momentum Reloading for Next LegBitcoin just completed a clean retest of its multi-year rising trendline, a structural level that has guided institutional accumulation since 2023. Price wicked below, tagged liquidity, and closed back above a classic bullish deviation → reclaim.
This type of structure historically marks the end of corrective phases and the beginning of new expansions.
📌 Key Bullish Factors
1. Long-Term Trendline Respect
Your chart shows a trendline starting from late 2023.
Price tapped it perfectly and is now holding above $80,000–$82,000, confirming:
Buyers stepped in where they were supposed to
Smart money defended the bullish structure
Heavy liquidation likely cleared weak longs
2. Weekly Candle Structure Turning
The last 2–3 weekly candles show:
Downward momentum slowing
Smaller bodies
Long wicks → buying from lower levels
A potential swing low forming at the trendline
Bitcoin is showing the early signs of seller exhaustion you typically see before a weekly reversal.
---
👉 The move tends to trap sellers before a strong leg up.
---
📈 Upside Targets (Weekly)
If BTC continues holding above trendline:
1. $98,000 – $102,000
→ First major liquidity pocket / inefficiency
2. $112,000 – $120,000
→ Prior breakdown zone + weekly imbalance
3. $135,000 – $150,000
→ Trend extension target / potential new ATH expansion
These are not promises they are structural destinations based on the weekly map.
---
## **🔻 Downside Invalidation**
The bullish thesis remains valid as long as Bitcoin doesn’t close a weekly candle below $80,000.
Break + close below would open deeper retracement into mid-70Ks.
But right now? The trendline holds strong.
---
🧠 Holistic Trader Insight
Institutional players accumulate on weakness, not strength.
When retail panics, smart money buys structure.
This entire move fits the textbook rules:
Trend intact
Liquidity swept
Structural level reclaimed
Momentum slowing into support
This is what early expansion phases look like.
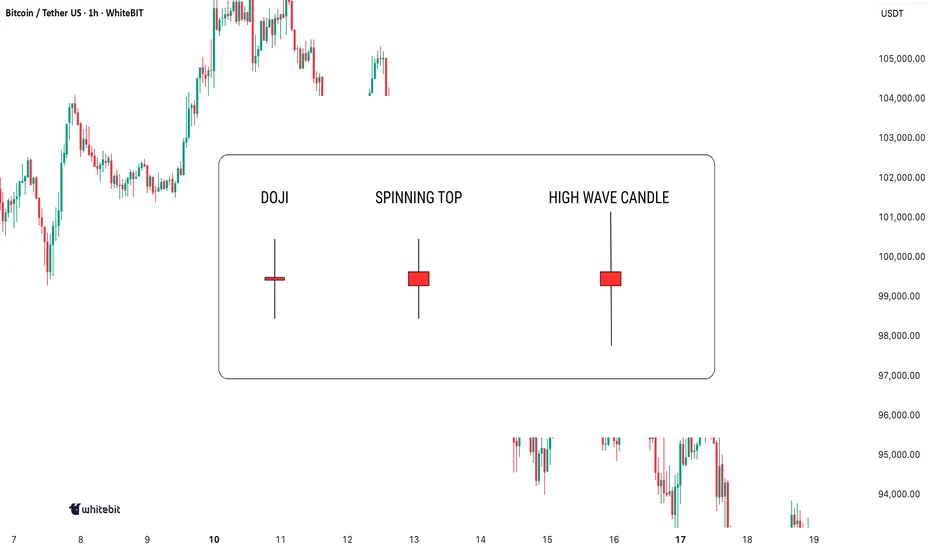
Indecision on the Chart: What These Candles Really MeanIndecision in the market? You're not alone. Every trader has faced those moments when the charts seem to scream confusion. But here's the thing: indecision candlestick patterns aren't just noise. They hold secrets that, when decoded, can give you the upper hand. Let's dive in and learn how to spot these patterns and use them to your advantage.
Mastering Indecision Candlestick Patterns
The most well-known indecision candles are the Doji, Spinning Top, and High Wave Candle. These candlesticks might seem tricky at first, but once you learn to recognize them and understand their context, they can serve as valuable tools in your trading strategy.
Doji
A Doji has a small body with nearly identical open and close prices, and long upper and lower wicks, indicating market indecision—neither buyers nor sellers gain control during that period.
When to look for confirmation: A Doji alone isn’t enough to trade. Wait for confirmation from the next candle: a bearish one after an uptrend may signal a reversal, while a bullish one after a downtrend might indicate the start of a rally.
Spinning Top
A Spinning Top is an indecision candle with a small body and longer upper and lower shadows. It indicates uncertainty, with more volatility than a Doji.
When to look for confirmation: A Spinning Top is more meaningful after a strong trend. Following an uptrend, it could signal weakening momentum. Wait for the next few candles to confirm the market’s direction.
High Wave Candle
The High Wave Candle is like the Spinning Top but with even longer wicks. It shows high volatility with no clear direction, as the price fluctuates widely but the open and close remain close, indicating indecision.
When to look for confirmation: Use the High Wave Candle with trend analysis. If it appears during consolidation or after a major move, it may signal a breakout. As with other indecision candles, wait for confirmation before acting.
Combining Indecision Candles with Indicators
While indecision candle patterns can provide useful insights, they are most effective when combined with other technical indicators. Here are some ways to use them in combination:
Moving Averages: Use moving averages (like the 50-period or 200-period) as a trend filter. If a Doji or Spinning Top forms above a moving average and the next candle confirms a reversal, it may signal trend continuation.
Relative Strength Index (RSI) : If an indecision candle forms when RSI is at extreme levels (above 70 or below 30), it may signal an upcoming pullback or reversal.
Volume: A high-volume candle following an indecision candlestick often confirms strong follow-through. Without volume, these patterns may be less reliable.
Where to Avoid Using Indecision Candles
While indecision candles are useful, there are some scenarios where relying on them without confirmation can be misleading:
Choppy Markets: Indecision candles appear frequently and may not signal real reversals.
During News Events: Sharp price spikes can create false indecision signals.
Lack of Context: A Doji in sideways price action has less significance than one after a strong trend.
Indecision candles signal uncertainty, but don’t act on them blindly. Always combine them with other analysis and make decisions based on your own judgment!
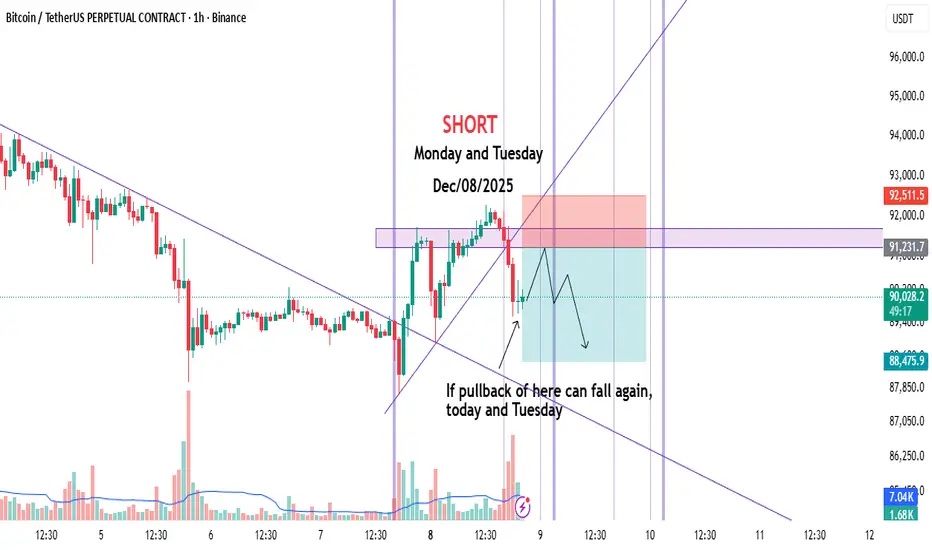
Daily Bitcoin Trade | Short | Monday | Dec/08/2025Hi Guys.
Given the trendline break and the static resistance formation, Bitcoin could be shorted today and tomorrow.
This is my personal setup.
Please be careful with your capital and don't forget the risk.
This is not an offer to buy or sell.
Good Luck :)
#BTCUSDT.P 2H ChartPrice previously bounced off a discounted area of demand and left a freshly printed demand zone on its way up. In addition, it recently got rejected off a minor area of supply and it is consolidating showing no major movements. Price is expected to tap into our demand zone where we have placed our limits aiming to break the previous swing high at $94,185.

TradeCityPro | Bitcoin Daily Analysis #245👋 Welcome to TradeCity Pro!
Let’s move on to the Bitcoin analysis. After the fake move we had yesterday, today Bitcoin has entered a ranging box.
⏳ 1-hour timeframe
Yesterday on Bitcoin we had a trigger at the 91447 zone that we could use as a long trigger.
🎯 Before that, we also had a trigger on Bitcoin at 89849 which had been activated, and with the break of 91447 the second trigger was also activated.
🎲 After this trigger was activated, given the trend weakness we had on Bitcoin, the price could not stabilize above 91447, and with that move being faked, it dropped again to 89849.
⛏ The 89849 zone is an important support area on Bitcoin, and the next support we have on Bitcoin is 88890.
✔️ Considering that Bitcoin has faked both the 89849 low and the 91447 high once, we can say currently there is no specific trend in the market, and we can open both short and long positions.
📊 For a long position, again we can enter with the break of 91447 and open our position.
✔️ In case the market drops, we have two short triggers:
the first is 89849 and the second is 88890, and by breaking either of them we can have a trigger for a short.
❌ Disclaimer ❌
Trading futures is highly risky and dangerous. If you're not an expert, these triggers may not be suitable for you. You should first learn risk and capital management. You can also use the educational content from this channel.
Finally, these triggers reflect my personal opinions on price action, and the market may move completely against this analysis. So, do your own research before opening any position.

BTCUSDT Trade Plan (December 08, 2025)BTC Trade Plan (December 08, 2025)
(D1 Bearish / H4 Sell Rallies → Compression / H1 Neutral / M15 Chop)
⬛️ 1. Higher Timeframe Context (D1 and H4)
• D1 bias: bearish (descending channel post-ATH)
• D1 range (approx): 84,000 – 126,000 (current lower third)
• Key D1 zones:
• Supply: 100–105k (broken)
• Demand: 88–90k channel low
• H4 bias: sell rallies turning compression (ascending triangle forming)
• H4 zones of interest:
• H4 Sell Zone 1: – recent rejection + supply cluster
• H4 Buy Zone 1: – weekend low + trendline
Active setups counter-trend long on dip (whale accumulation support), trend-aligned short only on clear rejection.
⬛️ 2. Preferred Setups by Horizon
🔳 2.1 Swing Setup (D1/H4)
Counter-trend long the channel low / whale accumulation zone. Time horizon: multi-day to weeks.
🔲 2.2 Intraday Setup (H1 focus)
Buy dips to 89.5-90k or breakout above 92k. Time horizon: intraday to overnight.
▫️ 2.3 Scalp Setup (M15 focus)
Scalp range 90-92k or absorption plays — higher risk in chop.
▪️ 2.4 Arbitrage/Pairs: BTC dominance rising → BTC outperforming alts short-term.
🟩 3.1 Long Setup (Trend-Aligned with On-Chain / Swing-Intraday)
• Execution timeframe: H4/H1
• Trigger timeframe: M15
• Entry zone:
• Pattern tags: Trigger conditions:
• Successful defense 88-90k zone + CVD higher low
• H1/H4 BOS up on volume
• Whale accumulation continuation
🟥 3.2 Short Setup (Counter-Trend / Scalp Only)
• Execution timeframe: H1
• Trigger timeframe: M15
• Entry zone:
• Pattern tags: Trigger conditions:
• Clear rejection with delta divergence high
• Failure to break 94k pre-FOMC
🔴 4. Stops (Invalidation Levels)
Long setups: 87,500 (channel break = bear confirmation)
Short setups: 94,500 (breakout = squeeze)
🟢 5. Targets
Long (swing/intraday):
• TP1: 92,000 (VWAP/H1)
• TP2: 94,000-95,000 (supply test/H4)
• TP3: 100,000+ (HVN/D1 optional)
Short (scalp):
• TP1: 90,000
• TP2: 88,500
⬛️ 6. Position Sizing
• Baseline trend-aligned long (on-chain supported): 1.0%
• Counter-trend short: 0.4%
• Adjustments: +20% (whale buying + clean lev + Fed tailwind) → Effective: longs 1.2% risk, shorts 0.3% max
⬛️ 7. Risk Flags
• FOMC Wednesday → vol expansion risk
• Thin liquidity mid-week
• Residual weekend trauma → fake moves possible
• Macro correlation re-assertion if equities dump
⬛️ 8. Flip Conditions
Bull → bear flip: clean close below 88k with volume + funding negative
Bear → bull flip: H4 close >94.5k + CVD reset + whale continuation
⬛️ 9. Alternative Scenario
Reject hard at 92-94k → descending triangle breakdown → fast move to 84-87k LVN void (bear trap completion, high risk short only with tight stop).
⬛️ 10. Model Self-Critique
• Assumptions: whale accumulation continues, Fed delivers dovish cut, no macro shock
• Vulnerabilities: sudden risk-off equities dump, whale distribution resumption, FOMC hawkish surprise
• Behavioural: do not chase breakouts pre-FOMC, do not average into losing shorts against whales
⬛️ 11. Uncertainty and Constraints
Uncertainty: medium → require flow + pattern confirmation, no high lev, prefer size on confirmed absorption only.

BTC/USDT Analysis. Uncertainty, but Long Bias Remains
Hello everyone! CryptoRobotics trader-analyst here, and this is your daily market update.
Yesterday, Bitcoin failed to show a clear directional bias and continued trading within a narrow range, accumulating volume. Pressure on the cumulative delta remains on the sellers’ side, especially on spot markets, which adds uncertainty to the current structure.
Despite this, the overall long bias remains intact: the broader structure has not been broken, and the probability of upward continuation after a local liquidity sweep is still high. However, Bitcoin may first retest the $87,800–$86,400 (volume zone) before forming a new bullish impulse.
During this phase of consolidation, it is more prudent to stay out of the market and wait for a clearer setup — either a reaction from key support or a breakout through resistance. This will provide a much cleaner risk profile for new long positions.
Buy Zones
$87,800–$86,400 (volume zone)
$84,000–$82,000 (volume anomalies)
Sell Zones
$94,000–$97,500 (volume zone)
$101,000–$104,000 (accumulated volumes)
$105,800–$106,600 (local resistance)
This publication is not financial advice.

BTC/USDT | Consolidation and fall (READ THE CAPTION!)By examining the 4H chart of BTCUSDT, we can see that BTC is struggling to make a move and is consolidating over the IFVG. If it fails to make a move, a fall to the Demand Zone at 86,600 is possible. However, if it manages to go up, it'll face the FVG at 94,500 level, which then determines whether BTC can make an upwards move or falls again.

Bitcoin (BTC): Seeing Bullish Signs | Need To Re-Claim 100 EMAThe 100 EMA has been tested multiple times on BTC, yet buyers did not manage to fully secure this area. What we see is a continuation of attempts to break this zone completely and secure it, and as buyers are showing volume, we are looking for it to happen.
Setup looks decent; the zone of liquidity is our stop zone, where the major target is the 200 EMA as of now!
Swallow Academy

