War news are actually good news for Crypto & GoldI Love Global Peace and hope all Wars end soon.
Here are my thoughts about Crypto when war Starts between two countries or more.
i think After wars so many reasons will help Crypto to see gain specially for Bitcoin which is the King of this market.
Some of the major Reasons in my view are:
A. Countries currency or Markets start to fall :
Usually with starting of war, we have two countries that are involved and due to negative effects of war on different Economic parameters cause weaker country or both currencies lose the power of Their currencies and it start To dump.
weak countries Bank can get hacked or worst scenario a countries currency can get 0 by the time.
most of the times Their stock markets also Face with huge losses.
B. People start to Buy more Gold or Bitcoin and ...
with things mentioned above and other reasons their People start to Buy more Crypto usually and Metals like Gold.
C. People start to migrate to other countries with their Crypto Wallets Only
Some start to leave their countries and Sell their Cars homes and ... and turn them to BTC or... and transfer their money and life to a peaceful country.
D. Spies and bribery gets more in those countries which all is done with Crypto usually
Corruption & Spy jobs and ... increases in those countries usually and the money on this Fields usually transfer Via Crypto or Gold and Silver which is harder to track.
And with these reasons which mentioned Above usually in the past all the Attention comes to Metal like Gold and the Value of it increase in Wars, but now Days Bitcoin(&Crypto Tokens) also gets more value and attention in war in my personal View and See gain in price too.
DISCLAIMER: ((trade based on your own decision))
<<press like👍 if you enjoy💚
BTCUSDT trade ideas

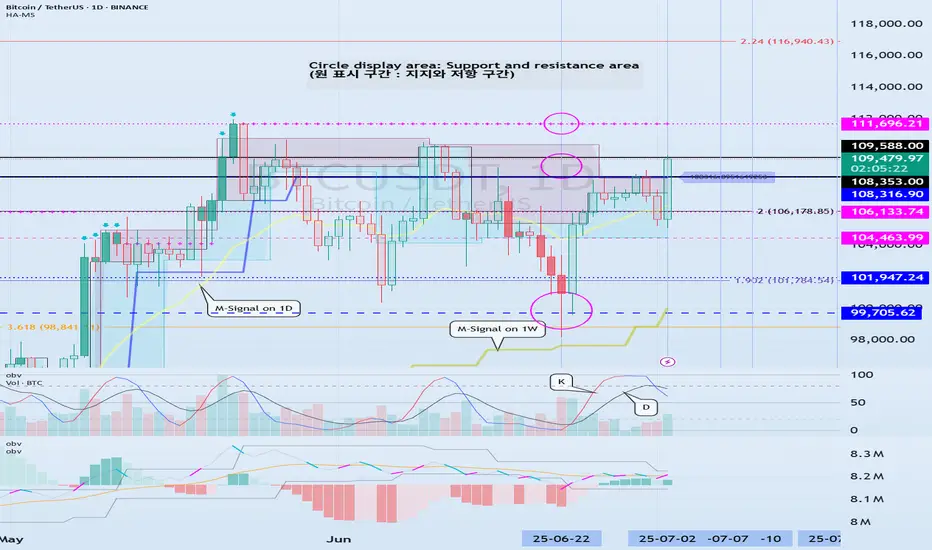
Check support at 108316.90-111696.21
Hello, traders.
If you "Follow", you can always get new information quickly.
Have a nice day today.
-------------------------------------
(BTCUSDT 1D chart)
Among the many trend lines, the one marked 1W is the important one.
Therefore, we need to look at whether it can rise above the 1W trend line or rise along the trend line.
If not, and it falls below 108316.90, it may lead to further decline, so we need to think about a countermeasure for this.
This volatility period is expected to continue until July 3, but it is expected to last until July 11, so caution is required when trading.
-
Indicators that indicate high points are DOM(60), HA-High, and StochRSI 80.
HA-High and StochRSI 80 are formed around 108316.90, and DOM(60) is formed at 111696.21.
Therefore, the 108316.90-111696.21 section is a high point boundary section, and if it is supported and rises in this section, it is highly likely that a stepwise uptrend will begin.
The conditions for a stepwise uptrend to begin are:
- The K of the StochRSI indicator must show an upward trend below 80,
- The PVT-MACD oscillator indicator must show an upward trend above the 0 point,
- The OBV of the Low Line ~ High Line channel must show an upward trend. If possible, it is better for the Low Line ~ High Line channel to form an upward channel.
When the above conditions are met, I think that if it is supported and rises in the 108316.90-111696.21 section, it is highly likely that a stepwise uptrend will continue.
If the above conditions are not met, it is likely that it will show a downward trend again while pretending to rise.
-
Thank you for reading to the end.
I wish you successful trading.
--------------------------------------------------
- This is an explanation of the big picture.
(3-year bull market, 1-year bear market pattern)
I will explain more details when the bear market starts.
------------------------------------------------------
Do you think I'm joking ???Chart is speaking itself...AB=CD.
previous analysis
Give me some energy !!
✨We spend hours finding potential opportunities and writing useful ideas, we would be happy if you support us.
Best regards CobraVanguard.💚

Bitcoin Short Setup at Key Daily ResistanceIn this analysis, you will find a clear scenario for a potential short setup with precise conditions for confirmation and invalidation. No fluff or guesswork—only institutional analysis of capital footprints and pure price action. I will provide updates for every stage of price interaction with the POI in near real-time, so you can make timely trading decisions, not just observe events after the fact.
Context: What Happened Before?
Bitcoin has perfectly played out Scenario 2 from my previous long analysis. After the liquidity sweep below, which confirmed that the instrument is locked in a large global range, it began an aggressive, correction-less rally. This is often the case after absorbing a large amount of liquidity, which essentially became the fuel for this rise.
The Short Setup
To break out of the range to the upside (or at least make a deviation above it), Bitcoin must overcome the first serious resistance zone. This zone consists of:
The 78.6% Fibonacci level from the daily structure.
Liquidity from the Previous Week's High (PWH).
My plan is to look for a short position if we see a reversal reaction from this zone after the liquidity is taken. The minimum target for this move would be the lower boundary of the range and the daily order block located there. This local move inside the range can be seen as a shorting opportunity.
Invalidation of the Short Scenario:
A break of the 78.6% level with the price closing firmly above it would cancel the short scenario. In that case, Bitcoin would likely continue its move towards the next resistance level.

Bitcoin - An Epic Move Awaits!Bitcoin gained 13% in H1 2025, outperforming Ethereum and Solana, which dropped ~25% and ~17% respectively—highlighting BTC's strength in turbulent market conditions.
Institutional wedge: spot-BTC ETFs saw huge inflows—BlackRock’s took in $336M, and total crypto product inflows approached $45B+ this year.
AI models foresee BTC holding $105K+ by end-June, with ChatGPT pointing to $118K and Grok forecasting $108K, based on momentum and ETF flows.
We see BTC holding the 20 MA and spiking to new all time highs.

BITCOIN BULL TRAP!!!? IS THIS YOUR SHORT ENTRY TO $44k?I am explaining a potential Bitcoin’s leading diagonal formation, that is forming an UHTF wave 1, that if successfully formed can be a start of the crash towards 44k!

BTC/USD Fake out before Pump | Bullish Flag formationBTC/USDT (1D) Market Outlook – July 1, 2025
Introduction
BTC is currently consolidating within a bullish flag pattern after printing a swing high at 108.9K and a recent swing low at 98K. The price sits just below a major supply zone.
Context 1: Key Zones
Supply: 104.6K – 112.1K
Demand: 74.4K – 82.5K
Fair Value Gaps (FVG): 3 zones below price, with one near 88–90K
Context 2: Technical Confluence
Liquidation Zone: 106.2K
Golden Pocket (Fib 0.618): 102.1K
Psychological Levels: 105K and 110K
Context 3: Market Structure
Pattern: Bullish flag
Trend (LTF): Sideways/consolidation
Volume Profile: Heavy activity near 105K–110K
Bullish Scenario
Breaks above 106.2K (liq zone)
Pulls back to 102.1K (golden pocket), forms higher low
Retests resistance for continuation
Alt scenario: clean breakout above resistance → ATH retest
Bearish Scenario
Breaks below 106.2K and flag support
Fills FVG, breaks prior low at 98K
Triggers macro downtrend toward 88–90K zone
Summary
BTC is at a decision point inside a bullish flag, facing supply. A break above 106.2K favors upside continuation, while rejection and a lower low could trigger a deeper retracement. Watch key levels closely.

BTC - Bullish SOON!Hello TradingView Family / Fellow Traders. This is Richard, also known as theSignalyst.
BTC has been in a correction phase, and it feels like it's taking forever! ⏳
As long as the blue trendline holds, the overall bias remains bullish. 📈
As BTC approaches the blue trendline—perfectly aligning with a demand zone and support—we'll be watching for trend-following longs to catch the next big impulse move upward. 🚀
For now, we wait! ⏳
📚 Always follow your trading plan regarding entry, risk management, and trade management.
Good luck!
All Strategies Are Good; If Managed Properly!
~Rich

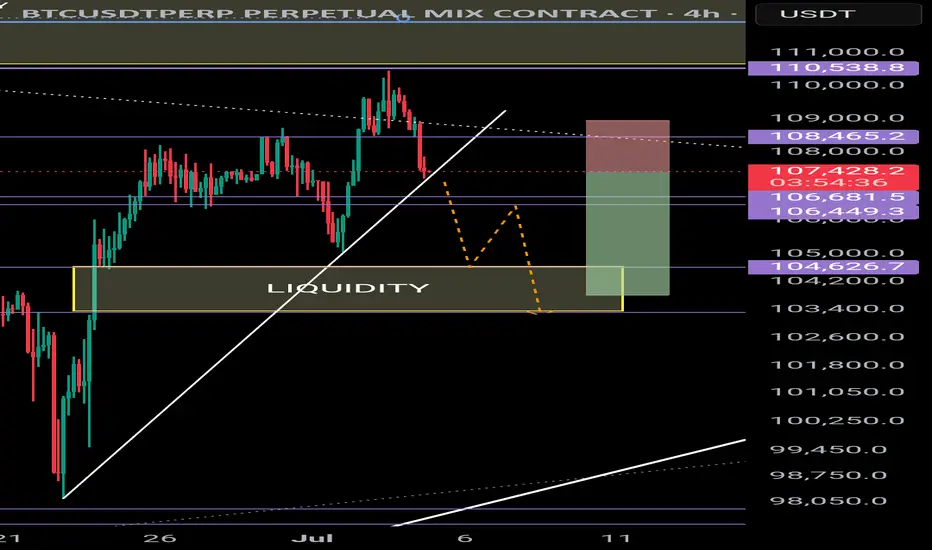
BTC correction - target4H
A break below the uptrend (white line) could result in a move down to 103,400 📉 which would fill a Fair-value-gap and grab liquidity.
Short position:
-3% vs +1%
2.3:1 Reward to Risk
BTC Preparing for Final Sweep Before Breakout?I’m currently waiting for a long opportunity on BTCUSDT. Price is consolidating in a range, and I believe we’re approaching the final support zone within this structure. The key area I’m watching is the 4H imbalance zone between ~102,968 and ~104,535, which also aligns with a strong structural support level.
I expect price to sweep this area, potentially triggering stop-losses below recent lows and then show a bullish reaction If confirmed, I’ll look to enter long targeting the liquidity resting around 108,762.
I’ll be watching closely for a reaction and confirmation

PSYCHOLOGY OF A CRYPTO CYCLEWe expected a pullback, and now thats behind us!😅
The market is back on track, and we are firmly in the #Belief phase of the bull cycle.
With heavy short liquidity stacked around $110K, a push into that zone could trigger a short squeeze, launching us into the #Thrill phase.
And if momentum holds, all signs point to #Euphoria by late 2025.
Favorites so far this cycle:
🥑 POLONIEX:GUACUSDT 🔗 POLONIEX:LLUSDT 🎮 KUCOIN:MYRIAUSDT
🌐 HTX:SYNTUSDT 🧪 MEXC:DEAIUSDT 🏠 OKX:PRCLUSDT
🧱 MEXC:YBRUSDT ⛏️ MEXC:KLSUSDT 🧩 $RUJIUSDT
Comment below your favorite coins!

BTC - Testing Trendline Here is an update to our previous post:
Zoom into the lowertime frame (1H) here is a zoomed in look at what is going on. Right now BTC just tested the trendline we pointed out in the last post. As you can see we have many touchpoints of support on this trendline (green arrows). Very important to monitor BTC's price action around this trendline.
If price is to lose this level then we would want to watch our fib target of $103k. If price can continue to hold it as support then a move back to test the red trendline is likely.

Bitcoin Short-Term Outlook – Coming Week📈 Bitcoin Short-Term Outlook – Coming Week
Currently, Bitcoin is expected to gather liquidity around the $106,000 zone, potentially initiating a move toward the $110,000 resistance level.
This area will be crucial in determining the next directional move.
🔍 The market's reaction around $110,000 will be closely monitored, and the analysis will be updated once that level is reached.
📌 Note: This outlook is based on current market conditions and may require adjustments if sentiment or price structure changes.

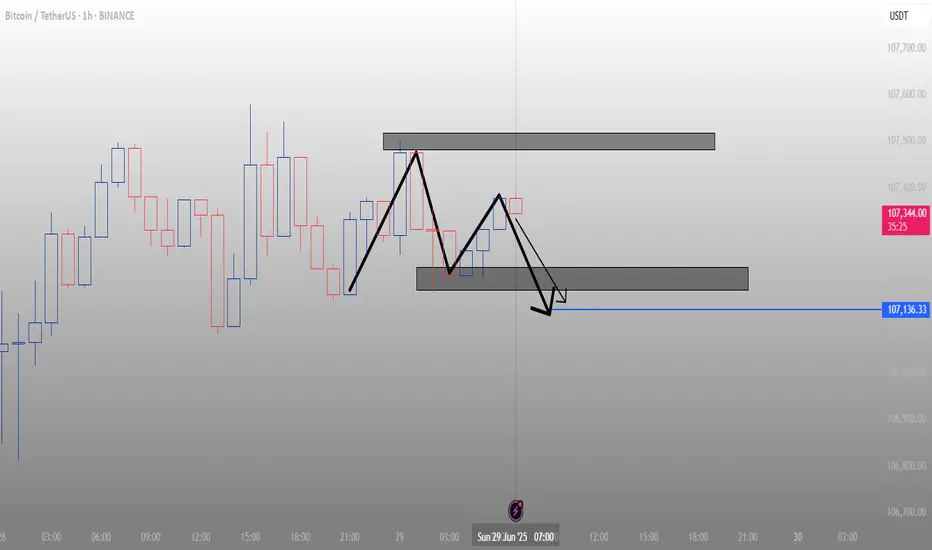
trade idea on btcthis is my idea about bitcoin movement in next hours.the target is shown in picture.follow for more....
BTC - Daily Chart - Bull flag route 7/1/2025July 1st, 2025
BTC - Daily Chart
A bull flag route = Two Scenarios
1. Breakout - UP
- Retrace before the $105k area
- Consolidate
- Break out the top line
SL $104k
TP1 @ 108k
TP2 @ 111k
Final TP @ 113k NEW ATH
2. Fail support - DOWN
- 105k fail to support
- Aim for the button of the flag for support
SL $106k
TP @100k
Final TP @96k

BTC - Double Top after Liquidity Sweep?Price has recently executed a Buy Side Liquidity Sweep just above the previous high. This type of move often signals a potential shift in market direction, especially when followed by signs of exhaustion or failure to push higher. In this case, price has formed a double top near the 106,600 level, a classic sign of weakening bullish momentum and hesitation at a key resistance area.
Following the Sweep, the projection suggests a possible rejection from this region, leading to a corrective move to rebalance the inefficiencies left behind by the sharp upward impulse. These inefficiencies are marked as Fair Value Gaps —areas where price moved too quickly, leaving imbalanced zones between buyers and sellers. The market tends to return to these areas over time as it seeks equilibrium.
The first Gap lies just below the 0.28 Fibonacci retracement and may serve as an initial area for a reaction. If price slices through this level without meaningful support, attention shifts to the second Gap, which aligns closely with the 0.50 to 0.618 retracement zone. This region is historically significant for pullbacks and could offer a temporary pause or bounce.
Should the move extend further, the third and deepest Gap, located between the 0.618 and 0.65 levels , becomes a key area of interest. It marks a critical rebalancing zone that could attract stronger buying interest. If this area fails to hold, the 0.786 retracement level sits just below and may act as a final point for support before any broader directional change.
For refined entries, traders can watch lower timeframes like the 5-minute chart. Look for signs of weakness, such as an inverted Gap or a lower-timeframe break in structure, to time positions with tighter risk. This allows participation in the broader move while maintaining tactical precision.
The confluence of a Buy Side Liquidity Sweep, a double top , and multiple Gaps below provides a clear framework for a potential downside play. As always, let the price action lead.
Patience, confirmation, and context are key to executing with confidence.

BTC - Reaching to the highest resistance.Bitcoin is approaching its highest resistance zone ever. As it approaches this zone, we need to closely observe the reactions including:
- Price patterns
- Candlestick patterns
- BTC Chart.D

BTC/USDT Technical Analysis, 2025-07-01 19:30 UTCA bullish trade opportunity was identified after price action formed a Piercing Line candlestick pattern, signaling a potential reversal from recent lows.
🔹 Technical Overview:
Entry Price: 105,869.86 USDT
Take Profit (TP): 106,939.86 USDT
Stop Loss (SL): 104,669.86 USDT
200 EMA: 106,320.49 USDT (Price is trading below — potential dip-buy opportunity)
Pattern Detected: Piercing Line (bullish reversal)
🔹 Volume Context:
Recent candles showed moderate volume with signs of buyer interest increasing.
OBV trend has turned slightly positive, supporting a short-term bullish case.
🔹 Order Flow:
Price action is showing signs of recovery from a local support zone.
Some imbalance in the order book tilted toward buyers, with supportive bid liquidity observed.
This setup combines trend deviation, bullish price action, and support reaction, creating a favorable risk-to-reward scenario. Trade is now active and being monitored toward the defined TP level, with strict stop-loss protection in place.

Bitcoin Next Move These are the two levels I am currently looking at to trade.
If we sweep the local high at 109k then we will be trading into a zone of supply as well which is good confluence in terms of a setup, most important is going to be the reaction of price off of that level.
My higher probability setup will be around the 111k level as that is where we have multiple sets of Poor highs and it is closer to the range high. I always prefer trading near the extremities of the ranges for higher probability setups.
I would also consider a long from 103k if we get a fast flush into that level but I prefer 101-102s to long as that is at the range low.
Note:
1. Always observe reaction at key levels before entry to avoid forced trades.
2. Maintain disciplined stop loss placement especially near supply sweeps and flush longs.
3. Prioritize setups at range extremes (102k or 111k) for optimal entries aligned with your edge.

The Pattern That Could Launch Bitcoin, pt. 2There appears to be an IH&S pattern forming inside of the larger IH&S's right shoulder (see my previous post for the larger one). I've seen this happen a few times and then a break out upwards! Results may vary of course lol.
If it drops from here support could be at around $102k and then $100,500.

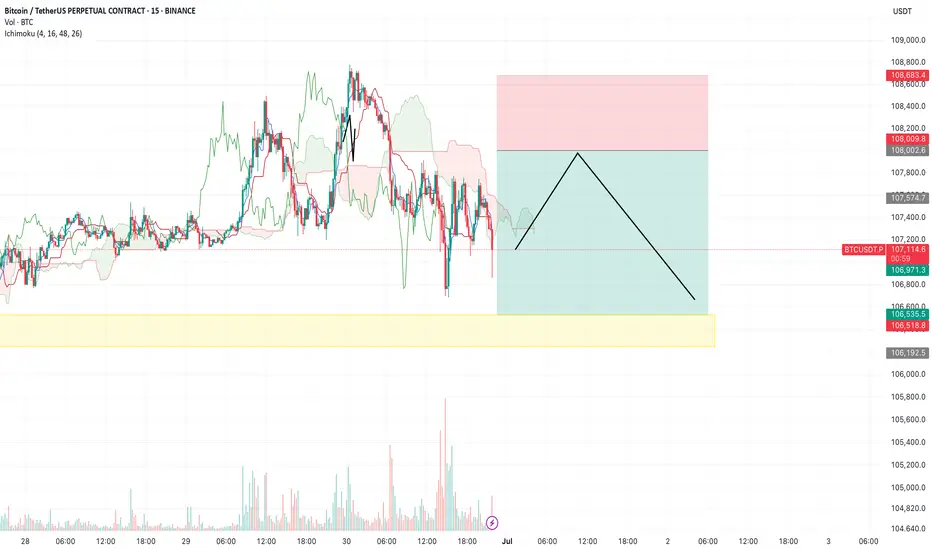
BTC/USDT – Trade Review & New Plan (15m, Ichimoku) by RiscoraYesterday’s short setup didn’t work out as planned — stop-loss was hit as bulls showed strong momentum. However, I still believe that a move to the yellow block (downside liquidity zone) is possible, and the idea remains valid.
The main mistake was with the stop placement, not the scenario itself. After taking a loss, I’m more cautious: reducing risk, lowering position size, and entering with less conviction. Bulls were dominant yesterday, so I’m keeping my risk tight on this trade.
I’ll take the setup again, but with a more conservative approach. If price breaks and holds above my stop-loss level, it will confirm a shift in sentiment to bullish, and I’ll look to flip my bias accordingly.
Key points:
Previous short was stopped out — reviewing risk
Still see potential for a move to the yellow block
Lower risk, smaller size after a loss
If price holds above stop, trend flips bullish
Let’s see how this plays out.
#BTC #Crypto #Trading #Ichimoku #Riscora
Outside of the analysis🔔 The Awakening of Legendary Whales | 9 Transactions from 14-Year-Old Wallets! 🔔🕯
Today, the market witnessed a rare event:
Addresses that had been completely dormant since 2011 (back when BTC was under $2!) suddenly woke up — each moving 10,000 BTC, worth around $1 billion!
📌 Details of some transactions:
💸 10,000 BTC
💵 Approx. ~$1.08B
📤 From: A wallet inactive for 14.2 years
⌛️ Time: 18:15
💸 10,009 BTC
💵 Approx. ~$1.079B
📤 From: A similar address, slightly different amount
⌛️ Time: 18:32
🖥 Analysis:
This simultaneous awakening of multiple ancient wallets, along with the movement of BTC toward exchanges, suggests:
There might be a large-scale plan behind the scenes
Possible market play by first-generation whales
Or a project undergoing restructuring and asset redistribution
👀 Interesting fact: In 2011, these addresses were only worth around $34,000. Today? They're moving billions.
💎 When Bitcoin’s past wakes up, the future starts to tremble…
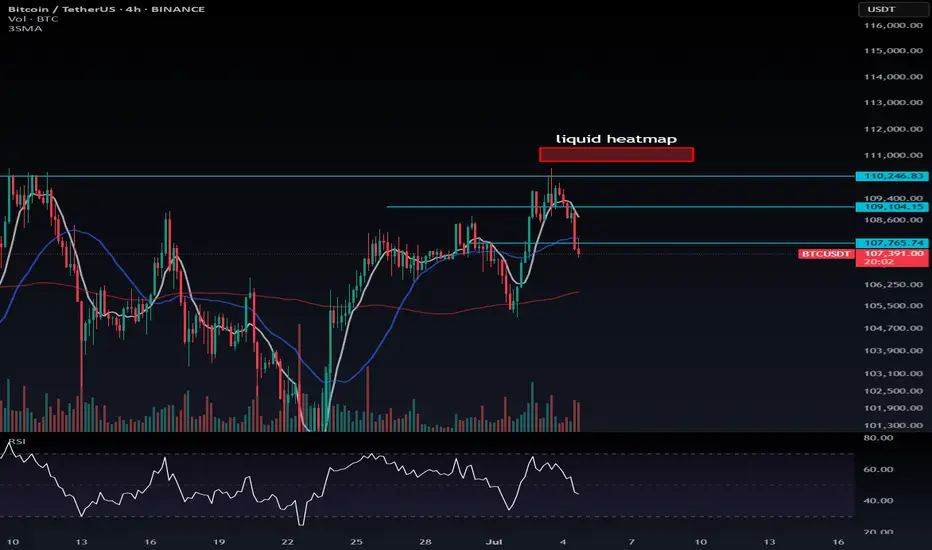
BTC on Close Compression -110k?Not now, but looks like will test 107,800 again from the point, what say?
