BTC Update — Head & Shoulders Wipeout Loading🌊📉🏄♂️
BTC pushed all the way into that 90K resistance wall last week, cracked above it for a split second, but the bulls just couldn’t keep the board steady up there. The breakout had zero follow-through. As soon as the new week opened, sellers smacked price right back below 90K 💥 — pure rejection energy.
And then comes the spicy part:
BTC printed a clean head & shoulders reversal pattern right on top of that level. You don’t see them that perfect at macro resistance too often 🤙⚠️. It’s basically the market throwing up a big glowing sign saying “momentum’s fading, brace yourself.”
Since that rejection, price has been sliding with almost no fight — smooth downside flow, weak bounces, and candles drifting like they’re just following gravity. Right now BTC is cruising toward the 80K support zone, but let’s keep it real: that zone is not the strongest reef on the map 🪨😅. It’s more like a soft sandbar than a rock-solid base.
If bears keep their rhythm and push with conviction, the next meaningful level where price could actually stabilize is the 75K region — a spot with deeper memory, stronger liquidity, and way more structure behind it.
The vibe here?
The chart is moving clean, respecting levels, and flowing exactly the way the pattern suggests. No need to panic, no need to guess — just ride the structure and let the waves tell the story 🌊📊🔥.
Could BTC still bounce inside this move? Totally. But until we see stronger reactions from buyers, the downside waves are the ones with real shape and momentum.
This is one of those conditions where patience, awareness, and discipline pay more than prediction.
💬 What do you think about this scenario? Only share your idea if you’ve got another opinion — otherwise just hit that button 👍
#BTC #Bitcoin #Crypto #Trading #TechnicalAnalysis
Market insights

Bitcoin (BTC): 100 EMA Holds | Entering Into Bear Market SoonBitcoin buyers are not giving away that 100 EMA easily; they hold this zone and as long as we are above that mark, we are looking for one last bullish movement here.
Now if we talk about cycle times and how long each cycle has been lasting, we can assume that we are about to enter the bearish market, but one last push should follow before the dip.
So we are looking for a bearish market to start around Dec-March, as soon as we get that one last pump.
Swallow Academy

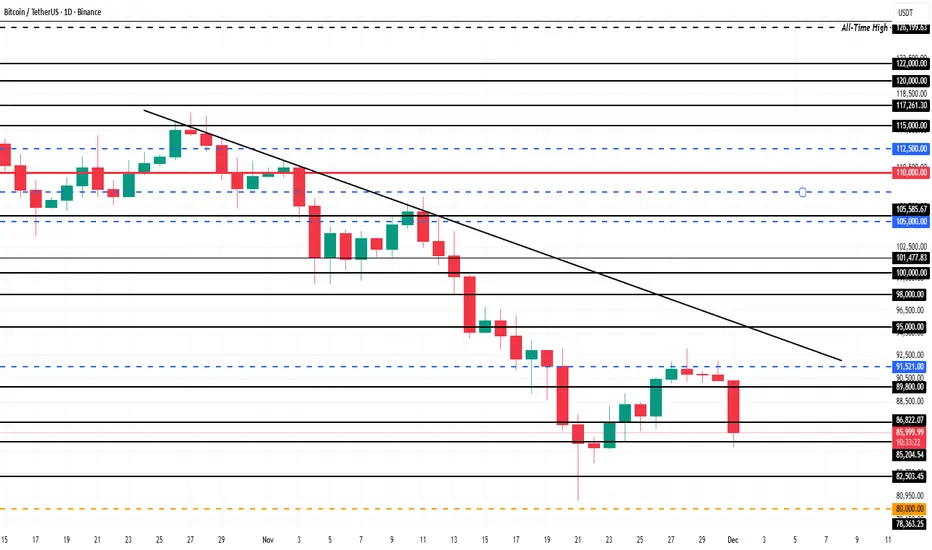
Bitcoin Price Falls To $86,000; Will It Shake Out Weak Hands?Bitcoin is trading at $86,005, holding just above the $85,204 support level. The asset remains trapped under a persistent downtrend that has lasted more than a month. This would preventing any sustained recovery attempts.
If market conditions worsen or short-term holder selling accelerates, Bitcoin could break below $85,204. A drop through this support would expose the price to $82,503 and potentially deepen losses as fear rises across the market.
However, if buyers step in and support strengthens, Bitcoin could reclaim upward momentum. A bounce from current levels could send BTC toward $89,800. A decisive move above that resistance would be essential for Bitcoin to retest $90,000 and invalidate the bearish thesis.
price reductionWe can predict a price decline to the support floor in the inverted triangle pattern.

BTC pressure and downtrend continueBTC H4 Chart Analysis
Bitcoin on the H4 timeframe is currently showing a corrective pullback after reaching a key resistance zone around 95,500–96,300, which aligns with the descending trendline, previous supply zone, and EMA confluence (200 EMA + 300 EMA). This rejection indicates strong selling pressure and confirms the zone as a major resistance area.
Key Technical Points:
🔹 Strong Rejection at Major Resistance:
Price reacted sharply from the supply zone and failed to break above the descending structure, signaling sellers are still active.
🔹 Break of Short-Term Bullish Structure:
The recent drop has broken the ascending trendline, showing weakness from buyers and a potential shift back to a bearish correction.
🔹 EMA Dynamic Resistance:
Price remains below the 200 EMA (red) and the long-term moving average (white) — suggesting bulls still lack full control and the broader trend remains under pressure.
🔹 Volume Profile Confirmation:
Most liquidity sits below current price levels, hinting the market may revisit demand zones before attempting another move higher.

BITCOIN - PRESSURE BUILDING - SHORT SQUEEZE INCOMING?Traders,
Bitcoin might be preparing a short squeeze. Let’s walk through the flow, structure, math, and correlations step-by-step so you understand what is happening and why it matters.
1. What Happened
Bitcoin dumped from 96k → 80.6k last week. Price then bounced and is now trading around 87k.
Under the surface:
Stablecoin-Margined Futures (USDT-M)
Since 27 Oct:
OI increased from 225k → 280k contracts
That’s +55k contracts (~24% increase)
CVD went down, not up
Meaning:
These new positions were mostly shorts
The market added leveraged short exposure during the dump
Interpretation:
USDT-M traders attacked the move lower aggressively. Increasing OI + dropping CVD = new sellers dominating, not buyers.
Coin-Margined Futures (BTC-M)
Since 27 Oct:
OI and CVD both dropped from 7.41B → 5.90B
BTC-M is usually “higher conviction” demand
A drop in BTC-M CVD means
Longs closing
Capitulation
Reduced bullish positioning
Interpretation:
Native BTC longs stepped aside. Short-term leverage traders pressed the downside.
Spot + Futures CVD (27 Oct → 21 Nov)
Spot CVD ↓
Futures CVD ↓
Price ↓
All making lower lows and lower highs
This was a clean, correlated downtrend.
2. The First Major Shift: Spot CVD Divergence
Since 21 November:
Spot CVD:
Higher highs
Higher lows
Rising together with price
Indicates real demand stepping in
Stablecoin Futures (USDT-M):
Still making lower lows
Still pressing shorts
Still fighting the spot buyers
This is the key:
Spot = real money
Futures = leveraged speculation
Rising spot CVD vs falling futures CVD = absorption pattern
Meaning:
Strong hands buy
Weak shorts keep selling
Price rises anyway
The pressure builds
Shorts eventually run out
The squeeze begins
This is one of the cleanest pre-squeeze structures you can get.
3. The Math: Fibonacci Rotation Logic
Let’s break down the structure.
(A → B → C Structure)
A = 116k (27 Oct)
B = 98.710
C = 107.403 (retracement)
The retrace sits at 0.5.
The reciprocal extension is 2.0
The 2.0 extension lands exactly at the 21 Nov wick (~81k)
This is a perfect harmonic rotation.
(X → Z → A Extension)
X = 06 Oct high
Z = 18 Oct low
A = 27 Oct high
Fibonacci extension from X → Z → A:
1.618 extension = 80.544
It matches the 2.0 from the ABC structure
It matches the 0.886 retracement on the HTF
Three independent mathematical signals hitting the same level. This is extremely rare and confirms the 81k zone as a rotation completion.
4. Structure Break
Since the 10 Nov low:
4H is making higher highs & higher lows
The descending trendline from 11 Nov is broken
Trend shifted from controlled downtrend → early reversal
Structure now favors continuation upwards as long as higher lows hold
Interpretation:
Sellers who relied on the trendline no longer have control.
4.5 Intermarket Correlation: Why Bitcoin Dumped When ES Dumped
Another important factor:
Bitcoin dumped because ES dumped.
From 12 Nov → 21 Nov:
S&P500 (ES)
Dropped from 6900 → 6525
–5.43% correction
Bitcoin:
Dropped from 107k → 80.5k
–24.77% correction
BTC acted as a ~4.5× levered version of ES.
BTC acted as a ~4.5× levered version of ES.
Correlation Data:
Rolling BTC/ES correlation increased from 0.38 → 0.74
Meaning BTC traded almost in sync with equities during the selloff
Why?
Risk-Off Mechanics
When ES sells off:
Equity funds de-risk
Macro algos rotate out of high beta
Volatility spikes
Systematic funds reduce exposure
Crypto is treated as “high beta tech”
BTC amplifies the move by a factor of 3–5×
Bitcoin didn’t dump because crypto was weak — It dumped because macro markets were risk-off.
Why this matters now
ES has stabilized
BTC stopped following ES lower
Spot demand started rising
BTC/ES correlation is dropping again (from 0.78 → ~0.55)
USDT-M shorts didn’t adjust
This is exactly when short squeezes start on BTC:
Macro stabilizes
Crypto regains independence
Shorts remain positioned for risk-off
Spot buyers take control
Price accelerates upward
This is a classic intermarket correlation unwind.
5. USDT Dominance (USDT.D) Confirms Risk Rotation
USDT dominance has turned down, which means:
Traders are deploying capital
Less stablecoin sitting idle
More risk-on appetite
Historically aligns with BTC beginning new legs up after HTF rotations
When USDT.D falls at the same time spot CVD rises, the market is shifting capital into crypto.
6. Targets: 118.5k → 124k
These are the next liquidity magnets.
Target #1: 118.5k
Confluences with:
1.141 extension of the 11 Nov → 12 Nov move
First major liquidity pool
First real “decision point” for the market
Target #2: 124k
Confluences with:
A weak high that will be swept
1.618 extension of the same 11→12 Nov move
Natural squeeze exhaustion zone
Perfect location for a Swing Fail Pattern
Rotation Logic
Shallow retraces → larger extensions (1.618 → 2.0)
Deep retraces → smaller extensions (1.272 → 1.414)
BTC currently fits the shallow retrace profile → favors strong extension
7. Other Pivot Points
Marked on the chart:
Minor LVNs
Minor-imbalances
CME Gaps
Expect reaction at each point.
8. Invalidation & Bearish Pathway
My invalidation is clear:
Trading below 80k invalidates the squeeze setup.
Below 80k, the absorption breaks.
If 80k is lost, the downside extension levels become:
74k
70k
64k
These levels are:
The natural downside extension pathways from the 11 Nov → 21 Nov swing
They form the mirrored rotation of the bullish structure
Final View
We dumped because macro went risk-off
Bitcoin amplified the ES selloff
Shorts loaded heavily into the move
Spot buyers stepped in first
A clean absorption pattern formed
Mathematical rotation completed at ~81k
Structure flipped
Risk metrics like USDT.D turned down
Correlation with ES is now unwinding
If Bitcoin continues to hold above 80k and spot keeps leading, the squeeze toward 118.5k → 124k becomes the most likely path.
Abbreviation List
BTC – Bitcoin
ES – S&P500 E-Mini Futures
OI – Open Interest
CVD – Cumulative Volume Delta
USDT-M – Stablecoin-Margined Futures
BTC-M – Coin-Margined Futures
HTF – Higher Timeframe
LVN – Low Volume Node
AVWAP – Anchored Volume-Weighted Average Price
PRZ – Potential Reversal Zone
SFP – Swing Fail Pattern
Fib – Fibonacci
CTA – Commodity Trading Advisor (systematic trend-following funds)
VIX – Volatility Index
Beta – Sensitivity of an asset’s movement relative to a benchmark
Risk-Off – Market environment where investors reduce exposure to risky assets
Risk-On – Market environment where investors increase exposure to risky assets
-----
If you enjoy this type of deep, data-driven breakdown—spot vs futures, CVD flow, intermarket correlation, and rotation math—drop a like and leave a comment. It helps me see whether these higher-level analyses bring value, and it motivates me to keep sharing them for free.

$BTC | $ALTS Scalp Setup Coming?I’m waiting for CRYPTOCAP:BTC reversal on STF if it bounces from current zone, I’ll take scalp entries in alts if it doesn’t reverse, I’ll stay flat.

TradeCityPro | Bitcoin Daily Analysis #237👋 Welcome to TradeCityPro!
Let’s move on to the Bitcoin analysis. The market experienced a strong drop yesterday, and with the start of a new week and a new month, a fresh trend is beginning to form.
⏳ 1-Hour Timeframe
Yesterday, we had a long trigger on Bitcoin at 91,089. After activation, the price moved upward toward 91,813.
🔔 The 91,813 level was our next long trigger, and breaking it could have pushed the price toward the main resistance at 93,555.
✔️ But that didn’t happen.
The price was rejected from 91,813, and gradually, selling pressure increased across the market.
📊 Once the price stabilized below 90,421 — which was our short trigger — the main bearish move began. Bitcoin dropped sharply with a large bearish candle all the way down to 85,770.
🔍 The support zones at 89,082 and 87,942 did not hold either, because the move was extremely sharp and the price ignored them entirely.
💥 If you remember, we also had a momentum support on the RSI at 42.11.
💫 Once RSI stabilized below that level, the bullish momentum completely disappeared. Momentum shifted fully to bearish.
⚡️ Right now, RSI is still in the oversold zone and is pulling back toward the 30 level.
⚖️ If RSI starts moving downward again from here, Bitcoin has the potential to drop much further.
💡 Today, opening a position is much riskier than yesterday, but if you missed the move, breaking 85,770 isn’t a bad option for a continuation short.
✨ Just be careful: the market today is far more risky, so take positions with smaller risk and tighter management.
❌ Disclaimer ❌
Trading futures is highly risky and dangerous. If you're not an expert, these triggers may not be suitable for you. You should first learn risk and capital management. You can also use the educational content from this channel.
Finally, these triggers reflect my personal opinions on price action, and the market may move completely against this analysis. So, do your own research before opening any position.

01/12/25 Weekly OutlookLast weeks high: $93,088.10
Last weeks low: $85,279.04
Midpoint: $89,183.57
A brutal start to the week for the bulls here. A -6% move to the downside as soon as the Month of December opens rejecting off the range weekly high. Across the high time frame this confirms a new lower high and a failure to get back within the trend that has stayed consistent throughout this bull market.
All of last weeks recovery bounce has been wiped out in a matter of hours, so now the question is where does the buy side pick up, if at all? FOMC interest rate decision is predicting another rate cut (80% probability) as well as the end of quantitative tightening and the beginning of quantitative easing on paper should bring more liquidity into risk-on markets such as Bitcoin, but that is on a longer timescale.
In the more immediate time frame I think the range broadly $80,000-$100,000 with this weeks range seeing a lot of the noisy PA. Midpoint is a key S/R level to gauge sentiment and conviction, a reclaim of the level may open the door to a stop loss hunt around weekly high but for now the momentum is definitely with the bears.

Bitcoin's massive fall to $50,000. OMGA massive bankruptcy for a strategy company with Bitcoin falling to $50,000, and this event will be the driving force behind the price explosion to $500,000 over the next 10 years, making it the biggest investment opportunity of the century. So, follow the market direction without bias and know that huge companies have gone bankrupt before with the fall of even gold, but gold has always recovered and remained a store of value, and this time it is Bitcoin's turn to test.
Patterns, fundamentals, technicals, and all indicators and oscillators confirm this scenario, so let's remain unbiased.

Analytics: market outlook and forecasts
WHAT HAPPENED?
Last week, we continued the upward movement to the next selling zone. After reaching it, the market moved sideways, forming a pivot point at $ 90,000. We expected a reaction and continued purchases to the next zone, but a less likely and more negative scenario worked out.
Today, at the opening of trading, an active seller increased the pressure, which led to a breakdown of the lower consolidation boundary. The context abruptly changed to a top-down one. The decline stopped in the local buying zone of $88,000-$86,000. At the same time, all volumes from below are absorbed by limit orders, and the reaction of buyers doesn't give grounds to expect a rapid recovery in growth.
WHAT WILL HAPPEN: OR NOT?
The base scenario is a correction to the zone of volume anomalies of $84,000-$82,000. Increased protection can be expected from this area. However, if the selling pressure persists, resistance may already appear at the levels of $86,000-$88,000.
If protection doesn't appear, the week will turn out to be bearish again, and the decline will continue at least to the level of $ 74,500.
Buy Zones
$84,000–$82,000 (volume anomalies)
Sell Zones
$89,800–$90,800 (cluster anomalies, mirror zone)
$94,000–$97,500 (volume zone)
$101,000–$104,000 (accumulated volumes)
$105,800–$106,600 (local resistance)
IMPORTANT DATES
We're following these macroeconomic developments:
• Monday, December 1, 14:45 (UTC) — the publication of the index of business activity in the US manufacturing sector for November;
• Monday, December 1, 15:00 (UTC) — publication of the US manufacturing price index for November;
• Tuesday, December 2, 1:00 a.m. (UTC) — speech by Fed Chairman Jerome Powell;
• Tuesday, December 2, 10:00 a.m. (UTC) — publication of the European Consumer Price Index for November;
• Tuesday, December 2, 15:00 (UTC) — publication of the number of open vacancies in the labor market (JOLTS) USA for September;
• Wednesday, December 3, 13:15 (UTC) — publication of changes in the number of people employed in the US non-agricultural sector in November;
• Wednesday, December 3, 14:45 (UTC) — publication of the index of business activity in the US services sector for November;
• Wednesday, December 3, 15:00 (UTC) — publication of the index of business activity and the index of prices in the non-manufacturing sector of the USA for November;
• Thursday, December 4, 13:30 (UTC) — publication of the number of initial applications for US unemployment benefits for the week;
Friday, December 5, 15:00 (UTC) — publication of the basic price index of US personal consumption expenditures for September.
*This post is not financial recommendation. Make decisions based on your own experience.
#analytics

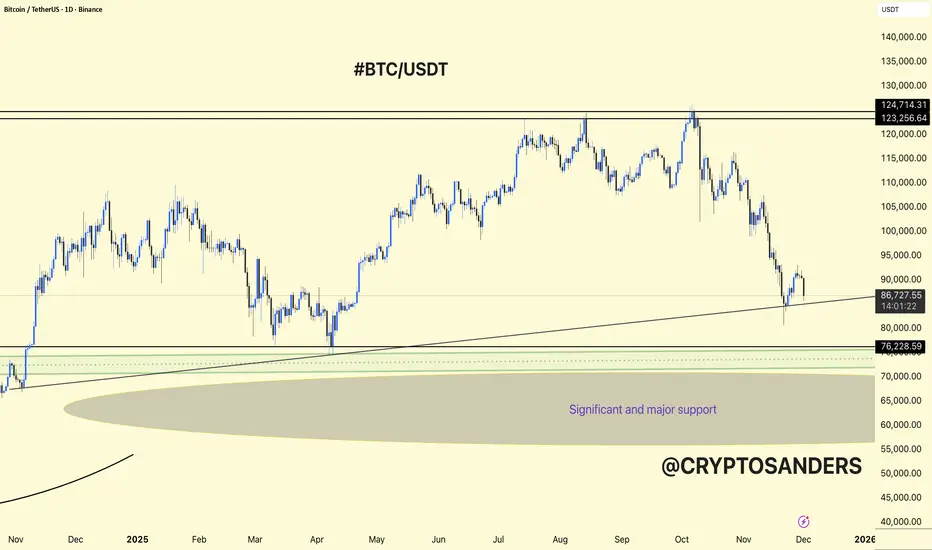
BTC/USDT 1DAY CHART UPDATE. BTCUSDT is in a corrective phase on the 1D chart, but it is still sitting above a major higher-timeframe support zone.
The chart shows a long-term ascending trendline from late 2024 to early 2025 that currently intersects just below the price, acting as dynamic support together with the horizontal 80k–82k area.
Below that, the wider “significant and major support” region lies roughly between 70k and 65k, which is the last strong demand block if 80k breaks.
Bullish case: Holding above the trendline and 80k–82k could form a higher low; from there BTCUSDT can attempt a recovery toward 95k–100k and eventually back to the 120k+ resistance, but it needs clear higher highs and higher lows on the daily to confirm.
Bearish case: A clean daily close below the trendline and 80k support opens room for a deeper flush into the 70k–65k major support zone, where a larger accumulation base may form before any new up‑leg.
DYOR | NFA
BTC: Continue Going LongAfter testing the resistance level of 92K, BTC declined again to build up momentum, waiting for the next upward movement. As I have mentioned multiple times, levels below 90K are suitable buying opportunities, and today we continue to go long on BTC.
BTC Trading Strategy for Today:
BTCUSDT buy@86000-87000
TP:90000-92000
All signals for consecutive long positions have been profitable. I will continue to send accurate signals at the opening of the market every day—don’t miss out.

DeGRAM | BTCUSD will test the $80k level📊 Technical Analysis
● BTC is retesting the multi-month support zone near 80K, aligning with the long-term ascending base and the lower boundary of the falling trend, creating conditions for a medium-term rebound.
● A break above the descending resistance line could trigger recovery toward 92K as the structure shows exhaustion of bearish momentum.
💡 Fundamental Analysis
● Recent ETF inflows and easing macro pressure from U.S. yields support accumulation near major support zones.
✨ Summary
● Bullish bias from 80K support. Targets: 88K → 92K. Key support: 80K.
-------------------
Share your opinion in the comments and support the idea with a like. Thanks for your support!

Gann has the answers! (This is NOT market manipulation) As seen in the Gann tool, price action needs to reposition itself
It resisted at the first curve (Arc1) then moved into the support line (Fan line 1/1)
This is standard behavior, NOT market manipulation

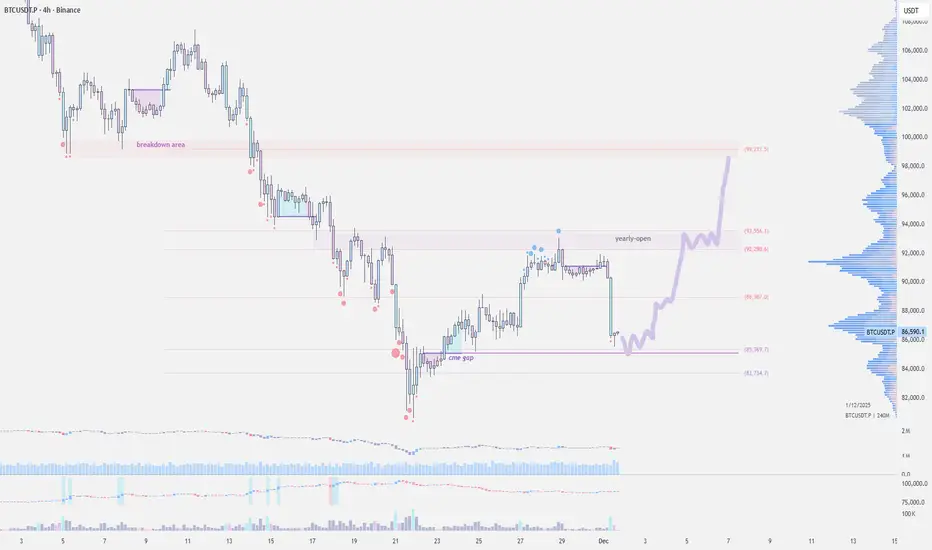
Bitcoin Kicks Off December in the RedCRYPTOCAP:BTC opened the month in red, a strong sell-off slammed BTC from $91.5k to $85k in just three hours.
Bitcoin's recent strength was largely driven by hopes of a December Fed cut, but this move looks more like the market finally cooling off after running overheated for weeks.
Now price is trying to stabilize around the $86k support near the CME gap. There are early signs of a bounce, and if buyers defend the 84–86k zone, a move back toward the 94–95k breakdown area is possible. If that support gives way, expect another dip or continued consolidation.
DeGRAM | BTCUSD will rebound to $92k level📊 Technical Analysis
● BTC/USD formed a false break below the 82K support zone while bouncing off the long-term dynamic support line, signalling seller exhaustion and a potential mid-trend reversal.
● Price is reclaiming structure inside the descending channel; a push toward 90–92K becomes likely if buyers break the local diagonal resistance.
💡 Fundamental Analysis
● Bitcoin sentiment improves as risk appetite stabilizes and institutional inflows show signs of recovery.
✨ Summary
Support: 82K. Targets: 90K → 92K. Medium-term bullish bias while above dynamic support.
-------------------
Share your opinion in the comments and support the idea with a like. Thanks for your support!

BTCUSD NEXT SELL OFF ZONE!!BTCUSD completed +5,000pips from my last post order sell-stop order today price is expected to made a minor pull back at my poc area at 87k and confirmations from my min time frame to sell down to 80k......

BITCOIN MAPPING FOR BEAR MARKETIn this video I will try to map the potential for Bitcoin if we consider the current condition is bear market

Lingrid | BTCUSDT Major Resistance Rejection. Potential Sell BINANCE:BTCUSDT perfectly played out my previous trading idea. Price has broken sharply below the pullback channel after failing to sustain momentum into the 93,000 resistance zone — a heavy confluence of the mid-channel trendline and the broader descending structure. This rejection confirms another lower high, reinforcing the dominant bearish sequence visible since early November. The breakdown signals a shift back into trend continuation mode, with sellers retaking control after a corrective rally.
As long as CRYPTOCAP:BTC trades below 90,000–92,000, the downside path points toward the 81,000 support, where the previous bottom formed and where a potential double-bottom setup may emerge. Momentum remains pressured, and liquidity below the recent swing low increases the probability of a sweep toward 81,000, and possibly deeper into the buying zone.
➡️ Primary scenario: continuation lower → targets 81,100.
⚠️ Risk scenario: a breakout above 93,800 would neutralize the bearish outlook.
If this idea resonates with you or you have your own opinion, traders, hit the comments. I’m excited to read your thoughts!

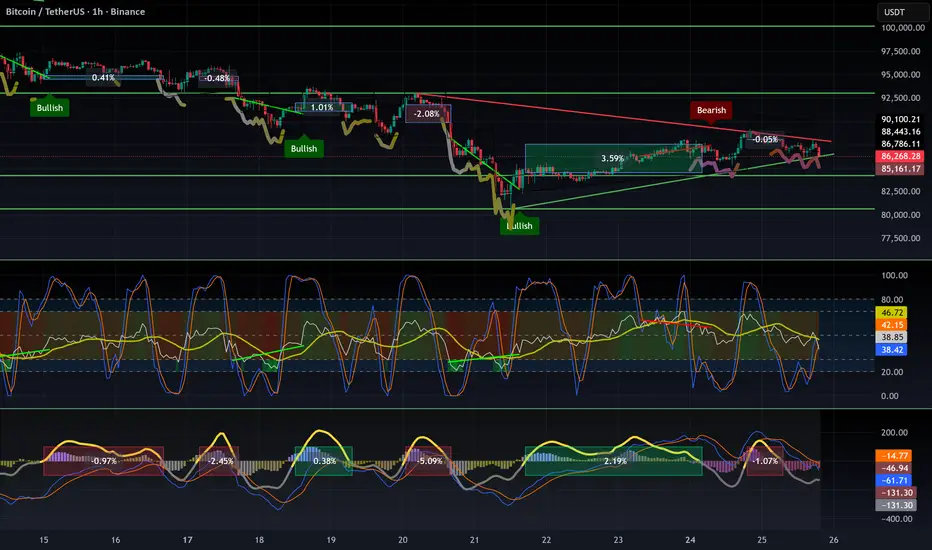
BTC: The Bitcoin bounce is not a trend reversal🚫 The Bitcoin bounce is not a trend reversal
Here’s why the current move looks more like a liquidity trap than a real bullish reversal:
- Momentum is lagging — the rebound isn’t supported by strength.
- Liquidity spikes look engineered to squeeze short positions rather than coming from genuine buyers.
- ETFs are selling while BTC is pumping → classic exit liquidity behaviour.
- We remain in a bearish trend, and the current flag pattern is on the verge of breaking. Statistically, these patterns break down, with targets equal to the size of the previous leg.
- Price is rising while volume is falling → this is a hidden bearish divergence on volume.
🎯 What I’m seeing
It looks like many institutions were caught off guard by the depth of this downtrend, and now they’re trying to reduce exposure.
They appear to be engineering a bounce to attract retail FOMO, allowing them to exit with smaller losses — a classic liquidity extraction move.
As I’ve mentioned several times already:
👉 The primary trend remains bearish until Q2 2026, though we should expect bounces and manipulative moves along the way.
⚠️ My advice
Don’t deploy all your capital into a fake FOMO rally and become the institutions’ exit liquidity.
Wait for a proper bottom confirmation, such as:
A W pattern, followed by a successful retest with a higher low.
❌ Invalidation
This analysis becomes invalid only if the current pattern breaks upward with strong volume.
DYOR
Still no reversal sign on weekly timeframeI expect a sweep of 74k before we see a reversal sign from btc.
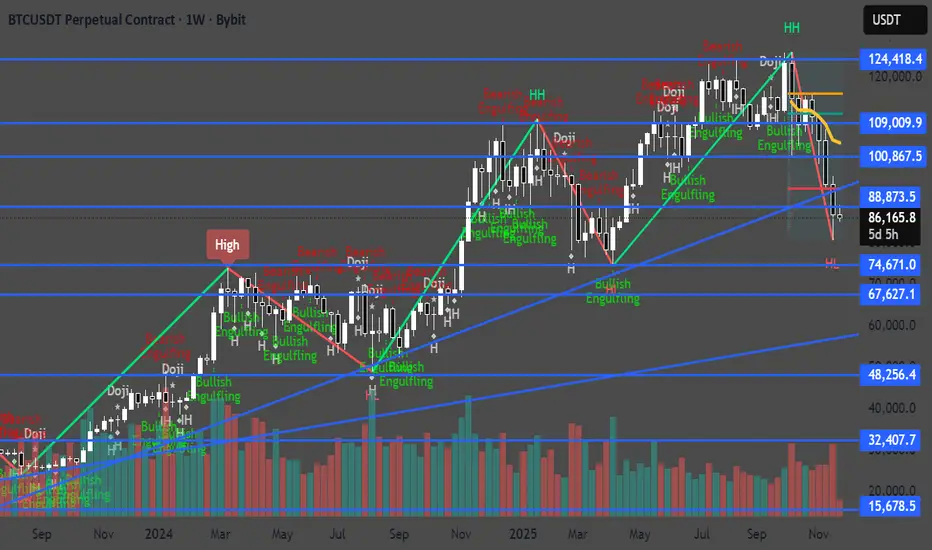
BTC: Bearish Breakdown From ChannelHi!
Bitcoin has broken decisively below the rising channel that has guided price for months, marking a significant shift in market structure. This breakdown aligns with a completed Head & Shoulders pattern, where price failed to hold the right shoulder area and continued lower, confirming bearish momentum.
With the channel support lost and no meaningful bullish reaction on the retest, sellers remain firmly in control. BTC is now heading toward the next major horizontal support around $88,900, which is the key level highlighted in the chart.
Unless buyers reclaim the broken channel support with strong conviction, the path of least resistance remains to the downside.
