BtcBitcoin could experience a short-term decline. It looks like it could return to the $86,000-$85,000 range and reach its highest level.
Market insights

$BTC Ready for Continuation?CRYPTOCAP:BTC on 30-minute chart is making an inverse H&S neckline is around 91,850.
As many of you know, inverse H&S can act like a trend-continuation pattern.
So here’s the question…
If neckline breaks, do you think trend will continue? 📈
Let’s learn together.

Bitcoin recovers rise again moveBitcoin is showing signs of bullish consolidation after a prolonged decline into key support. Based on the current range structure, the market may be preparing for an upward move.
The recovery aligns with broader market sentiment, as U.S. stock indices recorded their fourth consecutive session of gains, driven by expectations of potential Federal Reserve interest-rate cuts.
From a technical perspective, if Bitcoin can hold bullish momentum and secure a 4H candle close above the 90,000 level, it would strengthen the case for continuation to the upside. After the recent long fall, price may look to retest overhead resistance in the 98,000 – 105,000 zone.
You may find more details in the chart.
Trade wisely best of Luck buddies.
Ps; support with like and comments for better analysis thanks for supporting.

btcusdtBitcoin (BTC) Daily Technical Analysis
Current Market Context:
Price action suggests a bearish intraday bias within the broader context. The setup indicates a potential for a short-term decline towards lower support levels.
Trade Setup Overview:
Direction: Short (Bearish)
Strategy: Fade on strength towards resistance / anticipate breakdown.
Execution Parameters:
Entry Point: $91,630
Rationale: This level is anticipated to act as a point of rejection following a retest of a breakdown level or a minor resistance zone.
Stop-Loss: $92,065
Rationale: Placed just above the recent swing high or a key resistance level. A break above this invalidates the bearish premise and suggests a potential move higher.
Take-Profit Target: $90,365
Rationale: This target aligns with a significant support level where profit-taking or a bullish reversal might occur.
Risk Management:
Risk/Reward Ratio: ~1:4.9
This is an excellent risk-to-reward ratio, where the potential profit significantly outweighs the potential loss.
Position Sizing: Ensure the position size is calibrated so that a loss from this trade remains within your predefined risk tolerance (e.g., 1-2% of total capital).
Technical Justification & Chart Analysis:
This setup implies that Bitcoin is facing selling pressure near the $91,630 - $92,065 zone. A rejection from this area, confirmed by bearish price action (e.g., a bearish engulfing pattern, pin bar, or loss of momentum), could trigger a sell-off towards the $90,365 support level.
The trade's validity relies on the market structure remaining bearish on the lower timeframes (e.g., 4-hour or 1-hour charts). The tight stop-loss requires precise execution.
Conclusion:
This is a high-probability, high-R/R short-term bearish setup. The key to success lies in waiting for confirmation at the entry zone rather than entering blindly. Monitor lower timeframes for bearish confirmation signals before executing the trade.
Disclaimer: This analysis is for educational purposes only and does not constitute financial advice. Trading cryptocurrencies carries significant risk.

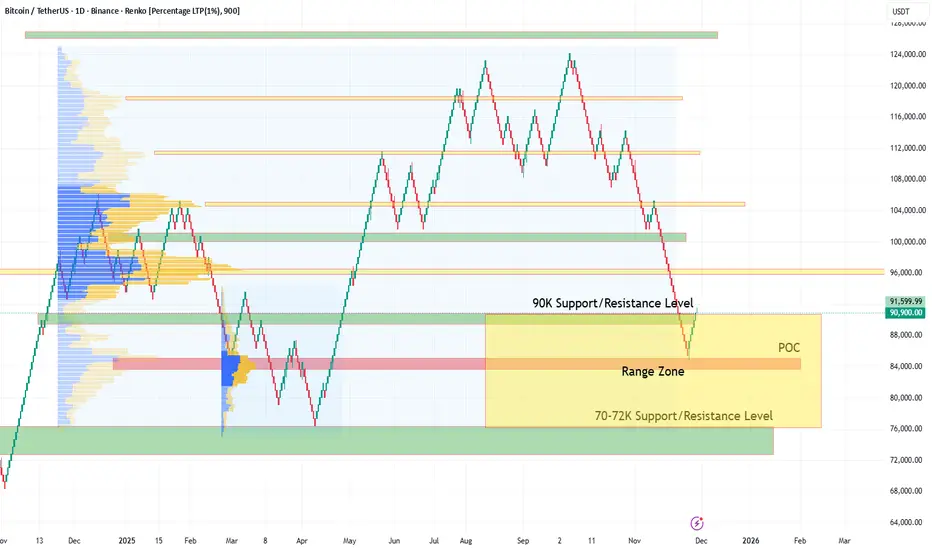
Bitcoin Tests $90K Range High: Binance Netflows Signal PotentialTechnical & On-Chain Outlook:
After losing the $90K support level, Bitcoin has settled into a clear Range Zone between $70,000 and $90,000.
As seen on the technical chart, price action found support near the Point of Control (POC) and is now rallying to test the Range High at $90K.
Binance Netflows: Bearish Divergence Appears
Binance’s 7-day cumulative netflow data highlights a potentially bearish setup:
1. Heavy Asset Inflows (Bearish Signal)
Large amounts of crypto assets have been deposited into Binance:
$2 Billion in BTC
$500M in XRP
$315M in ETH
Such large inflows typically indicate an intention to sell.
2. Weak Stablecoin Buying Power
Stablecoin movements show limited demand:
$1.4B USDT flowed into the exchange
$665M USDC flowed out
➡️ Net stablecoin inflow: ~$735 Million
This represents the actual available buying power on Binance.
Conclusion
A clear supply-demand imbalance is forming:
Potential selling pressure: ~$2.8B (Crypto assets)
Available buying power: ~$0.735B (Stablecoins)
This strongly suggests that short-term investors are preparing to sell at the range ceiling.
Without a renewed wave of stablecoin liquidity, a clean breakout above $90K is unlikely.
A rejection from the range high and continuation within the $70K–$90K range appears to be the more probable scenario.
Bitcoin Analysis – November 28|The Most Important Day of Month!Bitcoin Analysis – November 28
Hello dear traders! Hope you’re all doing well.
Today is November 28, the last active market day of the week — and honestly one of the most important days of the month. Even if bitcoin doesn’t make a big move today, I strongly recommend staying at the charts, because these days often bring unexpected volatility.
The Fear & Greed Index is sitting at 20, which means we’ve moved from Extreme Fear into normal Fear. As you know, the past weeks were dominated by extreme fear.
🟦 Why Today Matters
We’ve seen heavy selling throughout November, but today and the next two days will determine how the monthly candle closes.
Since the major markets will be closed tomorrow and the day after, crypto will likely have lower overall liquidity, meaning today has the highest probability of making the move.
🟧 Market Structure
Daily timeframe: still bearish
1H timeframe: bullish
If today continues upward → 4H may turn bullish as well
Yesterday I explained why this shift can happen — buyers have stepped in with better momentum.
Also note:
After the recent short rally, the market had a time-based correction with very low volume.
A fresh surge in volume today can be a strong signal for continuation.
🟩 Scenario A – Bullish
If 91,636 breaks to the upside:
✅ You can take a long position
• Preferably after a 1-hour candle close above the level
• A 15-minute breakout is acceptable if you see strong volume
• Bitcoin itself is a good option because Bitcoin Dominance is currently supporting the move
-Don’t forget to check the order book on your exchange.”
🟥 Scenario B – Bearish
If 90,786 breaks down:
⚠️ Expect a clean drop
In this case:
→ I recommend shorting BTC pairs that already have a bearish structure
Example: APT, which is currently trending down.
🔑 Final Notes
Always use proper risk management
Avoid unnecessary risky trades
My goal is to keep the analysis as simple and clean as possible
The market rewards traders who show up every day
And to stay in the game every day, you must protect your capital
Have a great day and trade safely! 💙📉📈

Understanding Global Market Meltdowns and CrisesIntroduction
Global markets are the backbone of the world economy, connecting nations, investors, and industries. They are often perceived as resilient and self-correcting, yet history shows they are prone to sudden and severe collapses known as market meltdowns. These meltdowns are characterized by sharp declines in stock prices, bond markets, and commodities, often accompanied by panic selling, liquidity crises, and systemic financial disruptions. Understanding the causes, mechanisms, and impacts of these crises is essential for policymakers, investors, and businesses alike.
Defining Market Meltdowns
A market meltdown, sometimes referred to as a financial crisis, occurs when the prices of assets drop precipitously within a short period. Unlike normal market corrections, which reflect adjustments based on valuations or economic cycles, meltdowns are marked by panic-driven behavior, loss of confidence, and widespread liquidity constraints. They are rarely confined to a single sector, often triggering a chain reaction across global financial systems.
Historically, major meltdowns include the 1929 Great Depression, the 2008 Global Financial Crisis, and the 2020 COVID-19 market crash. Each had unique triggers but shared common dynamics of excessive speculation, over-leverage, and systemic vulnerabilities.
Causes of Global Market Crises
Excessive Leverage and Debt
Financial institutions, corporations, and households often borrow excessively during economic booms. High leverage amplifies gains during expansions but drastically magnifies losses during downturns. For example, the 2008 crisis was primarily driven by over-leveraged banks investing in subprime mortgages. When defaults rose, the interconnectedness of institutions led to a global liquidity crisis.
Speculative Bubbles
A speculative bubble forms when asset prices soar far above their intrinsic value, fueled by irrational investor optimism. Bubbles are often visible in real estate, equities, and commodities. When investor sentiment reverses, the bubble bursts, triggering rapid sell-offs. The 2000 dot-com crash exemplified this phenomenon, where internet-based companies were massively overvalued before the market collapsed.
Banking System Failures
Banks are the lifeblood of modern economies. A failure in the banking sector can quickly escalate into a financial crisis. Bank runs, where depositors rush to withdraw funds, can destabilize the entire financial system. The 1930s Great Depression was exacerbated by widespread bank failures, causing massive unemployment and contraction in economic output.
Macroeconomic Imbalances
Excessive fiscal deficits, high inflation, or persistent trade imbalances can undermine confidence in financial markets. Investors may withdraw capital from affected regions, causing currency depreciation, stock market losses, and economic stagnation. The Asian Financial Crisis of 1997 was partly triggered by high external debt and currency overvaluation in countries like Thailand and Indonesia.
Geopolitical and Global Shocks
Wars, political instability, pandemics, and natural disasters can act as sudden shocks, triggering market panics. For instance, the COVID-19 pandemic in 2020 caused unprecedented global market volatility as governments imposed lockdowns, disrupting supply chains and consumer demand.
Regulatory Failures and Lack of Oversight
Weak regulatory frameworks, insufficient supervision, or financial innovation without proper oversight can allow systemic risks to build unnoticed. The 2008 crisis highlighted the dangers of unregulated derivatives, which magnified losses and spread risks across global financial institutions.
Mechanisms of Market Meltdowns
Liquidity Crunch
During a meltdown, liquidity—the ease with which assets can be bought or sold—evaporates. Investors rush to convert assets into cash, driving prices further down. Banks may restrict lending to preserve liquidity, exacerbating economic contraction.
Contagion Effect
Financial markets are globally interconnected. A crisis in one region can quickly spread internationally through trade, investment flows, and banking linkages. The 2008 crisis, which started with U.S. mortgage-backed securities, rapidly affected Europe, Asia, and emerging markets due to these linkages.
Panic Selling and Herd Behavior
Human psychology plays a significant role. Fear often triggers irrational selling, creating a self-reinforcing downward spiral. Investors abandon long-term strategies, leading to sharp price declines that are disproportionate to actual economic fundamentals.
Credit Freeze
Banks and investors may hoard cash and reduce lending, causing a credit crunch. Businesses struggle to finance operations, leading to layoffs, bankruptcies, and reduced consumer spending, which further depresses economic activity.
Impacts of Market Crises
Economic Recession
Market meltdowns often coincide with broader economic downturns. Declining asset prices reduce wealth, curtail consumption, and disrupt investment, leading to slower economic growth or outright recession.
Unemployment and Social Consequences
Business failures and reduced investment lead to layoffs, increasing unemployment rates. Social unrest and political instability may follow, as seen during the Great Depression and subsequent economic crises.
Loss of Investor Confidence
Crises shake investor confidence, making markets more volatile and risk-averse. Recovery often takes years, as rebuilding trust is slower than stabilizing balance sheets.
Policy Interventions
Governments and central banks typically intervene through fiscal stimulus, interest rate cuts, or quantitative easing. While necessary to restore stability, these measures may increase long-term debt burdens or inflate asset prices, potentially sowing the seeds of future crises.
Global Ripple Effects
In a globalized economy, meltdowns in major financial centers impact trade, investment, and currency markets worldwide. Emerging economies often bear the brunt of capital outflows, currency depreciation, and reduced access to credit.
Lessons and Mitigation Strategies
Diversification and Risk Management
Investors can protect themselves by diversifying portfolios across asset classes, sectors, and geographies. Proper risk management helps absorb shocks during periods of extreme volatility.
Regulatory Oversight and Transparency
Strong regulation, stress testing of financial institutions, and transparency in financial products reduce the likelihood of systemic risks accumulating unnoticed.
Monetary and Fiscal Preparedness
Central banks and governments must maintain tools to stabilize markets, such as liquidity facilities, interest rate adjustments, and targeted fiscal stimulus to cushion economic shocks.
Behavioral Awareness
Understanding the psychological dimensions of markets—herd behavior, panic selling, and over-optimism—can help investors make rational decisions even in turbulent times.
Global Coordination
Given the interconnectedness of modern markets, international cooperation is crucial to prevent contagion and stabilize financial systems. Institutions like the IMF and World Bank play pivotal roles in crisis mitigation.
Conclusion
Global market meltdowns are complex phenomena with roots in economic imbalances, speculative excesses, regulatory lapses, and human psychology. While each crisis has unique characteristics, their recurring nature underscores the need for vigilance, risk management, and systemic safeguards. Understanding the mechanisms, causes, and impacts of these meltdowns is essential for investors, policymakers, and societies to navigate the volatile terrain of global finance.
By learning from history and implementing robust preventive measures, the world can reduce the frequency and severity of market crises, ensuring more stable and resilient financial systems in the future.
Final 2025 Forecast for BTCUSDT 28th November 2025 (Updated)Same idea as previous post, just zoomed in to see the potential gyrations towards to move towards ~$128k and hopefully beyond ✌️
1. Friday session dip to around ~$81k
2. Pump to around ~$87k over the weekend
3. Dump down to ~$80k for Monday Trap
4. Black Friday Pump to ~$89k
5. Max Pain Dump to ~$75k-$79k
6. Final pump to ~$128k to end the cycle
If we are lucky and price pullbacks from ~$128k and then exceeds it. Here are the targets I would be looking at;
Target #1 $140k-$145k,
Target #2 $170k-$175k
Target #3 $200k-$205k
This of course could be 100% wrong so remember (as always) to ruthlessly ✂️ cut your losers when wrong, and hold ✊ onto your winners when right.
--
I might also add, come early December 1st - 5th the following celestial events will take place which support the run up to $128k (and possibly beyond);
1. Super Full Moon (“Cold Moon”) 🌖
• On December 4, 2025, there’s a nearly full moon (~98% illuminated). 
• This will be a supermoon, meaning the Moon appears slightly larger and brighter than average. 
• The Moon is in Taurus, and near the Pleiades (M45) — Taurus is represented no other than the Bull.
Supermoons correlate with:
• spikes in emotion
• increased speculative behavior
• temporary liquidity expansions
• bigger candles (up OR down)
A near-super full moon tends to:
• mark volatility apexes
• precede relief rallies
• create short-term “energy reversals”
2. Moon–Jupiter conjunction (Dec 7) — traditionally expansive 🌖
Jupiter is symbolically linked with:
• expansion
• optimism
• big moves
• risk-on thinking
• growth
• speculation
When the Moon (sentiment) aligns with Jupiter (expansion), it often coincides with:
• higher risk appetite
• FOMO
• bullish short-term flows
In Summary;
1. Moon–Jupiter conjunction (Dec 7) → Expansive, optimistic, risk-on symbolism
2. Super Full Moon (Dec 4) → Volatility peak → Reversal → Upward burst
4 days ago

BTCUSD SELL CONTINUATION TO 80K.....Still very bearish on btc am only changing bias to once price breaks 93,500 for below this zone is a sell entry for me but if price breaks above 93,500 am positioning for buys to 100k for another sell off for still sell....

Bitcoin Update — Big Correction, Clear Levels, and What’s NextBitcoin has been in a strong corrective phase ever since the October ATH. After breaking down from the rising structure, price has been grinding lower and finally tapped into the broader demand zone we’ve been watching for weeks.
The recent bounce shows that buyers are still active, but the larger trend remains in “recovery mode,” not full reversal mode yet.
🔍 Current Structure
BTC has been trending inside a descending channel since the ATH
Lower highs continue to form under the yellow resistance line
Price found support inside the orange mid-range demand box
RSI and MACD on 8H/12H are recovering, hinting at short-term strength
Volume on the selloff has calmed, suggesting the worst of the panic may be over
Overall, this is a classic cool-down phase after a major breakout — nothing structurally unusual.
📈 Key Levels to Watch
Support:
$87k–$90k — current holding zone
$78k–$80k — major range low if things dip lower
Resistance:
$98k — mid-range ceiling
$102k–$105k — the first meaningful resistance cluster
$113k — upper diagonal rejection area
As long as BTC stays above the mid-range support, the structure remains healthy. Reclaiming the yellow diagonal would open the door toward $102k+ again.
⚡ What’s Next?
Bitcoin is stabilizing after a multi-week correction, but it hasn’t yet broken back into bullish momentum. The next major move will likely depend on whether BTC:
breaks above the descending resistance, or
retests deeper support before reversing higher.
Either way, the macro trend remains intact — this is still a structured pullback within a larger bull cycle.
Not financial advice — just chart analysis.
BTC — Trendline Rejection or Breakout? BTC is approaching a key structural decision point, and the next move will determine whether we see continuation upward or a corrective sweep to lower liquidity levels. This idea outlines both scenarios with clear targets and educational structure analysis.
Key Structural Areas
1️⃣ Rising Trendline Support
BTC continues to respect a clean ascending trendline. This line has been a major pivot for the past several days.
Price is currently hovering just above it, and the yellow circle marks the confluence of:
Rising trendline support
A local demand block
Prior liquidity sweep zone
This is the most important area to watch for reaction.
2️⃣ Short-Term Rejection Scenario (White Path)
Before breaking upward, BTC may show short-term downside rejection, targeting:
➡️ Short-Term Target:
$88,180
This level aligns with:
Demand block retest
Trendline kiss
Local inefficiencies needing fill
A rejection into 88,180 would be normal and healthy before a potential bullish continuation.
3️⃣ Bullish Reclaim Scenario
If price taps the rejection zone and reclaims the trendline, upside targets remain:
$95,800 – $96,500 → Half-filled FVG + structural supply
$99,500 – $100,200 → Major FVG + macro resistance zone
These zones are where we expect strong reaction and profit-taking.
4️⃣ Breakdown Scenario
If BTC fails the trendline with a full candle close below, expect:
Breakdown of structure
Full sweep of demand
Deeper correction into mid-range levels
Not my primary bias, but it's critical to acknowledge the possibility.
Summary
BTC is sitting on an important trendline.
A quick rejection into 88,180 could be the liquidity grab needed before upside continuation.
Reclaiming the trendline = bullish continuation toward FVGs.
Breaking below = deeper corrective move.
📘 Disclaimer
This analysis is for educational purposes only. It represents personal opinion and not financial advice. Always do your own research and manage your own risk.

Bitcoin Analysis October 2025Bitcoin faced correction after last flash crash where bitcoin had 10% pullback, and it now has nice rally to the upside. Fixed volume range showed accumulation of buying orders. I expect price to push to the previous high on the left.

Bitcoin prediction Nov 2025Bitcoin prediction Nov 2025, Bitcoin is expected to push to the upside after it broke previous high and came to test previous low and bullish order block and start to move toward previous high (Bullish Extension). This move may break previous all-time high and break record of 2025 All-time high.

btc quick updatehello everyone!
Happy thanksgiving!
Its helpful to zoom out and get a big picture perspective.bitcoin is trading very technically as of right now. It hit the 1.618 prefectly and has since bounced off of the 38% fibonacci level as it retraced the wave 3. The wave 4 characteristics will have us trend sideways for a little while before breaking out. This could present the altcoins with a golden opportunity to gain some massive momentum when the big money realizes btc is going sideways for an extended period of time. This should be the final leg up for btc. If the wave 4 falls below 69k then the bullish count will be invalidated. For now everything seems to be going smoothly. Ethereum is my favorite altcoin as it has so much room to go up according to the chart.
thank you for your time,
Rigo

BTCUSDT: Lower Vectors Cleared, Higher Targets in SightBitcoin has recovered prior vector candle imbalances at the lower levels (marked in green) and is showing signs of strength after retesting the daily open. With cleanups complete below, attention now shifts to the remaining unfilled vectors above (highlighted in purple), ranging from the 6hr to 5min timeframes.
These imbalances act as magnets for price, suggesting a potential path higher toward the $98K–$109K region.
The structure also shows a possible stair-stepping move upward with multiple confluences building around each level. If momentum sustains and liquidity is swept at each leg, we could see these zones get tapped progressively in the coming sessions.

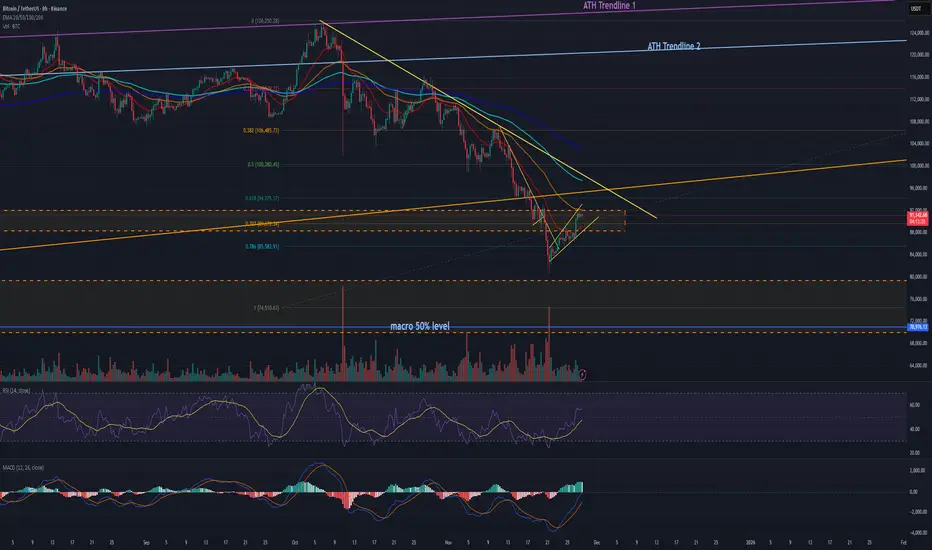
Bitcoin - 66k in 2026 (but first a pump - watch this!)Bitcoin has been going down drastically, as I expected many, many weeks in advance. But this is not the end of the crash! We will see lower prices in 2026, specifically 66k and possibly 50k later in Q3 2026. This is my long-term vision, but in the short term I think Bitcoin should go up to retest the previous long-term trendline and the previous falling wedge pattern at 97k! Usually after a breakout/breakdown, we want to see a retest. These retests are very important because they give us a chance to sell Bitcoin at a better price and also to short Bitcoin on the futures market.
Bitcoin did some pretty crazy movements in the past weeks, regardless of the seasonality patterns. Statistically Bitcoin is extremely strong in October and November—but this time it was the opposite. Even though seasonality patterns are helpful, you always need to look for more indicators and fundamentals. Moonboys that were screaming for 200k and 500k got liquidated, and soon they will disappear from the market for good. I have been trading for almost 10 years, and I have experienced many crypto crashes, and the moonboys are always here at the top. When I was bearish at 120k, everyone was screaming in the comment section and even spitting on my bearish predictions.
So my plan for the next Bitcoin movements is as follows: First, Bitcoin should retest the 97k level (this will take some time). After that we should see another big leg to the downside to 66k.
Write a comment with your altcoin + hit the like button, and I will make an analysis for you in response. Trading is not hard if you have a good coach! This is not a trade setup, as there is no stop-loss or profit target. I share my trades privately. Thank you, and I wish you successful trades!

BTCUSDT.P - November 28, 2025Bitcoin is in a short‑term uptrend, riding a rising trendline after breaking out from prior consolidation and now pressing into a well‑defined resistance band around 92,100–92,600.
The chart outlines a tactical long setup with support around 90,100–90,200 as the key pivot; holding above this zone favors continuation toward the higher resistance/target region near 94,500–95,000, while a clean break back below the trendline would invalidate the bullish structure and open room for a deeper pullback.


sell limit and buy limt. OCODirection: LONG LIMIT
Entry: $91,250
Stop Loss: $90,800 (below structure & liquidity zone)
Take Profit: $91,950
RR Ratio: 1 : 1.55
OR
BUY STOP Entry: $91,650 (after retest confirmation)
Stop Loss: $91,300 (tight invalidation)
Take Profit: $92,400
RR Ratio: 2.14
DELETE Second order if first one is triggered
M15:
Strong bullish breakout from accumulation zone (~$87,000–$89,000).
Sharp expansion → consolidation phase now near $91,400–$91,600.
Potential formation of a bull flag or reaccumulation.
M5:
Tight price compression after a strong rally.
Micro higher lows forming around $91,200–$91,300.
Clear resistance at ~$91,600.
M1:
Repeated rejections from $91,500–$91,600 zone.
Low timeframe equilibrium building.
Minor liquidity sweep below $91,300 followed by recovery.
I DIDNT PLACE THE SELL LIMIT CORRECTLY ON THE CHART. SL AND TP ARE WRONG. FOLLOW DESCRIPTION

Bitcoin - Can the bulls break resistance?Bitcoin continues to stagnate after a strong sell-off. Market structure remains weak, and trading volume is declining as price keeps moving sideways within a tight range. Traders are uncertain about the next move, and both bulls and bears currently lack conviction. Overall sentiment is cool, with most attention focused on nearby resistance zones. Many eyes are on how BTC reacts to the current consolidation area.
4H Bearish FVG
Just above the current price lies a clear bearish 4-hour Fair Value Gap (FVG). This zone now acts as strong resistance. When BTC retests this area, a rejection is the most likely scenario. Only a breakout with strong volume would give bulls something to lean on. As long as this FVG holds, further downside remains the path of least resistance.
1H Timeframe
The 1-hour timeframe shows ongoing consolidation and repeated struggles with the local 1H bearish FVG. Every attempt to break through this area is immediately rejected. As a result, the probability of BTC breaking to the downside increases, which would allow the market to collect the liquidity resting below. Bears are expected to keep defending this zone until the market breaks through with conviction. Consolidation may continue as long as the support level holds, but the underlying downside risk remains significant.
Conclusion
BTC remains technically pressured as long as there is no convincing breakout above the 4H FVG. The current range is vulnerable to a downward break, especially with weak volume and persistent resistance structures. Traders would be wise to wait for clearer signals or a new trend on higher timeframes before committing to a direction.

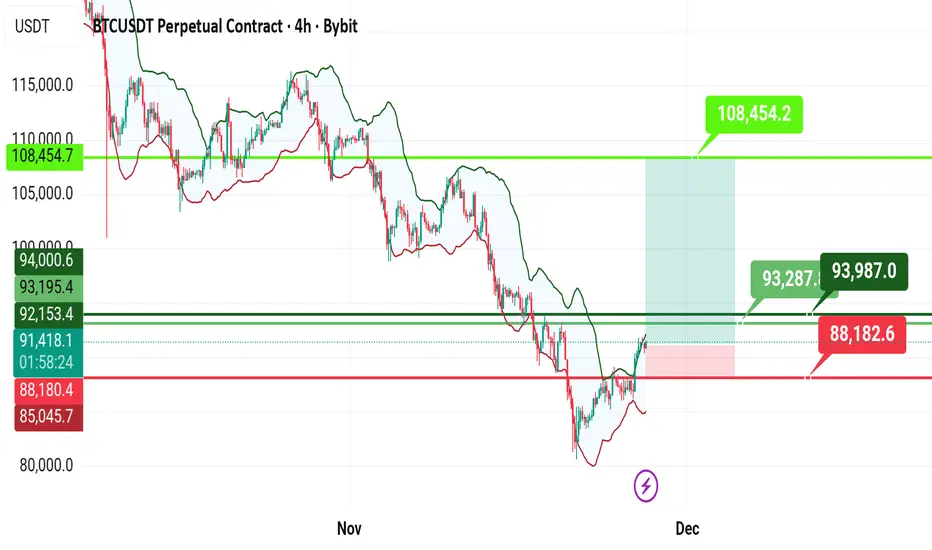
Alert for short positions, 108454 available without stopThere is currently no point of change in the trend in Bitcoin's upward path, and on the other hand, a break above 95,750 completely eliminates the downside trend in the short term, and if there is a reversal, the 94,000 range will provide support.
BTC/USDT Technical Analysis, 2025-11-27 17:00 UTC🚀 BTC/USDT Technical Analysis, 2025-11-27 17:00 UTC
📊 Market Context
Type: Technical outlook / Long setup
Potential Entry Zone: 90,800 – 90,870 (Fibonacci Dip Zone)
Potential Upside Level: 94,140
Defined Invalidation Level: 88,765
Approx. R/R Concept: ~1:1.5
📈 Technical Analysis Overview
🔹 Fibonacci Structure
Price interacting with the Fibonacci Dip Zone (~0.382–0.618 retracement)
Historically, this zone has acted as a reaction area for buyers
Current structure shows strong buyer interest and whale accumulation
🔹 Order Flow & Liquidity Context
Whale buy detected: 842,654 USDT
Higher bid activity relative to recent sessions
Liquidity concentration forming near 90,800–90,870
Order book imbalance indicates buyers dominating
🔹 Momentum Indicators
RSI: 44.6, indicating recovery from oversold conditions
Stochastic: 71.9, approaching neutral, supporting early bullish continuation
MACD: Histogram trending upward, buyers gaining control
Volume: OBV trending upward, confirming sustained buying momentum
📊 Volume & Trend Context
Strong net buy pressure (+100% whale dominance)
Volume spikes near support zone confirm buyer accumulation
Momentum and trend alignment suggest bullish continuation if price holds above entry zone
🎯 Key Market Levels
Immediate Support: 90,000
Major Support / Invalidation: 88,765
Zone of Interest 1: 91,500
Zone of Interest 2 / Target: 94,140
Extended Area (if momentum persists): 95,500
⚡ Structural Notes
Market consolidating near Fibonacci Dip Zone after prior bullish leg
Sellers showing reduced follow-through
Multi-timeframe momentum gradually aligning to upside
📘 Trade Planning Concepts (Analysis Only)
Confirmation above 90,870 may indicate stronger buyer intent
Scaling entries possible in volatile environments
Break-even adjustments recommended after hitting 91,500
Partial profit-taking at predefined targets helps manage volatility
⚠️ Risk Framework
Position sizing must follow personal risk rules
Invalidation set at 88,765
Monitor volume for continuation; weak volume may invalidate the structure
Avoid late entries after breakout without pullback
📱 Checklist for Entry
Fibonacci Dip Zone interaction ✅
Whale buy activity confirmed ✅
Momentum indicators supporting bullish continuation ✅
Volume structure aligned with upward attempt ✅
Risk/Reward favorable ✅
🧭 Timeframe & Method
Approach: Short-term / Scalping
Trade Objective: Capture 3–3.6% upside with controlled risk

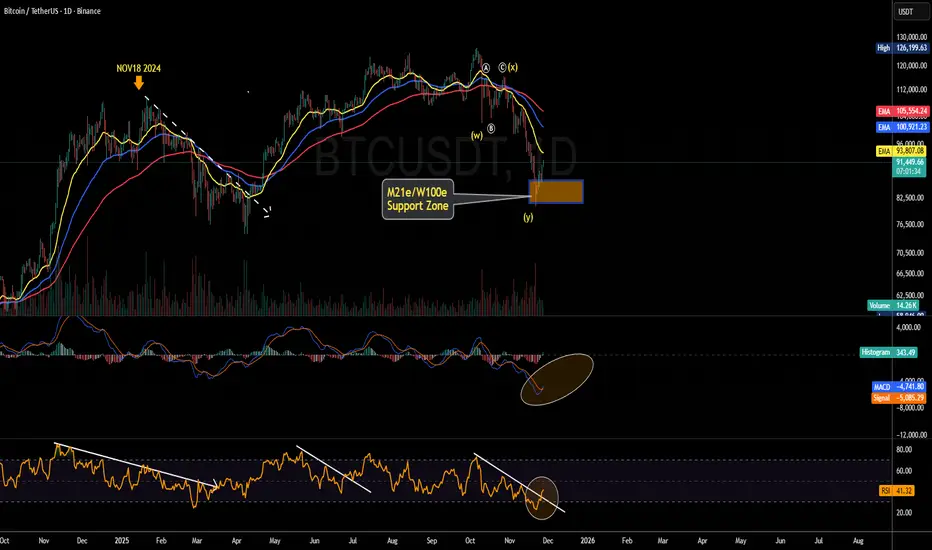
The Path to an Imminent Bitcoin ReversalBitcoin may be establishing a near-term low.
However, for a confirmed reversal signal and to validate a counter-trend rally targeting the 21-week moving average, the market requires bullish confirmation on higher timeframes.
The primary development to monitor is the potential formation of a bullish divergence on the 12-hour and daily charts, characterized by price action forming a double bottom (or even lower lows) pattern coinciding with rising lows on the RSI and MACD indicators.
No significant buying volume yet.