BTC Game PlanBTC Game Plan
📊 Market Sentiment
Overall sentiment remains bullish, supported by expectations of a 0.25% rate cut in the upcoming FOMC meeting. A weakening USD and increasing global risk appetite are creating favorable conditions for further upside in crypto assets.
📈 Technical Analysis
Price is currently retracing lower after printing new all-time highs.
It is moving toward the 112,000$ level, which contains significant liquidity. Therefore, I expect a strong bounce from that zone.
Additionally, price is approaching the equilibrium level (0.5 Fibonacci), which represents a discount for me.
📌 Game Plan
I expect price to retrace to the 111,316$ level and bounce from there.
🎯 Setup Trigger
I will be watching the 4H market structure for confirmation before initiating a position.
📋 Trade Management
Stoploss: 4H swing low confirming the BOS
Targets:
TP1: 118,446$
TP2: 124,351$
💬 Like, follow, and comment if you find this setup valuable!
⚠️ Disclaimer: This content is for informational and educational purposes only and does not constitute financial, investment, or trading advice. Always do your own research before making any financial decisions.
BTCUSDT trade ideas

BULLISH RUN ON BITCOIN 21st Aug, 2025.The bullish trend will start any moment from now and break the 124,407.35 mark.

$BTC to 108k easily....should have bought BTCZ on Friday!I've been trying to warn folks months, weeks, and days ago about this and it's quickly unraveling. History may not repeat itself, but it rhymes and BTC is whistling all the way down the next support level of 108k then 100k, then 70k"ish." BTC correlates with Nasdaq and many companies are not doing well and the economy is doing worse than reported figures. If you're holding, let it go before you are left with worthless digital coins. Every major technical indicator shows weakness and history has not been kind to BTC (major drop to follow after ATH).
Best of luck out there!

BTC/USDT Technical Analysis – Key Levels & Trend Outlook📊 BTC/USDT Technical Analysis – Key Levels & Trend Outlook 🚀📉
🔹 Trend Structure
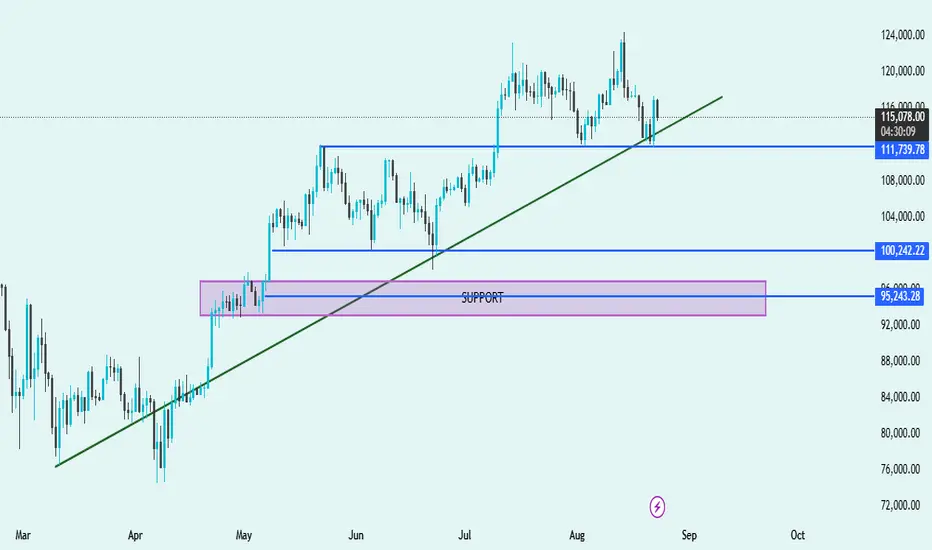
Price is currently trading above the trendline, suggesting bulls are still in control, but momentum has weakened.
🔹 Support Zones
Immediate Support: 🔵 $111,739
Price recently tested this level and bounced, showing demand from buyers.
Key Mid-Support: 🔵 $100,242
Strong historical level where buyers stepped in multiple times.
Major Demand Zone: 🟪 $95,243 – $96,500
Highlighted purple support box; this is a critical accumulation zone where bulls are likely to defend strongly.
🔹 Resistance Levels
Near-term resistance: Around $120,000 – $124,000 (recent swing highs).
A breakout above this zone could fuel a new bullish rally.
🔹 Market Outlook
✅ Bullish Bias as long as price respects the green trendline and stays above $111,739.
⚠️ If the price breaks below $111,739 and the trendline, expect a deeper pullback toward $100,242 or even the major demand zone $95,243.
🚀 A breakout above $120K will signal strong continuation to new highs.
📌 Summary:
Trend: Uptrend ✅
Key Supports: $111,739 → $100,242 → $95,243
Resistance: $120,000 – $124,000
Bias: Bullish above $111K, cautious below 🔻
Bitcoin · $200,000 Confirmed —Ether Hits New All-Time HighThe Bitcoin bears lost the battle; Bitcoin is now set to hit a new all-time high. The bullish bias is confirmed.
This week started bad and red. Red because of lower prices and bad because last week closed as an inverted hammer, perfect bearish signal. This hammer was supported by another rejection just three weeks further back. And so, Bitcoin was looking bearish but not for long.
This same week now has a long lower wick, boom! Prices are recovering strong.
BTCUSDT moved down and tested EMA13 (orange) as support. It moved below EMA8 (red) for a few days and never reached EMA21 (yellow). Bitcoin's current price is trading safely above EMA8 ($115,288).
The week recovered all loses and is now trading almost at the top of the session. This is ultra-bullish and can result in a DragonFly Doji. Bitcoin closing at current price or higher, confirms the bulls are in. Once the bulls are in and confirmed, something we predicted already using the altcoins, we know we will get a higher high next. A higher high needs resistance and that's $137,000 short-term. Mid-term $155,600 and beyond $200,000 long-term.
Thank you for reading.
Namaste.

Bitcoin Short Setup & Long-Term Buy ZonesMy next BTC trade: short from 114,910 with a target of 111,375.8 and stop at 115,902.6.
Setup comes from the 4H order block above FVG in NY session. Expect a pullback here, then a possible next leg up toward 140K.
Also a great SPOT buy level after the short.
Key supports to watch:
110,000–109,000 (critical to hold)
Below that: 99,000–103,000
Final long-term support: 88,000–89,000.
⚠️ This is not financial advice — only my next BTC trade plan.

New moon consolidation period & Camarilla pivots hintsMy choice is to use some very basic indicators as Pivot Points Standard - available in every exchange and TV for free. From the settings menu, just choose - Camarilla Pivots. I prefer to hide 1 and 2 and to use only P - pivot and S5, S4, S3, R3, R4, R5.
My observation. Usually S4 is support and bounce level. R4 - resistance, rejection level. They could be used on any time frame. 3, 5, 15 minute - daily pivots; 30 minutes up to 8 h - Camarilla pivots for the week. D - monthly; W - pivot levels for the year.
BTC reached S4 and still this level gives strong support. Nothing wrong if it goes to S5, but it will mark weakness. And yet, if BTC don't loose it, there is a chance a long term bullish continuation to be held.
There is new moon in Virgo - 23.08. Usually new moon is the start of the new cycle, but the start starts with clearing the “floor“ so to say. Move down ant testing the health of lower levels.
For now, BTC holds not only S4 - Camarilla pivots, but 50% of Asia - 19.08. It already take 50% from the previous red vector candle.
Price projection till the end of the week, based on the factors, indicators and characteristic of the price action, mentioned above.
If BTC loose S4 - S5 109700 has to hold. If BTC continue up to S3 before saturday, it could be more build for the short, rather bullish continuation.
I will not take any action or trade before Monday 25.08.25

BTCUSDBitcoin is currently downtrending on 4H chart. I am watching how price reacts to the HTF resistance zone, which price is currently at. I want to see if the price will keep downtrending on the low-timeframe trend or if it will start to reverse

Wait for break down trend line b4 buyBINANCE:BTCUSDT.P hello guys it's time to buy BTC🫸 wait for double bottom and break down trend line . b4 you buy again Good for Long terms And swing trading Guys📈😊

BTC at the bottom of GTF range🎯 Key Levels to Watch:
• Above: 114150 / 115700 / 116455
• Below: 112300 / 111850 / 110653
🔥 BTC Liquidation Heatmap:
• Above: 114957 / 116098 / 116953
• Below: 112866 / 112201 / 110061
Liquidity pool under 111850 remains major magnet for the price. Will it be wiped out or not, no one knows for sure, but chances are very high. Especially since stocks took a hit yesterday. So either BTC dips and pumps back up fast, or that can turn into full scale correction down to 109k at least.
Developing quarter VWAP and Daily 20sma now form the strongest resistance on the way from 116010 to 116455 (values are approximate).
⏰ TG alarms set for: 111850, 110432, dev Quarter VWAP/VAH & Day 20-sma

Ascending Triangle on Bitcoin Daily Chart.Here’s the breakdown:
Flat Resistance: Around 124,500 USDT (point B & D area) – price struggles to break above this zone.
Rising Support: Each dip (A → C) is forming higher lows, showing that buyers are steadily gaining strength.
What it means:
Bullish Bias: Ascending triangles are generally continuation patterns, meaning the price is more likely to break upward through resistance. If that happens with strong volume, BTC could push to new highs.
Bearish Scenario: If the rising support line fails (around 112,500 USDT), the pattern breaks down and sellers may drag the price toward the broader support near 108,000 or 98,200 USDT.
Key Levels to Watch:
Breakout level: 124,500 USDT Upside target could be projected by the triangle’s height (approx. 12k difference), giving a move toward 136,500 USDT.
Breakdown level: 112,500 USDT. Downside could revisit 108,000 or 98,200 USDT.
In short: Buyers are pressing harder each time, but the real confirmation comes when the price closes above 124,500 or drops below 112,500.

TradeCityPro | Bitcoin Daily Analysis #155👋 Welcome to TradeCity Pro!
Let’s move on to Bitcoin analysis. Bitcoin is still ranging with low volume. Let’s see what could happen to Bitcoin in the coming week.
⏳ 1-Hour Timeframe
Yesterday, Bitcoin rose from its support zone and, by breaking 117837, it managed to hold above this level.
📊 The volume is still very low and will probably remain so until the new weekly candle opens. But if the volume increases, with the break of the 119096 zone we can open a long position.
📈 For long positions, my preference is still on altcoins because Bitcoin dominance is falling and the money flowing into altcoins is more than into Bitcoin.
✔️ If 119096 is broken and dominance continues to fall, altcoins can once again have an upward move and I will open a new position on altcoins.
🔔 On the other hand, if with the start of the new weekly candle the price holds below 116829, it is very likely the market will go into correction and range for the whole week. But if its initial move is bullish and it breaks the 119096 high, a new bullish leg for the market can begin.
❌ Disclaimer ❌
Trading futures is highly risky and dangerous. If you're not an expert, these triggers may not be suitable for you. You should first learn risk and capital management. You can also use the educational content from this channel.
Finally, these triggers reflect my personal opinions on price action, and the market may move completely against this analysis. So, do your own research before opening any position.

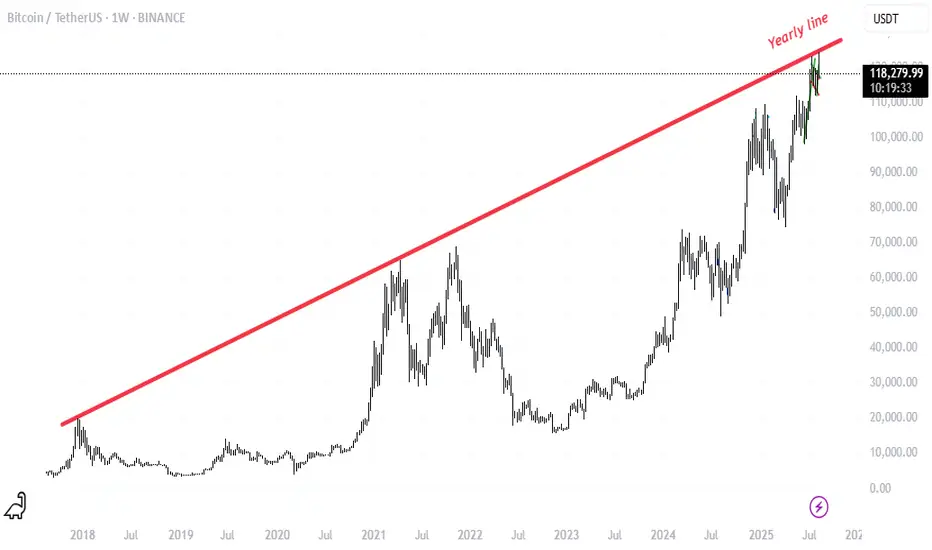
BTC On Weekly chartBased on the weekly trend, it's clear that the price has reached the trend line, and there's a high probability of a price drop or correction
BTC/USDT 4H TIME FRAME OVERVIEWOn Smart ICT Follow-Up and Smart Money Concept
📊 Bitcoin is currently trading between 117,000 – 118,000 on the 4H chart, consolidating near the trendline support and building momentum.
🔑 Key Levels to Watch:
🟢 Support Zone: 116,800 – 117,000 (trendline + liquidity support)
🟡 Immediate Resistance: 118,500 – 119,200
🎯 Upside Targets: 120,500 → 122,000 → 124,000
⚠️ Invalidation: If price breaks below 116,800 with rejection, bullish setup becomes invalid.
🔥 This is a decisive zone — if support holds, BTC has room for a strong swing trade move towards higher liquidity targets. If rejection occurs, expect short-term downside pressure.
🚀 BTC is at a make-or-break structure in this 4H range.
🔔 Disclaimer:
This is not financial advice—just my personal market interpretation. Trade wisely, always consider your own risk tolerance and analysis.

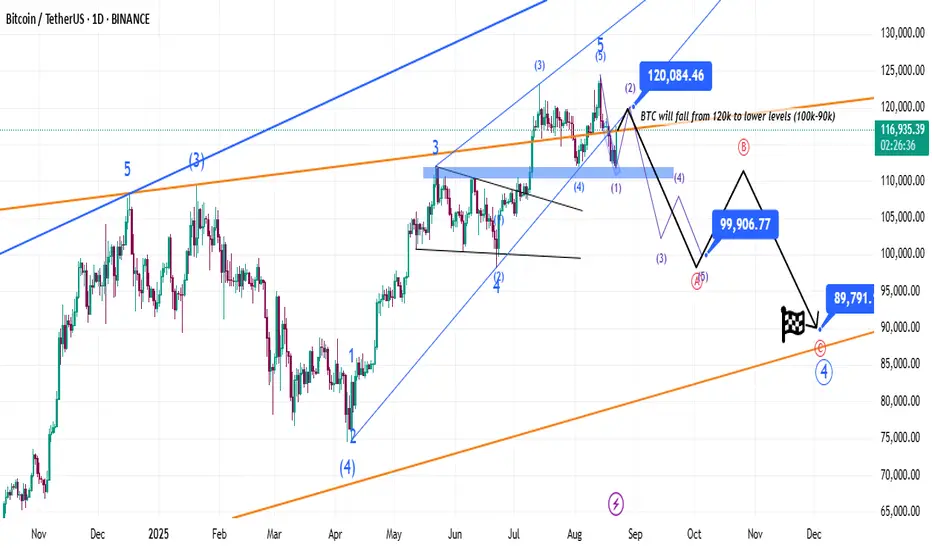
BTC will fall to 100k then 90k , sell nowHello friends, as I predicted in my previous idea, Bitcoin has started its retracement wave and I think it will continue to the range of 119-120 thousand. Bitcoin gave its last chance to exit today before starting its extensive correction. Elliott wave analysis shows that Bitcoin has completed its main wave 3 at the price of $ 124,500 and the price drop from this range to $ 111,500 was actually the first wave of the corrective impulse wave series. I expect the price to rise to the range of $ 120,000-119,000 and this will actually be the second wave and after that Bitcoin will have a big drop to the range of $ 100,000. We will not have a new NATH.
BTC_USDT 4H Possible Scenario Expecting BTC will Rejecte From 120000-121000 Range. Keep Watching market to catch the best trade.
HAPPY TRADING 🥳
Bitcoin (BTC): If We Do Not Hold This Zone - $100K IncomingBTC is at a very crucial zone, where the result of who takes dominance in the current region (buyers or sellers) will determine the overall midterm movement.
Price had reached the $112K zone of liquidity, where we bounced right off as well, giving us a sign of potential BOS to form and then a full-scale bullish movement.
But there is a twist: as we are entering into the weekend markets, we might see some manipulations and we might as well lose the $112K zone to sellers (in that case, we are going to look for another buy area near $100K).
Swallow Academy

Head and Shoulders BTCObvious head and shoulders patter.
Needs to close below neckline for confirmation.
Height of Head to Neckline (price difference) X 2 = Price Target
Remember, Always to set a stop loss :)

Crypto Will PUMP TodayBTC is gonna sweep the sell side liquidity. Sweep would be On london killzone
After that, rally starts. Not even For BTC but for ALL

BTC/USDT Buy-Stop Setup on 4H, Move towards ATHBitcoin has tested a support on 4H and 1D Timeframe. Price has made a HL and now a potential move towards ATH can be seen.
1:2 trade setup is very likely to hit but I have marked 1:1 setup to be on the safe side.
Today is Sunday. Price could hit the target on Monday if not today.
Date: 24-08-25
Day: Sunday

Bitcoin Long good Position📊 Bitcoin Entry
✅ Entry: 112700
❌ Stop Loss: 110500
🎯 Take Profit: 119900
Risk–Reward looks 🔥
This analysis is not a financial recommendation. Crypto is a very risky market and you may lose some or all of your money in it. Especially futures trading.

BTC 4H Analysis| Liquidity Hunt + Bullish Wedge FormingKey Elements of the 4 Hours Chart:
Current Structure :
- Price is moving within a descending channel, potentially forming a bullish wedge.
- Recent wick below support suggests a liquidity sweep before reversal.
Order Blocks (OB):
- Support OBs:
- 112000 → Deepest block, aligned with wedge bottom.
- 113000–112500 → Cluster of mid-level OBs indicating strong buying zones.
- Resistance OBs:
- 114700–122000 → Major supply zone where prior breakdown started.
Liquidity Pools:
- Downside:
- Liquidity resting at 112784 (540.92M) — likely swept recently.
- Upside:
- 116132 (849.26M) and 117372 (1.81B) — attractive for market makers.
These levels align with Fibonacci retracement zones and minor OBs.
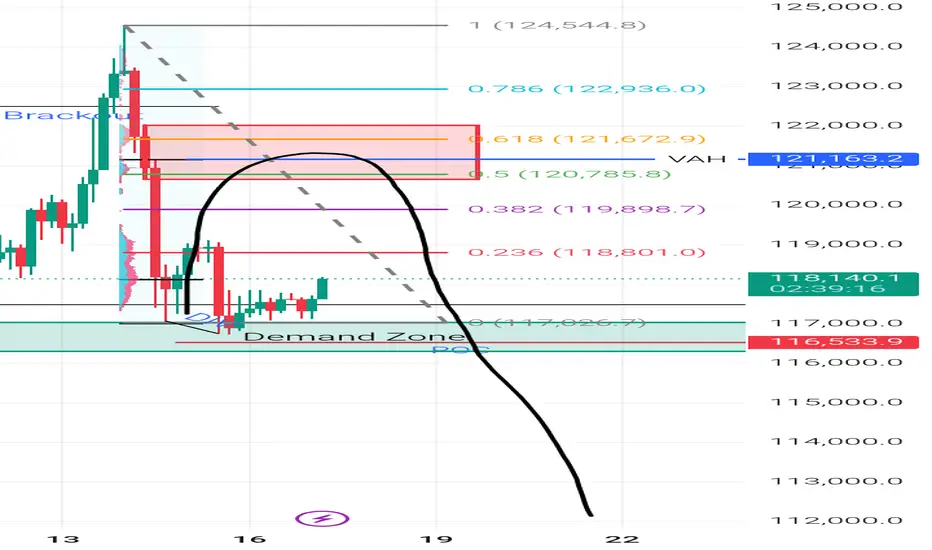
Fibonacci Confluence:
0.5 retracement at 118578.8 — a key level for mean reversion if the bounce continues.
Potential Scenarios:
🟢 Bullish case:
Rejection from wedge bottom + OB at ~112500 → rally to 116132 then possibly sweep 117372 before reacting at major OB (114700–122000).
🔴 Bearish invalidation:
Breakdown from wedge → re-test 112000 OB → deeper drawdown to bullish wedge base around 110000–111000.

Decesion zone for bitcoinAbove our yellow box of liquidity is a bull market. Im forcasting a couple days in that zone maybe 3-10. But thats just based on past price action seen here, though it could be argued we blow past it. as far as bottoms go, i believe we have reached our low for the next couple weeks..
