Bitcoin - Downtrend will continue to 109,000! Alt-season OctoberBitcoin and altcoins have been crashing in the past 2 weeks! Is there any hope for a bull market, or has the bullish cycle ended? In this analysis I will tell you my personal opinion, and if you haven't seen my previous very successful analysis on Bitcoin, you can do it right now! Because it's highl

BTC - Short Setup at 0.702 Fibonacci & Fair Value GapMarket Context
Bitcoin recently rejected from a major resistance area and has since been retracing downward, finding temporary support inside a bullish Fair Value Gap. The market is currently in a corrective phase, with buyers attempting to defend lower levels while sellers look for optimal positio

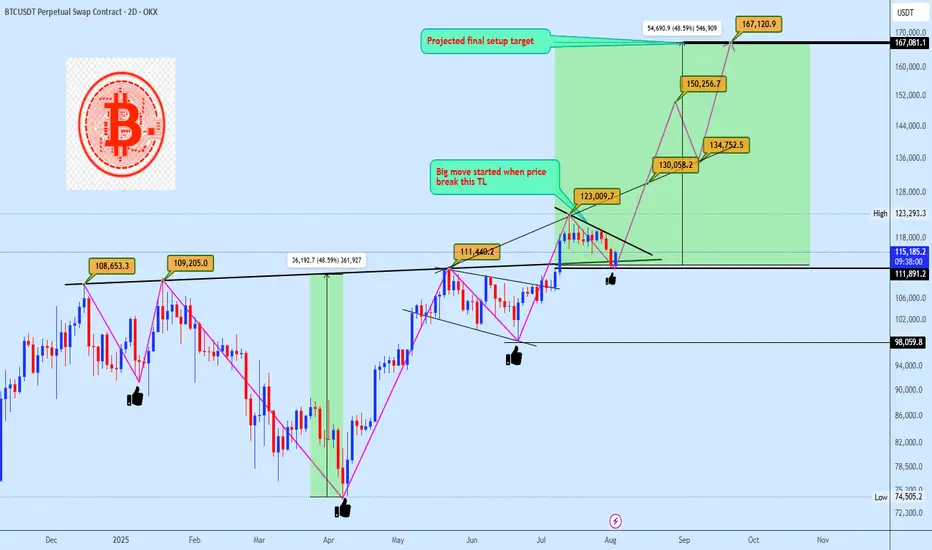
Bitcoin Preparing for Explosive Breakout Toward $167KBitcoin is currently respecting a clean trendline resistance following a bullish pennant formation. Price is holding firmly above the neckline breakout from the inverse head and shoulders (ISHS), confirming demand strength around the $111K–$113K region. The structure implies another 48% rally projec
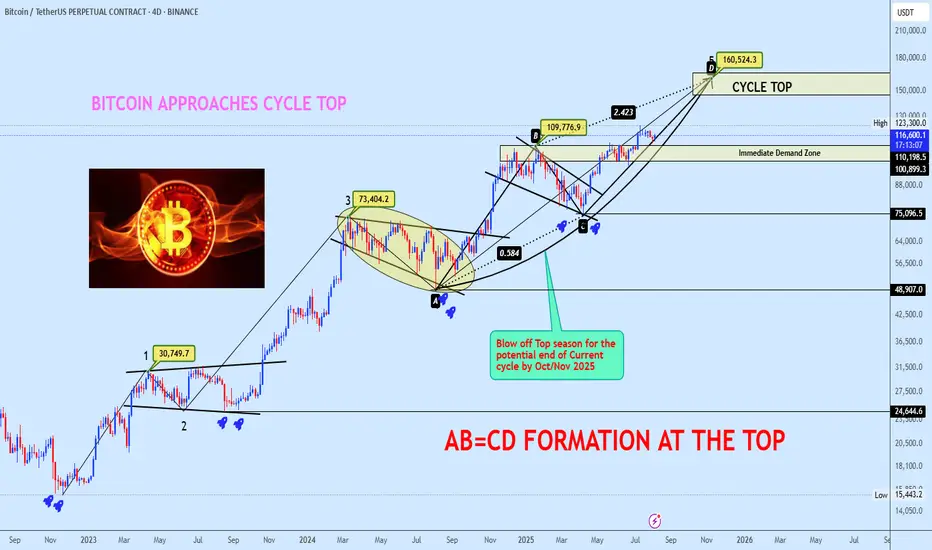
Bitcoin Approaches Cycle Top with AB=CD Completion in SightBTCUSDT continues its bullish macro structure, now advancing towards the projected cycle top zone at $160,524, completing a textbook AB=CD harmonic formation. The BC leg retraced precisely 0.584 of AB, aligning with a 2.423 CD extension, confirming a strong harmonic symmetry.
Price is currently tra
TradeCityPro | Bitcoin Daily Analysis #145👋 Welcome to TradeCity Pro!
Let’s get into Bitcoin analysis. Yesterday, Bitcoin was rejected from the zone I had mentioned, and today it will probably begin its new downward move.
⏳ 4-Hour Timeframe
In yesterday’s analysis, I told you that a pullback to SMA25 and the 0.5 Fibonacci zone was possible

Bitcoin Monthly Update + Top Altcoins Choice, Your PickThis is a monthly Bitcoin chart and is really interesting, it supports without a shadow of doubt a strong continuation and bullish bias.
First, the month started red but is now green. This is always a strong signal when the action starts bad but recovers quickly during the month just to end up good

Bitcoin Update • Resistance Turned Support · TOP Altcoins ChoiceTraders hedge for a Bitcoin drop below $100,000?
Meanwhile, Bitcoin is rising trading above 115K. Resistance turned support.
The last all-time high turned out to work as support this time.
The retrace from 123,000 to 115,000 amounts to a 6.5% decline, which simply means that Bitcoin is trading at
Bitcoin Hits $40,000, It Will Recover —Name Your AltcoinSorry, there is a typo there on the title, I meant to say: Bitcoin hits $114,000, soon to recover.
As you can see from our trading range, Bitcoin just went beyond the lower boundary and hit a new low, the lowest since 10-July but there is good news. There isn't room for prices to move much lower, t

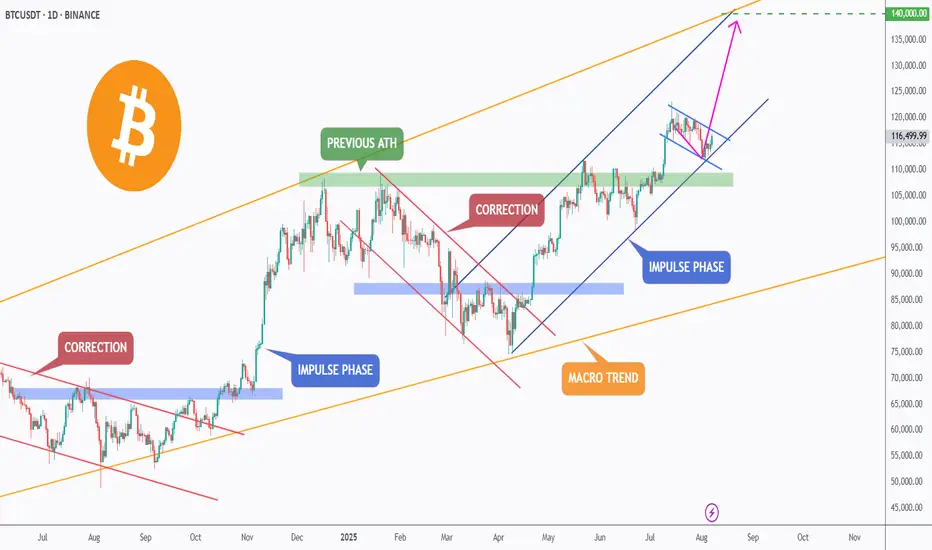
BTC – Breakout Loading?Bitcoin continues to respect its macro bullish trend (🟠), trading within a large ascending channel that has guided price action for over a year.
After breaking above the previous ATH 🟢, BTC entered a correction phase 🔻, retesting the green zone — a key structure now acting as support.
The bulls s
A lose Cycle! Sell The Bottom, Buy The Hype!? Why Do You Buy When Everyone Else Is Terrified?
What drives us to make the exact opposite of a rational decision?
Is a crashing market truly a buying opportunity or just a trap?
Hello✌️
Spend 2 minutes ⏰ reading this educational material.
🎯 Analytical Insight on Bitcoin :
BINANCE:BTCUSDT has

See all ideas
Summarizing what the indicators are suggesting.
Oscillators
Neutral
SellBuy
Strong sellStrong buy
Strong sellSellNeutralBuyStrong buy
Oscillators
Neutral
SellBuy
Strong sellStrong buy
Strong sellSellNeutralBuyStrong buy
Summary
Neutral
SellBuy
Strong sellStrong buy
Strong sellSellNeutralBuyStrong buy
Summary
Neutral
SellBuy
Strong sellStrong buy
Strong sellSellNeutralBuyStrong buy
Summary
Neutral
SellBuy
Strong sellStrong buy
Strong sellSellNeutralBuyStrong buy
Moving Averages
Neutral
SellBuy
Strong sellStrong buy
Strong sellSellNeutralBuyStrong buy
Moving Averages
Neutral
SellBuy
Strong sellStrong buy
Strong sellSellNeutralBuyStrong buy
Displays a symbol's price movements over previous years to identify recurring trends.