BTCUSDT – Ascending Triangle Completing the Path!📊 Bitcoin is currently forming an ascending triangle, clearly marked in bold red.
This zone is showing high volatility and provides great Buy/Sell opportunities for traders. 🔄
📈 If the price breaks out above the resistance line, we can expect a strong bullish move, following the path highlighted in blue polyline, with potential to reach the long-term target of 🔹 1.4 million USDT. 🚀
📌 If you listen closely, this chart’s basically yelling: “Something’s coming...” 🎧👀
🧭 Next move will define the trend — don’t blink.
BTCUST.P trade ideas

BITCOIN TRADING IS 100% PROBABILITY,ANY KEY LEVEL IN THIS CHART CAN FAIL,pls manage your risk and build a strong mindset.
bitcoin is showing a bullish drive. If i retest the 123k level again and gets rejected we are selling down ,the structure has given us a clue on 135k and above possible upswing on sentiment ,this level represents the ascending trendline and a supply roof.
#btc #bitcoin #crypto #eth #sol

Plan $BTC - 08/08/2025Daily timeframe (D)
📍 Price is reacting at the resistance zone.
📌 Triple-top pattern → price has shown a decent recovery, retesting the previous support zone at 117k – 117.5k before reacting.
⚠️ Only consider short positions if the lower timeframes form a clear bearish structure.
✅ Prefer looking for pullbacks to long, as the previous daily candle showed strong buying momentum.
H4 – H1 timeframe
🎯 Long target: 118k (Fibonacci extension 1.618).
📌 Long entry zones:
1️⃣ 116k1xx → H1 base + EMA34 test.
2️⃣ 115k – 115k4xx → Support zone + Fibonacci 0.5 retracement. → Can also long selected altcoins: CRYPTOCAP:XRP , $HEADEL, CRYPTOCAP:AVAX , $APT.

[SeoVereign] BITCOIN BEARISH Outlook – August 10, 2025In the August 10th idea I’m sharing today, I would like to focus on the bearish perspective.
As a swing trader, I am not particularly tied to the major trend, but I believe that this decline is meaningful enough within the short time frame, and I would like to share this perspective with you.
The main bases used in this idea are as follows:
-Harmonic 1.902 Crab Pattern
-Traditional ratio relationships in Elliott Wave Theory (1.618)
-Full Fibonacci 0.618 retracement
Based on this, I have set the average target price at approximately 114,500 USDT.
As time goes by, I plan to add more specific drawings to support this idea so that you can understand it more easily, and if the target price is reached, I will also share the entry price and take-profit price for your reference.
Thank you very much for reading,
and I sincerely wish you an overwhelming amount of strong luck.
Thank you.

weekend buy zone for bitcoinAs volume trails off due to markets being closed leaves room for manipulation. Which is why we tend to stay away from weekend trading unless we have a set in stone game plan as we do now. We take the variables of longs vs shorts, days of the week, and market maker manipulation to strengthen our pvsra volume threshold trading strategy. See where we got this liquidity below, on the 5m timeframe.

A big drop is ahead in the coming weeksBitcoin appears overbought, and in the current global economic climate, cash is king — a dynamic that may prompt investors to lock in profits. I anticipate a pullback to the 0.5 Fibonacci level, which sits around $69,000.

BTC – Still looking heavy below key resistanceDespite a short-term relief bounce after Monday’s drop, BTC remains below the critical 1D MSS + S/R (red box). Structure is weak until this level is reclaimed. Bears remain in control as long as price can’t close above 115.7k.
Plan:
Maintain bearish bias while below the red box — expecting new lows, targeting the green demand/OB cluster around 108.3k.
Flip the red box (close above 115.7k) and the outlook shifts to neutral or bullish.

Btc wants to 124k!Setup is here. Btc.d will be move the price to 124k usdt.
This is not financial advice, DYOR

BTC/USDT – Key Zones to Watch: Liquidity Grab or FVG Reclaim?Bitcoin is approaching a critical decision point after consolidating near recent highs. Price has formed a tight range just below a major Liquidity Zone (marked in blue), while sitting on a strong ascending trendline.
🔹 Liquidity Zone (~$121K): This is a key area where stop hunts and fakeouts often occur. If price pushes into this zone without follow-through, expect a possible reversal.
🔹 FVG + Fibonacci Confluence (~$109K–$110K): This green zone is a key demand area. If price retraces, this could act as a magnet for buyers and potentially offer a high R/R long opportunity.
🔹 Ascending Trendline: So far respected well. A break below it could signal weakness and increase the probability of a revisit to the FVG zone.
Scenarios to Watch:
✅ Breakout above Liquidity Zone → Could trigger continuation toward new highs.
🔁 Rejection from Liquidity Zone + break of trendline → Watch for retrace into FVG zone.
📊 Bias: Neutral short term – waiting for breakout or FVG test.

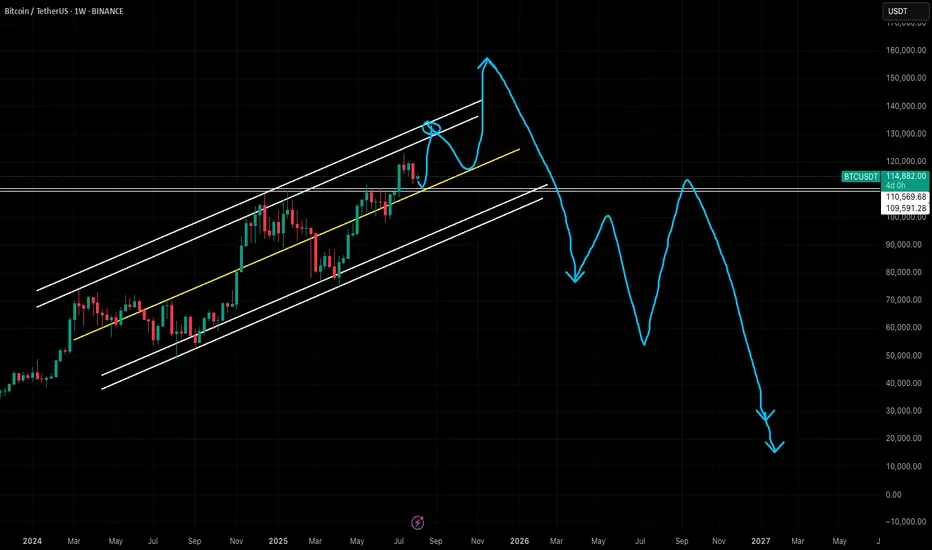
on weekly chart btcusdt long term shortAccording to the weekly chart it would say that btc is near or at the peak and in the next few weeks or months it will start to fall.
As can be seen on the chart, if btc continues to follow the time interval of 202 bars and the fractal structure of the previous period, the next decline should last longer than a year. The lines of resistance in that case would be:
1. green line or about 90k
2. orange line or about 55k
3. red line or about 15k
Disclaimer: This is not financial, investment, trade or other advice. This is my personal opinion which can very easily be wrong.
You trade at your own risk.

Equal highs sweptBTC has just swept the previous daily relative equal highs whilst re balancing a 4 hour fair value gap.
Expecting a pull back to 115,880 💪

BTC/USDT Analysis – Full Trend Reversal
Hello everyone! This is the daily market update from a CryptoRobotics trader-analyst.
Yesterday, Bitcoin broke the local market structure to the upside and tested the previously highlighted zone at $114,500–$114,000 (a mirror volume area). A strong buying reaction followed immediately, pushing the price to a new local high.
At this point, we are witnessing a full shift in market direction toward an uptrend. Seller activity remains weak, so we expect the price to continue rising — at least toward the next selling zone at $117,600–$118,600 (volume accumulation).
Below, a new volume area has formed between $115,800 and $114,900. We are watching closely for buyer activity there. If confirmed, it could serve as a long entry. Without such confirmation, the current breakout could turn into a false move, in which case the market may return to sideways rotation.
Buy zones:
$115,800–$114,900 (volume cluster)
$113,300–$112,700 (local absorption of selling)
$110,000–$107,000 (accumulated volume)
Sell zone:
$117,600–$118,600 (accumulated volume)
This publication is not financial advice.

Bitcoin subida a corto plazoBINANCE:BTCUSDT About to explode, I expect a strong market rise, it's only a matter of time, don't stay out

Bitcoin Analysis As Per Seasonality & PatternBitcoin Analysis As Per Seasonality & Pattern - DYOR
Expecting Top Of Bitcoin Around $150k - $160k By The End Of This Year 2025 and Right After That Bitcoin Can Start Falling After Completing Its Bull Cycle
In Next Bear Market Which I Am Expecting In Year 2026 - Potential Bottom Should Be Below $20k - In Next Bear Market Expecting Bitcoin To Take Longest Correction In History Can Around 90% Drop From Its Top
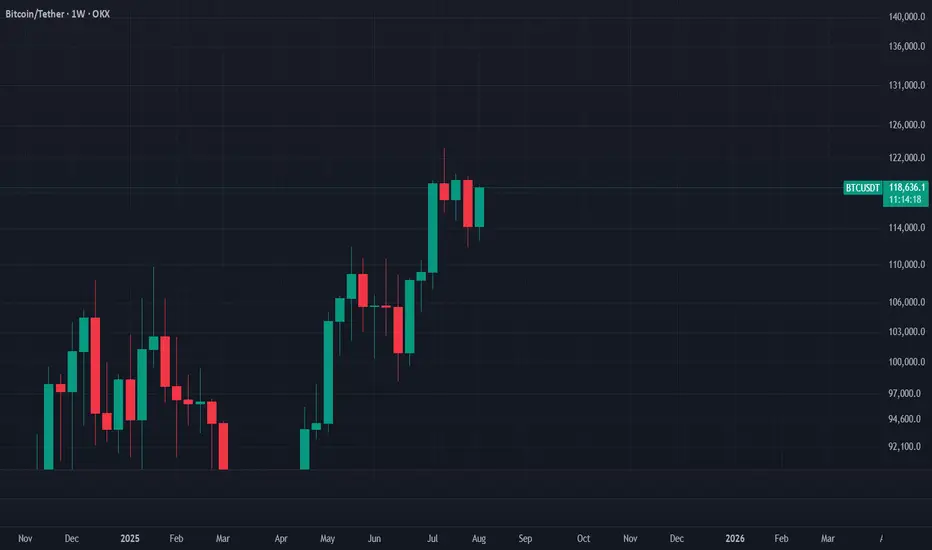
Bitcoin Readies for a $120K Breakout — Watch the Weekly Candle
OKX:BTCUSDT
Summary
If Bitcoin’s weekly candle engulfs the previous one, we can expect an explosive breakout.
Instrument / Timeframe
BTCUSDT, 1W
Scenario
If this week’s candle fully engulfs the prior week, the next week can start decisively bullish and push into fresh highs. For now, we won’t set fixed upside targets; let price discover. Once the market prints a clear resistance at the new peak, we’ll treat that level as Bitcoin’s new ceiling.
Trade Plan (example, not advice)
For long-term buyers who practice sound risk and capital management, a confirmed daily break and close above $120,000 can serve as an entry trigger.
Disclaimer
This is market commentary and reflects my personal opinion. It is not investment advice, a recommendation, or a solicitation to buy or sell any asset. Crypto markets are highly volatile and you can lose part or all of your capital. Always conduct your own research, make independent decisions, and use strict risk management (position sizing, stop-losses, scenario planning). Past performance is not indicative of future results. For guidance tailored to your situation, consult a licensed financial advisor.
#Bitcoin #BTC #BTCUSD #BTCUSDT #Crypto #Breakout #PriceAction #Engulfing #Candlestick #SupportResistance #MarketStructure #Momentum #RiskManagement #PsychologicalLevel #WeeklyClose
Bitcoin Price Outlook 2025–2030 | EMA & MACD SignalsBitcoin trades near $114K in August 2025, sitting just below EMA 9 and EMA 15, while the EMA 200 at $100,870 keeps the long‑term trend bullish. Support at $114K remains crucial, with resistance at $120K–$122K. A close above short‑term EMAs could spark a move toward $127K, while rejection may bring a retest of $110K. Long‑term analysis points toward a potential rise to $300K–$350K by 2030.

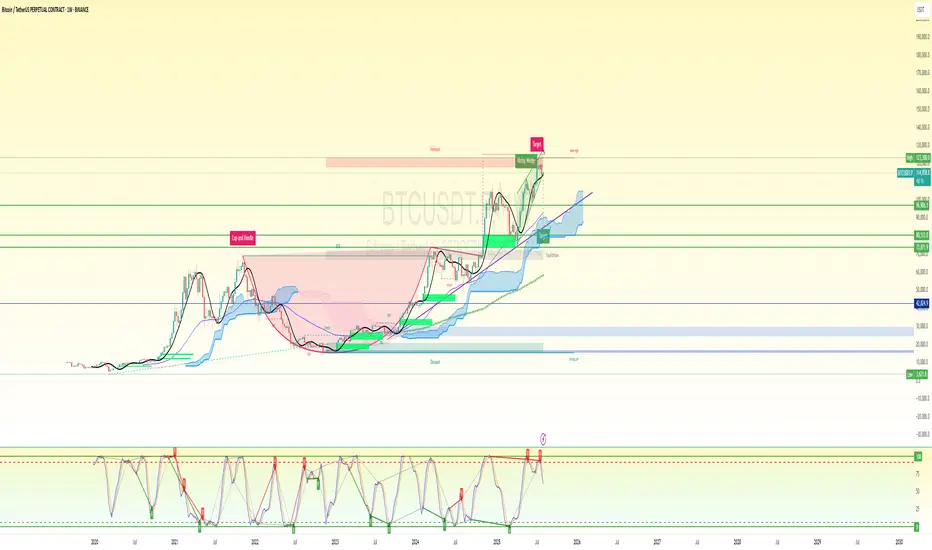
BTC SHORT SET UP (only facts in the chart)📌 Chart Summary
Price: ~$115,000
Pattern: Rising Wedge (Bearish)
Macro Structure: Completed Cup & Handle
Stochastic RSI: Overbought + Bearish cross confirmed
Ichimoku Cloud: Price far above cloud – extended
EMA/MAs: Bullish but overstretched
🧠 Bias-Free Most Probable Setup (Weekly Outlook)
🟥 Bearish Sniper Setup — High Probability
The chart is showing rising wedge exhaustion + Stoch RSI bear cross in extreme overbought = probable correction ahead.
🔽 Short Entry Plan (Sniper Setup)
Entry (Short): $114,200 – $116,000
Ideal sniper zone inside the wedge breakdown area / resistance rejection zone
Stop Loss: $123,000
Above wedge top and key psychological resistance
Take Profit 1 Range: $96,000 – $99,000
Previous major horizontal resistance zone and wedge support retest
Take Profit 2 (final target): $80,500 – $83,000
Major structure zone + Ichimoku cloud top + high-volume node
Risk:Reward: 1:3.5 to 1:5+
📈 Alternate Scenario: Bullish Breakout Setup (Low Probability but noted)
If BTC breaks and closes above $123,000 on weekly, wedge invalidates and opens target:
Breakout Target: $143,000 – $150,000
Based on wedge measured move + Fib extension
⚠️ Additional Confluences Supporting Bearish Bias:
Weekly RSI + Stoch RSI overbought and curling down
Rising wedge near exhaustion
Bearish divergence risk with higher highs in price, lower oscillator momentum
Volume is declining despite price rising – exhaustion signal
🧩 Strategic Notes:
Avoid longing here unless $123K clean break + volume spike
Best play = wait for confirmation of wedge breakdown to enter short
Leverage carefully – this is a macro weekly timeframe setup
BTC Long Setup (Post-Liquidation Reclaim)Hey Candle Fam,
The weak hands just got flushed harder than a memecoin rug—perfect. While retail panicked on the dip, smart money was quietly filling bags near $114k. Now it’s our turn to strike with precision.
🔥 BTC Long Setup (Post-Liquidation Reclaim)
🎯 Entry: $114,390–$113,800
🛡️ Stop Loss: $111,900
💰 Targets: $121k / $130k / $140k
📊 Strategy: Liquidity Grab + Weekly Demand Tap
– HTF bias: Still bullish, above key $115k zone
– LTF confluence: Sweep of lows + CHoCH forming on 12H/1H
– Footprint data: Volume absorption + delta flip confirm buyer interest
⚠️ Caution:
Breakdown below $110k would invalidate this setup and likely trigger a strong bearish leg. This is not a “to the moon” YOLO.
Stick to your system, manage risk, and remove emotion.
🧠 Final Note:
We don’t chase dreams—we execute plans.
All the hours we spend studying this game? It’s not for fun. It’s for freedom.
Financial independence is the goal—this is the craft.
Candle Craft | Signal. Structure. Execution.

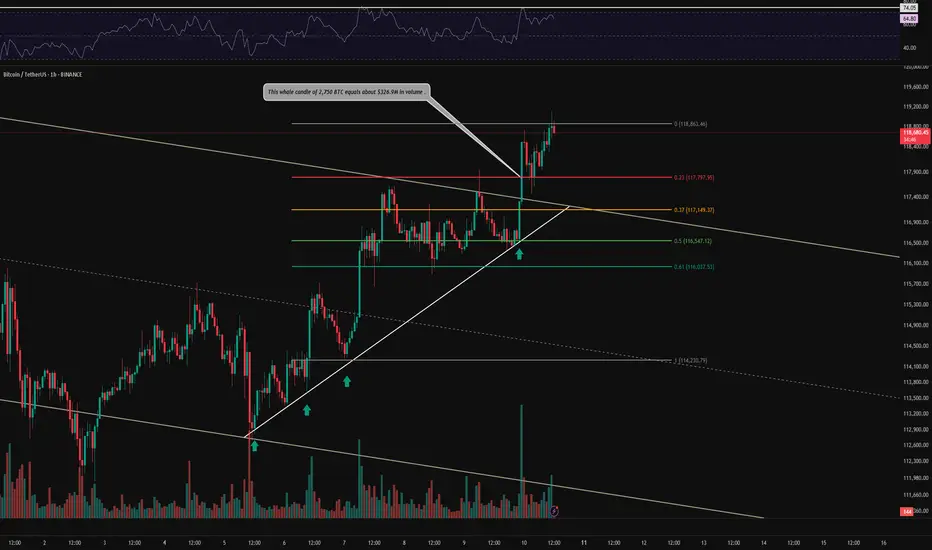
BTC 1H Analysis – Key Triggers Ahead | Day 7💀 Hey , how's it going ? Come over here — Satoshi got something for you !
⏰ We’re analyzing BTC on the 1-hour timeframe .
👀 After breaking out of its descending channel, Bitcoin is moving upward with a high-volume whale candle.
🕯 The trading volume and number of trades are rising sharply, and this volume increase during the New York session could lead to Bitcoin forming a new high.
⚙️ Our key RSI level is 74.05. If this level breaks, the volatility of Bitcoin’s long positions could increase significantly, potentially triggering a price surge.
🎮 After breaking the 0 Fibonacci level and pulling back to it, we can open our positions in line with the market structure change and move with the market.
🔒 An upward-sloping trendline has been drawn from the channel’s bottom to the top, and on the fourth reaction to it, Bitcoin bounced and beautifully broke through the channel’s top.
🔔 There’s no specific alert zone unless the current market structure changes, in which case an alert zone will be provided.
🖥 Summary: Bitcoin is moving upward, our long position trigger has been activated, and if the current structure is maintained, it could continue toward higher price levels.
📊 If USDT.D drops below 4.20% BTC might push toward higher targets .
❤️ Disclaimer : This analysis is purely based on my personal opinion and I only trade if the stated triggers are activated .
BTC 8H – Fib Support Holds, Will Bulls Defend This Reclaim Zone?Bitcoin is back at a key decision point on the 8H chart — retesting the exact zone it broke out from just two weeks ago. This former resistance has flipped to support, but with momentum cooling off, bulls need to step in fast to avoid a deeper retrace.
🔹 Structure & Levels
Price is hovering inside a reclaimed range (blue box), retesting it from above.
Just below sits the Golden Pocket (0.5–0.618) retracement zone from the July rally — a classic bounce zone if the reclaim fails.
The 0.5 level at $110,879 aligns with previous consolidation structure, adding extra confluence.
Further below lies the 0.786 at $103,802, which marks invalidation for most swing long setups.
🔹 Momentum Check
The Stoch RSI has started curling down from overbought, suggesting momentum may stall short term.
If bulls can’t defend the current reclaim zone, we could see a flush into the Fib pocket before trend continuation.
🔹 Bias & Trade Idea
Holding this level = bullish continuation toward $118K–$120K range highs.
Lose it cleanly = watch for signs of reversal inside the golden pocket.
Risk is defined, structure is clear — and BTC has a habit of reacting cleanly to these zones.
Are you buying the dip now — or waiting for a cleaner tag of the Fib levels?
Drop your thoughts 👇

BTC/USDT Analysis – Continued Growth
Hello everyone! This is the daily update from a CryptoRobotics trader-analyst.
Yesterday, Bitcoin tested the local volume area at $115,800–$114,900 and then continued its upward movement, reaching the lower boundary of the strong resistance zone at $117,600–$118,600 (accumulated volume), followed by a pullback.
Currently, the price is hovering around the volume support zone near ~$116,400. Selling pressure is relatively weak and is being absorbed by buyers — which is confirmed by delta data. This makes it reasonable to expect another wave of buying and a deeper test of the resistance zone. After that, we’ll watch closely for the seller’s reaction.
Buy zones:
• ~$116,400 (local volume support)
• $113,300–$112,700 (local absorption of selling)
• $110,000–$107,000 (accumulated volume)
Sell zone:
• $117,600–$118,600 (accumulated volume)
This publication is not financial advice.

Bitcoin Go 140kAfter a strong break of the trend line, it is ready to launch to the targets of 125,000, 132,000, and 142,000. The MACD and RSI also gave a bullish signal.
125000
132000
142000
🤪🤪🤪

BTC/USDT NalysisThis is a full BTC/USDT market analysis including all technical indicators, chart patterns, trend analysis, and strategies for potential long/short entries.
