Bitcoin: Next Move = Drop to $85K (Then Either Moon or Doom)Hey everyone! 👋
How was your trading week? Hope it was green and profitable! 💰
Sharing my current Bitcoin view with you.
In my opinion, the recent rally we’ve seen was either part of an ongoing correction or the final leg of a correction after the previous sharp drop.
Either way, I expect the next meaningful move to be to the downside.
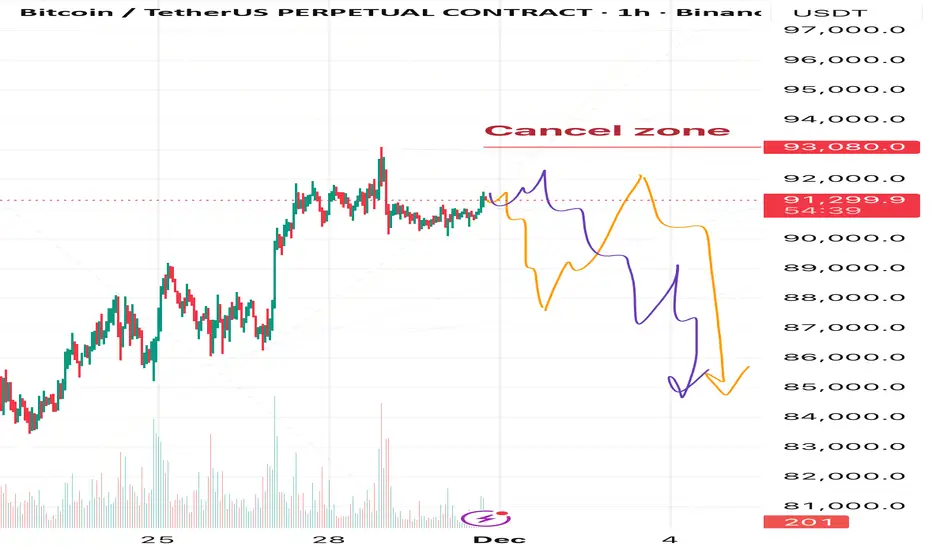
Right now I see two possible scenarios, but both lead to the same outcome in the near term:
→ A decline toward the $85,000 area
🟠either straight from the current price
🟣or after one more push higher toward ~$92,000–$92,500
This coming drop can be interpreted in two ways:
1. As wave B of the ABC correction from the recent crash → after $85K is reached we can expect a strong recovery and new highs above $93K (and likely much higher).
2. If the correction from the crash is already fully complete, then the drop to $85K will mark the start of a new bearish trend continuation.
We’ll watch the internal structure of the upcoming decline — it will give us the clues which of the two bigger pictures is playing out.
❌Invalidation level for the entire bearish scenario: $93,080
Any clear touch and break above this level cancels the idea completely.
Of course, I’ll keep posting fresh updates and chart markups as the price action unfolds, so make sure to hit that
Follow button and turn on notifications — you don’t want to miss the next posts! 🔔
Stay sharp and trade safe, friends! 🚀
See you in the charts! 📊
Trade ideas
BTC(based on NEo wave)this is not a trend-impulse...it is terminal and if it hit the limitation of wave 4 its a natural triangle and its not wave C of a flat.


BTCUSDTWe have a big downtrend.
By breakout from support and resistance we will have continued trend to next target.
Breakout 82k ready to 70k.
Breakout 93k ready to 100k and 115k.
CRYPTOCAP:BTC BITSTAMP:BTCUSD BINANCE:BTCUSDT

BTC/USDT Weekly AnalysisBitcoin is currently in a corrective phase after a strong weekly sell-off.
Price has a clear Weekly Fair Value Gap (FVG) sitting around the previous weekly high in the 95k–97.5k area.
📌 Technical idea:
Price could retrace back into the weekly FVG to rebalance inefficiency and grab liquidity above the previous weekly high.
After tapping that zone, a bearish reaction is expected.
Final target is the previous weekly low, where major liquidity rests.
📍 Key levels:
Weekly FVG zone: 95,000–97,500
Liquidity grab above previous weekly high
Target: previous weekly low around ~75,000
🎯 Bias: Bearish after mitigation

BTC Keep buyingBTC's short-term upside momentum has started to slow down but the overall uptrend remains intact. Stick to the long strategy 100K is our first target
I send accurate signals every day and we've had two straight weeks of profits dont miss out

BTCUSD TO 100K!!!!!!BTCUSD made a breakouts off my internal structure highs yesterday without any valid pull back to the breaker block after my inducement am taking a long buy entry at 92k holding till price sweep liquidity at 100k which will be my next sell zone order

Short term higher, then lowerIt looks like a possible short term move back up, then selling continues.

Next Week sorted before Next WeekAs I analysed earlier, BTC was going to grab 88K, and I did that beautifully. I took another long in that same region and it hit my TP almost immediately. It's just about understanding how liquidity is pooled and how market makers plan to grab them and trade in sync, and not about some buying or selling pressure. No fancy drawings, just pure understanding and some balls of steel. My profits for the week are sorted so I can afford to chill and see what the market is trying to do next.

BTC 88194.99K the point where time bows before structure Carved in Stone: The Point Where Time Bowing to Structure
🏷 BTC
🏷 17.11.2025
🏷 Capital Sector. Local price slice at a moment. System of intelligent anticipation.
🏷 88194.99 — The price is carved. As of publication, the level has not yet been reached.
November 17, 2025 — not a date, but a portal .
Within it, as within an ancient temple, the number is inscribed: 88194.99 . Not approximately. Not “around.”
Carved — without room for interpretation, without space for opinion.
This is not a signal. This is the establishment of reality within the Capital Sector. Here, speculation ends; architecture begins. Lower timeframes fall silent. The crowd remains in shadow. Only those who understand the language of price sectors and anticipatory structures can read what has already been written.
To this core is bound a minimum impulse of 7% — not an option, but a structural imperative. Price does not merely move: it must validate the integrity of the sector. Thus, the range of realization is not shaped by desire, but by inevitability.
International horizons have long been marked: not all may approach the source without being burned.
To outsiders — no entry. Not because it is forbidden, but because it is inaccessible . Reality here is constructed according to rules that are not debated — they are executed.
The point is not an invitation. The point is a test.
— The Architect

Bitcoin – Technical + Fundamental Analysis
📊 Technical Situation
BTC remains inside its bullish ascending channel, with lower boundary still holding well.
Yesterday, price failed to break above the channel’s mid-line / resistance, suggesting consolidation is needed.
A drop toward the lower boundary of the channel could provide good liquidity and a support zone for a bounce.
If that support holds, price could attempt a new upward swing targeting ~94,000 USD, assuming resistance is overcome.
🌐 Fundamental Context
Risk sentiment remains shaky: as traditional markets show volatility, crypto tends to follow — higher Treasury yields and macro pressure have weighed on Bitcoin recently.
On the other hand, medium-term tailwinds remain: growing concerns over global money supply and potential monetary easing support Bitcoin as a hedge against inflation and currency debasement.
Institutional flows remain a mixed factor: while some investors are reducing exposure, others view dips as opportunities — this could generate volatility, but also strong rebounds if sentiment flips.
🎯 What I Expect
Ideally, BTC corrects toward the channel floor before resuming upward — this sets up a buy-the-dip opportunity.
If macro conditions worsen (rising yields, global risk-off), expect pressure toward lower channel support or even deeper.
If support holds and yields/market sentiment improve, Bitcoin could push toward 94,000 USD or higher.

BTCUSD - D11. Completed 5-Wave Decline
The downtrend from the triple-top region completed like this:
(1) bearish impulse
(2) corrective rally into BOS breaker block
(3) extended wave — largest impulse
(4) weak correction respecting trendline
(5) final capitulation into massive liquidity BUY zone (blue)
Your chart correctly marks the final liquidity sweep, which forms the foundation for reversal.
This 5-wave completion is the strongest indication that a trend reversal is starting on D1.
2. Liquidity Grab + ChoCH = Reversal Confirmation
At the bottom:
Price swept deep liquidity under the entire October–November structure.
Then formed a ChoCH (change of character) upward.
This is the D1 first sign of bullish strength.
Smart money accumulated in the blue zone → now initiating the markup phase.
3. Current Price Action – Ascending Structure Forming
Price is building:
A bullish wedge / re-accumulation structure
Multiple higher lows
Price breaking the internal descending trendline
This matches exactly the pattern drawn on your chart.
4. Expected Move (Based on Your Projection)
BTC is likely to follow a two-leg bullish cycle:
🔹 First Target Zone: 100,000 – 102,500 (Supply Zone)
This is the first major D1 supply, created during Wave (4) & internal bearish OB.
Expect:
A reaction
A short-term pullback
Possibly forming a higher low around 95,000–97,000

BTC-USDT
The 2-hour chart has reached its short-term support at 92,800 📌
If this level is broken,
it's likely that the correction could continue down to the psychological support at 90,000 dollars, which is natural after the good growth it had 📉💸
The next upward move will happen when the red resistance is broken, in that case, it could go up to 95,900 🔼✔️

BTCUSD: Onchain data: Good Buy?A. Onchain current landscape:
- MVRV Ratio: Dropped from 1.83 to 1.64
- Well below the 2.0 "heated market" threshold
- Far from the 3.5 "overheated" danger zone
Interpretation: Market is NOT overextended; substantial upside room remains
- Net Unrealized Profit/Loss (NUPL): Declined from 0.45 to 0.39
Entered "Anxiety" zone, trending toward "Fear". Historically, NUPL below 0.40 marks excellent accumulation zones
Signal: Weak hands being shaken out, strong hands accumulating
B. Exchange Flow Dynamics: Smart Money is Accumulating
Critical Pattern Observed:
- Nov 11: -2,579 BTC (outflow - accumulation)
- Nov 12: -659 BTC (outflow - accumulation)
- Nov 13-14: +777 BTC, +5992 BTC (large inflows during panic selling)
- Nov 15-16: Mixed flows, continued selling pressure
- Nov 17: -4,036 BTC massive outflow
Analysis: The -4,036 BTC outflow on Nov 17, as price stabilized around $92k, is the first reversal signal. Smart money accumulated aggressively at depressed prices while retail capitulated.
C. SOPR Analysis: Capitulation in Progress
Spent Output Profit Ratio (SOPR) Timeline:
- Nov 11-12: Above 1.0 (healthy profit-taking)
- Nov 13-17: Below 1.0 (0.989-0.994)
Critical Insight: When SOPR falls below 1.0, it means investors are selling at a loss, a classic capitulation signal. This typically marks local bottoms and excellent entry points for patient buyers.
It means, we need to be patient and accumulate on key supporting levels.
D. Supply Dynamics: Weak Hands Exiting
Supply in Profit: Dropped from 73.6% to 64.5%
35.5% of BTC supply is now underwater (up from 26.4%)
This reset creates a stronger foundation for the next leg up
Investors who bought near the top are capitulating, clearing sell pressure
Whale Accumulation: Follow the Smart Money
BTC whales added ~30,000 BTC during the dip
Value: ~$3 bln in fresh whale accumulation
E. Technical levels:
- Strong supporting zone: 85000-88000.
- Confluence with descending channel's lower bound.
F. The Edge:
While headlines scream "crypto winter" and retail capitulates in fear, seasoned investors recognize this as a gift, a chance to accumulate a scarce, institutional-grade asset at a 26-30% discount from all-time highs, with clear onchain evidence of smart money accumulation.
Analysis by: Dat Tong, Senior Financial Markets Strategist at Exness

Times are changing.Monthly change of color with well below zero selling volume. Haven't seen this in a while.

[SeoVereign] BITCOIN BULLISH Outlook – December 09, 2025As of December 9, I would like to share Bitcoin’s bullish scenario.
Below are the main factors supporting the current rebound.
- Detailed Technical Basis
1) Reaching the completion zone of the 1.902 DEEP CRAB pattern
In the Deep Crab pattern, the 1.618 or 1.902 levels are considered reversal zones,
and when the BC extension and XA ratio converge simultaneously, a strong retracement structure is formed.
This aligns with the typical pattern conditions in which the market attempts a meaningful rebound.
2) Overlap of key Fibonacci 0.618 ~ 0.886 retracement zones
The 0.618 ~ 0.886 levels, which serve as the basis for the mid-term trend, are currently overlapping near the price,
forming a strong buy-side defense zone.
This area has acted as a pivot for directional reversals multiple times in the past,
and it now carries sufficient probabilistic context for a similar reaction to occur again.
3) Detection of initial signals of market structure shift
Even as the price continues to decline, bearish momentum is slowing,
and a classic absorption pattern seen in oversold conditions is appearing in the volume structure.
This is not yet a confirmed reversal signal but can be interpreted as an early movement preparing for a rebound.
- Strategy and Target
Based on these factors, I have set the average target zone for this rebound at 92,450 USDT.
If upward movement unfolds, I will reassess whether to continue holding at that level.
I plan to gradually increase long positions based on the technical conditions described above.
Further updates to position management will follow depending on market movement and indicator changes.
Thank you for reading.

$BTC Top-Down Analysis (Short & Simple)Here’s a quick breakdown of what I’m seeing in $BTC.
Overall, all major timeframes are still bearish including the lower ones. CRYPTOCAP:BTC is currently holding weekly bullish OB zone along with a dynamic trendline support.
Weekly TF: We have one good sign and one bad sign.
Bad sign: Red trendline has already broken, and price is trading below it. (not ideal)
Good sign: There’s another trendline (light black) still acting as support, and confirmations on the weekly timeframe would strengthen this level.
Moving to Daily: Still very low momentum since Oct 10th crash no strong volatility.
On 4H: Structure looks slightly better, but any bullish shift would need a clean breakout above marked red resistance zone. 4H + Daily candle close above it would confirm a trend shift in internal (Daily) and external (4H) structure.
I kept chart simple so it’s easy to understand.
As for the big question: Is 80k the bottom?
Ans: Given that all timeframes are bearish and momentum is weak, calling it a confirmed bottom is premature. Only a strong pump from the current zone can support that idea. Most likely bottom should form somewhere around 80k - 75k.
This analysis is pure price action with multiple confluences (FIB, orderflow, ICT, SMC concepts).
If this analysis helped or you learned something new, please boost this post i appreciate the support!

OUTLOOK 1HR BTCUSD Analysis (6th Dec 2025)This is just a trade idea and not a financial advise
BUY/SELL SCENARIOS:
BUYS:
1) Body candle close above the 91445.2 level.
2) Retest the failed 1HR bearish OB at the 91445.2 level.
3) Create a 1/5M bullish engulfing candle to capitalise on BUYS towards the 95000 level.
SELLS:
1) Retest the 1HR bearish OB at the 90210.6 level.
2) Create a 3/5M bearish CHOCH with a body candle close.
3) Retest the bearish CHOCH level to capitalize on SELLS towards the 85000 level.
Happy trading guys

EcoByG Bitcoin Daily Analysis #2 — Daily BTC Market UpdateWelcome to My Analysis.
Now, let’s break down today’s Bitcoin structure.
This chart now contains far more important signals than before—especially in terms of market structure, supply & demand zones, and the critical role of the 92–93K resistance.
---
Overall Market Position
Bitcoin is currently in a short-term bearish structure, and the origin of that weakness is very clear:
💥 The drop started precisely from the supply zone at 92,200–93,700.
After multiple taps into this zone:
Price failed to break out
Selling volume increased
Now price is moving right below this major supply area.
---
Market Structure
The pattern on the chart is clear:
SFP of the high → consolidation → heavy drop → pullback → second drop → weak rebound
Which means:
A Lower Low (LL) has formed
A Lower High (LH) has formed
Short-term trend → Bearish
We are at the exact stage where if price closes below the red zone, a new LH will be confirmed and the next drop becomes likely.
---
RSI
RSI is showing a bearish cross below its moving average,
indicating that buyer momentum is weak.
---
Final Summary
Short-term structure is bearish
Price is trading below the strong 92–93K resistance
RSI is bearish with weak momentum
Buyers are weak; sellers are regaining control
Therefore:
Turning bullish before a clean breakout above 94,000 is not logical.
The probability of a drop toward 89,700 and 88,600 is higher than the probability of a rally.
⚠️ Risk Alert ⚠️
Futures are not beginner-friendly. These triggers require solid experience.
Before using them, study risk management and practice with the learning content here.
Bitcoin Analysis — Buyer Weakness Appearing !
Fear & Greed Index: 25 — still in Fear.
📰 Market Overview
As expected, Bitcoin broke below the $92,000 level, which I mentioned was highly probable.
Right now, the uptrend is weak, but I don’t believe it’s completely invalidated yet — a confirmed break below $90,500 would seal the deal and flip the structure fully bearish.
On the 4H timeframe, we clearly see strong buyer weakness — both in volume and candle size. That’s exactly why we just printed a large red 4H candle.
🎯 So What Should We Do Now?
🔻 My Current Position
I personally opened a short on STX, and although I haven’t reached a 2R yet,
once I do, I will definitely take profits or even close the entire trade.
Why? Because if sellers don’t step in with strength, BTC can easily continue upward.
📉 Short Trigger
$90,550 is the clean, confirmed trigger for a short entry.
But remember:
Bitcoin is in a downward daily structure — lower highs & lower lows are obvious.
So any early signs of buyer weakness give us opportunities for short positions.
If the next 4H candle fails to reclaim $92,000, the probability of further downside increases significantly.
And even if we don’t drop hard, price may stay range-bound in this zone.
📈 Risky Long Scenario
If the next candle forms a green engulfing and buyers suddenly return,
you can consider a risky long entry above $92,500 — but only if volume supports it.
🧩 About Bitcoin Dominance
BTC Dominance is currently ranging, which makes it hard to predict whether Bitcoin or altcoins will drop harder.
That’s why I picked a coin (STX) that shows clear bearish correlation with Bitcoin.
Since this might be the first leg of a drop, sellers haven’t proven themselves yet —
so if you’re already in a trade, take profits quickly.
✅ Final Notes
Thanks for reading my analysis!
Trade safe, don’t forget risk management, and stay sharp.
Good luck! 🚀📉

BitcoinBitcoin at 150k remains in play. The inverse head and shoulders structure is still valid and price continues to respect the neckline. As long as structure holds, upside continuation remains the higher probability outcome.

BTCUSDT – Bullish Retracement Toward Supply ZoneMarket Structure:
Price has been in a short-term bearish structure, making consecutive lower highs and lower lows. Multiple CHoCH and BOS events confirm active redistribution phases.
Liquidity Zones:
• A large demand zone (highlighted in orange) sits around 90,900 – 91,200, where price recently reacted and swept the weak low liquidity.
• Above current price, a clear supply zone / strong high is marked at 92,300 – 92,500, which is the main upside target.
Recent Price Action:
Price dipped into the demand zone, swept liquidity, and produced a bullish CHoCH, signaling a possible short-term reversal. The blue-circled area marks the initial rejection and shift in character.
Expectations:
If bullish momentum holds:
• Price may form a higher low, push upward, and aim for the mitigation of the supply zone at 92,300 – 92,500.
• This region represents the TARGET and a potential reaction zone for sellers.
Invalidation:
A break below the weak low would indicate continuation of bearish structure and invalidate the upward target.
Bias:
Short-term bullish retracement toward supply, within a broader bearish context.

Bitcoin Next Target: $96,800 (1H Analysis)My model signals an upside move toward $96.8K on the 1H chart.
For free Bitcoin alerts and accurate price updates, hit Follow.
