Wave (I) Completed at 126K — Wave (II) in ProgressBINANCE:BTCUSDT
On the weekly chart, the advance clearly topped at 126K.
Momentum had already begun to fade before the peak, and several indicators confirmed it:
-- RSI : formed a lower high compared to the Wave 3 peak, signaling weakening upside momentum.
-- MACD : showed a noticeable loss of strength during the final push.
-- ADX (+DI/–DI) : reflected declining trend strength as +DI weakened and –DI gained traction.
Price also made a new high without matching momentum - a typical exhaustion pattern often seen near major market peaks.
Together, these weekly signals confirm that 126K marked the completion of Wave (I), and that the current decline represents the early phase of a broader Wave (II) correction.
Trade ideas

BTCUSDT: Trend in 1-H time frameThe color levels are very accurate levels of support and resistance in different time frames.
A strong move requires a correction to major support and we have to wait for their reaction in these areas.
So, Please pay special attention to the three accurate trend, colored levels, and you must know that SETUP is very sensitive.
BEST,
MT

BTCUSDT – Bullish Reversal Setup at Key SupportBitcoin has made a sharp impulsive drop into a key higher-timeframe support zone (highlighted in yellow). This area has previously acted as strong demand, producing a significant bounce on Nov 27.
Price has now tapped back into this zone with a long lower wick, showing early signs of buyer absorption. If the support continues to hold, this area offers a potential long (buy) entry, as marked on the chart.
🔹 Key Points
Support Zone: 86,800 – 87,400
Entry Area: After confirmation within support (marked “ENTER”)
Market Reaction: Strong sell-off into support followed by initial rejection (blue circle)
Bias: Bullish as long as support holds
🎯 Target
Upside continuation toward 90,500 – 92,000 (target zone on chart)
⚠️ Invalidation
A clean break and candle close below the support zone would invalidate the long setup.

BTC(based on NEo wave)this is not a trend-impulse...it is terminal and if it hit the limitation of wave 4 its a natural triangle and its not wave C of a flat.

Bitcoin (BTC): 100 EMA Holds | Entering Into Bear Market SoonBitcoin buyers are not giving away that 100 EMA easily; they hold this zone and as long as we are above that mark, we are looking for one last bullish movement here.
Now if we talk about cycle times and how long each cycle has been lasting, we can assume that we are about to enter the bearish market, but one last push should follow before the dip.
So we are looking for a bearish market to start around Dec-March, as soon as we get that one last pump.
Swallow Academy

#BTC Continues Deepening Correction?📊#BTC Continues Deepening Correction?
🧠From a structural perspective, we are still in a daily-level correction phase, with a short-term downtrend. Therefore, until a bullish structure is established within the same timeframe, we need to be wary of further pullbacks. We can only maintain an optimistic outlook after reversing the blue resistance zone.
➡️Therefore, short-term support is around 85358. If we continue to break below the low L, then we need to pay attention to the next support zone at 69000-74500.
Let's see 👀
🤜If you like my analysis, please like 💖 and share 💬
BITGET:BTCUSDT.P

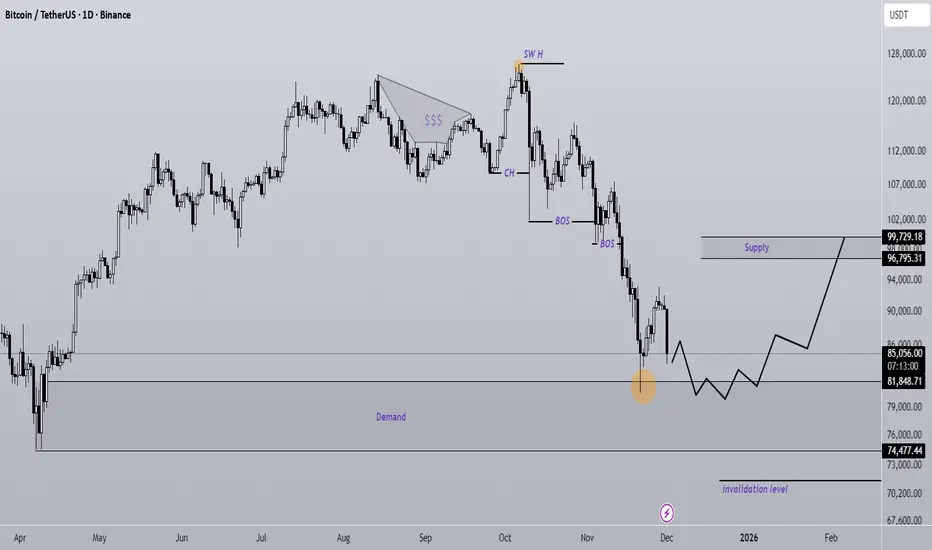
Bitcoin new update (1D)Bitcoin has not yet fully absorbed the buy orders in the marked support zone. This time, upon tapping the support area again, we can expect the price to form a stronger bullish move, at least toward the identified supply zone.
A daily candle closing below the invalidation level will invalidate this outlook.
Do not enter the position without capital management and stop setting
Comment if you have any questions
thank you
BTCUSDT.P - December 1, 2025The chart shows Bitcoin breaking down sharply from a rising wedge‑type structure after failing to sustain prices above the 91,000–91,500 resistance band, confirming short‑term bearish momentum on the 15‑minute timeframe. Immediate support sits around 86,000–85,500 where price is currently reacting, but the highlighted lower zone near 82,000–81,500 represents the next downside target if this local support gives way, aligning with the projected stop level for any counter‑trend long attempt. The higher‑probability play is to wait for either a clear bullish reversal pattern and strong candles off the 85,500–86,000 area to target a corrective bounce back toward 91,000, or a weak consolidation followed by continuation selling into the lower support box to consider fresh shorts with stops above the broken intraday resistance.

TradeCityPro | Bitcoin Daily Analysis #233👋 Welcome to TradeCity Pro!
Let’s dive into today’s Bitcoin analysis. The market is moving upwards today, and yesterday, the long triggers we discussed were activated.
⏳ 1-Hour Timeframe
In yesterday’s analysis, I mentioned that Bitcoin was sitting at its momentum support zone in RSI. I also pointed out that if the RSI was supported at this level, the bullish momentum would be revived in the market.
⭐ This is exactly what happened. With the RSI support, buying volume entered the market, and after breaking the 87,942 level, we had our first long entry trigger.
✔️ The reason for this early entry, as mentioned in yesterday's analysis, was that we had confirmation of momentum from the RSI. This allowed us to enter the position earlier than waiting for the 89,000 level to break.
💥 The second main trigger for Bitcoin was the break of the 89,000 level, which happened with a strong bullish candle. If you didn’t have a stop buy order, you likely missed the chance to open the position.
💡 Currently, after breaking this level, the price has shown some weakness and reacted to the 91,581 zone, with the RSI moving out of the overbought zone.
📊 The volume during the last few green candles was low, and now, with the red candles, the volume is increasing.
⚖️ If the correction continues and becomes deeper, the price might pull back to the 89,000 zone. However, as long as the price remains above 89,000, I believe the short-term market trend will remain bullish, and a deeper downward leg is not expected on higher cycles.
💫 We can use the 89,000 level as a short trigger for the next bearish wave in the market.
🎲 In this case, the main support zones to watch are 86,614 and 82,214.
📈 For long positions, today, if Bitcoin breaks above 91,581, we can open a position. However, there is a very important resistance at the 93,555 level, which is the main trigger for confirming the bullish trend. It’s better to wait until this level is broken before actively pursuing a long position.
❌ Disclaimer ❌
Trading futures is highly risky and dangerous. If you're not an expert, these triggers may not be suitable for you. You should first learn risk and capital management. You can also use the educational content from this channel.
Finally, these triggers reflect my personal opinions on price action, and the market may move completely against this analysis. So, do your own research before opening any position.

BTC Next JourneyBTC must maintain 82,550 $ to survive from worse scenario, details in the attached monthly chart

BTC - Bulls Watching the Channel Support!📈Bitcoin remains overall bullish, trading cleanly inside its rising channel. Each dip toward the lower bound has acted as a strong springboard for the next impulsive move, showing clear demand from buyers.
⚔️As BTC approaches the lower trendline of the channel and the green demand zone, we will be looking for trend-following longs. This confluence area has held multiple times and continues to act as a key decision point for market structure.
🏹As long as BTC remains above this zone , the bullish scenario remains intact, and another push toward higher highs becomes the most likely outcome. Only a break below the demand zone would weaken the bullish outlook.
Now it’s all about the retest… will the bulls defend structure once again? 🤔
⚠️ Disclaimer: This is not financial advice. Always do your own research and manage risk properly.
📚 Stick to your trading plan regarding entries, risk, and management.
Good luck! 🍀
All Strategies Are Good; If Managed Properly!
~Richard Nasr

Correction CompleteBTC should now hit our targets of 65.9k next
Other noteable supports are 59k and 57.1k
and finally, 48.2k (but I don't think this will happen for a few months)

BITCOIN SIGNAL: ONE MORE DUMP BEFORE PUMP??? (warning)Yello Paradisers! Enjoy the video!
And Paradisers! Keep in mind to trade only with a proper professional trading strategy. Wait for confirmations. Play with tactics. This is the only way you can be long-term profitable.
Remember, don’t trade without confirmations. Wait for them before creating a trade. Be disciplined, patient, and emotionally controlled. Only trade the highest probability setups with the greatest risk to reward ratio. This will ensure that you become a long-term profitable professional trader.
Don't be a gambler. Don't try to get rich quick. Make sure that your trading is professionally based on proper strategies and trade tactics.

BTCUSD: Onchain data: Good Buy?A. Onchain current landscape:
- MVRV Ratio: Dropped from 1.83 to 1.64
- Well below the 2.0 "heated market" threshold
- Far from the 3.5 "overheated" danger zone
Interpretation: Market is NOT overextended; substantial upside room remains
- Net Unrealized Profit/Loss (NUPL): Declined from 0.45 to 0.39
Entered "Anxiety" zone, trending toward "Fear". Historically, NUPL below 0.40 marks excellent accumulation zones
Signal: Weak hands being shaken out, strong hands accumulating
B. Exchange Flow Dynamics: Smart Money is Accumulating
Critical Pattern Observed:
- Nov 11: -2,579 BTC (outflow - accumulation)
- Nov 12: -659 BTC (outflow - accumulation)
- Nov 13-14: +777 BTC, +5992 BTC (large inflows during panic selling)
- Nov 15-16: Mixed flows, continued selling pressure
- Nov 17: -4,036 BTC massive outflow
Analysis: The -4,036 BTC outflow on Nov 17, as price stabilized around $92k, is the first reversal signal. Smart money accumulated aggressively at depressed prices while retail capitulated.
C. SOPR Analysis: Capitulation in Progress
Spent Output Profit Ratio (SOPR) Timeline:
- Nov 11-12: Above 1.0 (healthy profit-taking)
- Nov 13-17: Below 1.0 (0.989-0.994)
Critical Insight: When SOPR falls below 1.0, it means investors are selling at a loss, a classic capitulation signal. This typically marks local bottoms and excellent entry points for patient buyers.
It means, we need to be patient and accumulate on key supporting levels.
D. Supply Dynamics: Weak Hands Exiting
Supply in Profit: Dropped from 73.6% to 64.5%
35.5% of BTC supply is now underwater (up from 26.4%)
This reset creates a stronger foundation for the next leg up
Investors who bought near the top are capitulating, clearing sell pressure
Whale Accumulation: Follow the Smart Money
BTC whales added ~30,000 BTC during the dip
Value: ~$3 bln in fresh whale accumulation
E. Technical levels:
- Strong supporting zone: 85000-88000.
- Confluence with descending channel's lower bound.
F. The Edge:
While headlines scream "crypto winter" and retail capitulates in fear, seasoned investors recognize this as a gift, a chance to accumulate a scarce, institutional-grade asset at a 26-30% discount from all-time highs, with clear onchain evidence of smart money accumulation.
Analysis by: Dat Tong, Senior Financial Markets Strategist at Exness

Final 2025 Forecast for BTCUSDT 28th November 2025 (Updated)Same idea as previous post, just zoomed in to see the potential gyrations towards to move towards ~$128k and hopefully beyond ✌️
1. Friday session dip to around ~$81k
2. Pump to around ~$87k over the weekend
3. Dump down to ~$80k for Monday Trap
4. Black Friday Pump to ~$89k
5. Max Pain Dump to ~$75k-$79k
6. Final pump to ~$128k to end the cycle
If we are lucky and price pullbacks from ~$128k and then exceeds it. Here are the targets I would be looking at;
Target #1 $140k-$145k,
Target #2 $170k-$175k
Target #3 $200k-$205k
This of course could be 100% wrong so remember (as always) to ruthlessly ✂️ cut your losers when wrong, and hold ✊ onto your winners when right.
--
I might also add, come early December 1st - 5th the following celestial events will take place which support the run up to $128k (and possibly beyond);
1. Super Full Moon (“Cold Moon”) 🌖
• On December 4, 2025, there’s a nearly full moon (~98% illuminated). 
• This will be a supermoon, meaning the Moon appears slightly larger and brighter than average. 
• The Moon is in Taurus, and near the Pleiades (M45) — Taurus is represented no other than the Bull.
Supermoons correlate with:
• spikes in emotion
• increased speculative behavior
• temporary liquidity expansions
• bigger candles (up OR down)
A near-super full moon tends to:
• mark volatility apexes
• precede relief rallies
• create short-term “energy reversals”
2. Moon–Jupiter conjunction (Dec 7) — traditionally expansive 🌖
Jupiter is symbolically linked with:
• expansion
• optimism
• big moves
• risk-on thinking
• growth
• speculation
When the Moon (sentiment) aligns with Jupiter (expansion), it often coincides with:
• higher risk appetite
• FOMO
• bullish short-term flows
In Summary;
1. Moon–Jupiter conjunction (Dec 7) → Expansive, optimistic, risk-on symbolism
2. Super Full Moon (Dec 4) → Volatility peak → Reversal → Upward burst
4 days ago

BTC: Continue to Wait for an UptrendWe have been continuously signaling to go long on BTC, and all long orders placed below the 90K level have now started to generate profits. Next, we will continue to wait for a breakthrough above the 96K level to capture more profits.
I send out accurate signals every day to help you gain more profits. Don’t miss out!

BTC target is $100KBTC is technically forming a double bottom on the daily timeframe (a trend-reversal pattern). The target sits around 100K. With the upcoming Fed meeting and a potential rate cut, we could break out toward 105K, and I wouldn’t rule out a move to 110K — a test of the 50/200-day MAs — as the market shifts into short-trend expectations.

Back in the stress test area againLooking at the 4-hour chart, the liquidity trend is still too strong. Let’s see if it can stay above 93,200 for the next 3 hours. If it holds, we can buy without hesitation. If not, we’ll sell.

BTCUSDT.P - December 3, 2025Bitcoin is attempting to reverse from a prior downtrend, trading above a short-term rising trendline and pushing into a key resistance band around 93,000–94,300. The chart highlights a bullish scenario targeting the 112,000 area if price can clear this resistance and hold above the stop zone near 97,800. A failure to break and sustain above resistance, coupled with a break below the trendline, would favor a corrective move back toward the 87,300 profit level marked on the chart. Momentum is improving but remains vulnerable around resistance, making this a pivotal area for trend confirmation.

BTC Adam & Eve PatternLooks like on the 12 hour BTC has an Adam & Eve pattern. The height of the arch is the potential downside. So if it plays out, it looks like 74k is possible.

Bitcoin: Final Pump Before the Fall?Over the past five to six days, Bitcoin ( BINANCE:BTCUSDT ) has been attempting to recover from previous weekly declines, and it still appears to be in a corrective phase. This analysis builds on my previous idea, and if you’d like a deeper look at Bitcoin’s mid-term chart, you can check out the 4-hour timeframe in that previous analysis .
Now, a key point for Bitcoin traders is that, despite the recent rally in the S&P 500 ( SP:SPX ) over the past few days, Bitcoin hasn’t been able to keep pace. While it had a good correlation with the S&P 500 in the past, it didn’t experience a similar upward movement this time. Therefore, once the S&P 500 corrects, we may also see Bitcoin resume its downward trend.
Currently, Bitcoin seems to be near a resistance zone($92,200-$88,400) and Cumulative Short Liquidation Leverage($91,570-$89,660). It also appears to be forming an ascending channel over the past few days, indicating a corrective structure.
From an Elliott Wave perspective, Bitcoin seems to be completing microwave C of the microwave Y of the main wave 4, and we can expect this corrective phase to end soon, leading to another downward move. A break of the lower line of the ascending channel would confirm the end of this Wave 4.
I expect that after the Cumulative Short Liquidation Leverage($91,570-$89,660), Bitcoin will resume its decline and move towards the Support zone($86,200-$85,130).
Cumulative Long Liquidation Leverage: $86,000-$85,000
Cumulative Long Liquidation Leverage: $83,249-$81,840
Cumulative Long Liquidation Leverage: $80,263-$78,131
First Target: $86,290
Second Target: $83,800
Stop Loss(SL): $92,229
Points may shift as the market evolves
Note: At lower price levels, Bitcoin’s price includes several Cumulative Short Liquidation Leverages, each potentially causing further price drops. However, if the S&P 500 starts another correction, these levels may break more easily.
Note: Overall, trading in crypto has become a bit challenging lately, with less volatility, so it’s wise to be cautious and manage your capital carefully.
Note: If Bitcoin breaks through the resistance zone($92,200-$88,400) around $92,229, we can expect a renewed upward trend and hope for a bullish movement.
💡 Please respect each other's opinions and express agreement or disagreement politely.
📌Bitcoin Analysis (BTCUSDT), 1-hour time frame.
🛑 Always set a Stop Loss(SL) for every position you open.
✅ This is just my idea; I’d love to see your thoughts too!
🔥 If you find it helpful, please BOOST this post and share it with your friends.

BTC pressure and downtrend continueBTC H4 Chart Analysis
Bitcoin on the H4 timeframe is currently showing a corrective pullback after reaching a key resistance zone around 95,500–96,300, which aligns with the descending trendline, previous supply zone, and EMA confluence (200 EMA + 300 EMA). This rejection indicates strong selling pressure and confirms the zone as a major resistance area.
Key Technical Points:
🔹 Strong Rejection at Major Resistance:
Price reacted sharply from the supply zone and failed to break above the descending structure, signaling sellers are still active.
🔹 Break of Short-Term Bullish Structure:
The recent drop has broken the ascending trendline, showing weakness from buyers and a potential shift back to a bearish correction.
🔹 EMA Dynamic Resistance:
Price remains below the 200 EMA (red) and the long-term moving average (white) — suggesting bulls still lack full control and the broader trend remains under pressure.
🔹 Volume Profile Confirmation:
Most liquidity sits below current price levels, hinting the market may revisit demand zones before attempting another move higher.

BTC/USDT: Bullish Pullback Into Demand ZonePrice is currently pulling back after a strong upward move and is approaching a key intraday demand zone (highlighted in orange). This zone has previously acted as a support base for continuation moves and aligns with the current short-term structure of higher lows.
The circled area represents a potential liquidity sweep / reaction point, where price may wick into the zone before buyers step in. If bullish momentum returns from this level, a continuation toward the marked target area above is likely.
Key Points:
🔸 Trend: Short-term bullish structure still intact.
🔸 Demand Zone: Watching for reaction inside the highlighted support area.
🔸 Bullish Signal: A clean bounce or strong bullish candle from this zone.
🔸 Target: Next upside zone around the 94k–95k range (as indicated on chart).
🔸 Invalidation: Break and close below the lower demand zone would weaken this bullish scenario.
This setup suggests a potential buy-the-dip continuation if support holds and momentum returns.
