General Electric HoldPrices moving inside the channel, the idea is to hold for now:
Option 1 - Go short if the resistance level of 8.00usd will not be broken
Option 2- Go Long if the resistance level of 8.00usd will be broken
GEC trade ideas

GE Divergence StudySince the 70's, GE has closely followed a price structured rise of the S&P 500. However, at the end of 2016 you can clearly see GE stock began selling off, diverging in price over next several years while the S&P continued to climb higher. What has my attention about this chart is how price was once in lock step for 40 years, then winds down inversely to an extent.
So, what now? I'm wondering if GE could be entering another bullish cycle as the S&P appears to be finishing out one. In other words, could these two tickers prices flip and diverge opposite again? Let's look at some details below to help us analyze.
1) Technically, there's massive bullish divergence forming on the daily chart for GE. Inversely, I see massive Bearish divergence on the S&P chart (see my profile for this chart idea).
2) Fundamentally, we've seen several consistent years of bad financial news coming from the conglomerate all the while there's been a concerted effort turn things around within the company (i.e. leadership changes, selling off businesses to pay down debts, layoffs, focusing on Aviation, etc. ). It is just recently that we're now seeing positive signs from the company once again. New contracts, debt reduction efforts, FDA approvals in healthcare, etc.. So, could GE be reaching the end of the negative news cycle?
3) Given that FAANG stocks are grossly over valued and major indices are teetering at nosebleed levels... will traders begin seeking cheaper opportunities/hedges in reputable household names. Specifically, would a conglomerate type such as GE be a good investment if there is market uncertainty or worse, decline in the near future?
Time will tell!
NOTE: Not trading or investment advice. Entertainment only.

$GE General Electric Earnings Targets initial reaction to earnings is positive lets see can that carry through

$GE earning is this upcoming weekWith earnings approaching, I think we will see a sell-off and the stock price will fall back into the channel it has been in since covid hit.


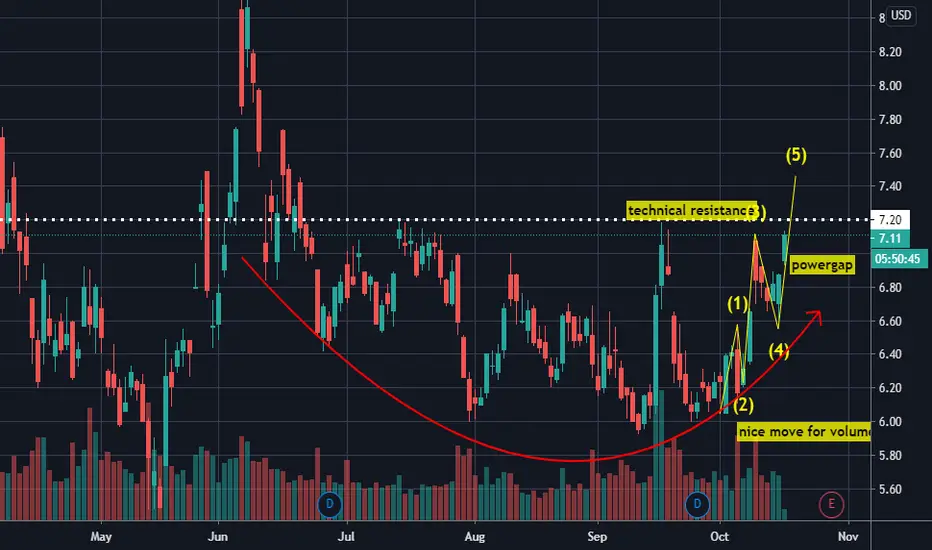
great oversold playi know some of you made big gains, good job! look for a dip around 7-7.2 before any more upside. if the breaks then look for a put or short ! :) gl <3
General Electric 4 hourShort. Looking at prices to hit the 7.94 resistance level then go down to retest the 7.24 on the pullback then go upwards

GE Breakout Trade
Big bull bar breaking through EMA200
GE has recently established higher lows and higher highs

General Electric StockPrices are moving inside the channel the idea is to go long - Target Price might be 8.00 USD

GE price action prediction (NOT FOR TRADING)NYSE:GE This is just a price action prediction for monitoring purpose, will look for a long term entry later.
Hit the like button please if you find this useful :)
This is only my own view and not a financial advice, do your own analysis before buying or selling
Happy Trading!

GE a new horizon?GE just broke out of it's consolidation area ( 5.96 -7.16), looks like it's heading for a minimum target of 8.40$. This chart pattern is the result of a newly announced deal between PIMCO and GE to create a leasing investment platform.


GE - Above the Red CloudsGE is in a great position with room to run. Levels shown as white lines. Company is under strong leadership who was already working on debt reduction and a redistribution of assets. 7.49 first, then 8+, see you there!!


Trendline Break Setup (Paper trade)*Not trading advice, entertainment purposes only, DYOR
Reasons for a trade:
1.) Putting in market structure at or below
78.6, off fibs from 3 most recent highs.
2.) Has W and working on confirmation of larger W
3.) Moving Average Convergence
4.) Put in market structure after break of 2
significant downward sloping trendlines
5.) Divergence in MACD
6.) Market structure and cross on the Willy coming out of oversold
7.) Market Structure on OBV w/MA cross
8.) Bears falling asleep
9.) Beautiful candle body that closed above VP POC
10.) 2:1 RR just above gap at top of most recent range
11.) 6.1:1 RR by a return and touch to 200MA.
12.) 10.2:1 RR by returning to Gann 50%
13.) Near Original breakout out levels from 1992, sheesh
Enter trade at check of top of double bottom $6.30
Set stop just below double bottom at $6.01
Sell 1/2 my position at 2:1 ($6.88) and move remaining to scratch.
use 3 highs/Lows method on remaining if PA continues to put in bullish market structure.
NYSE:GE


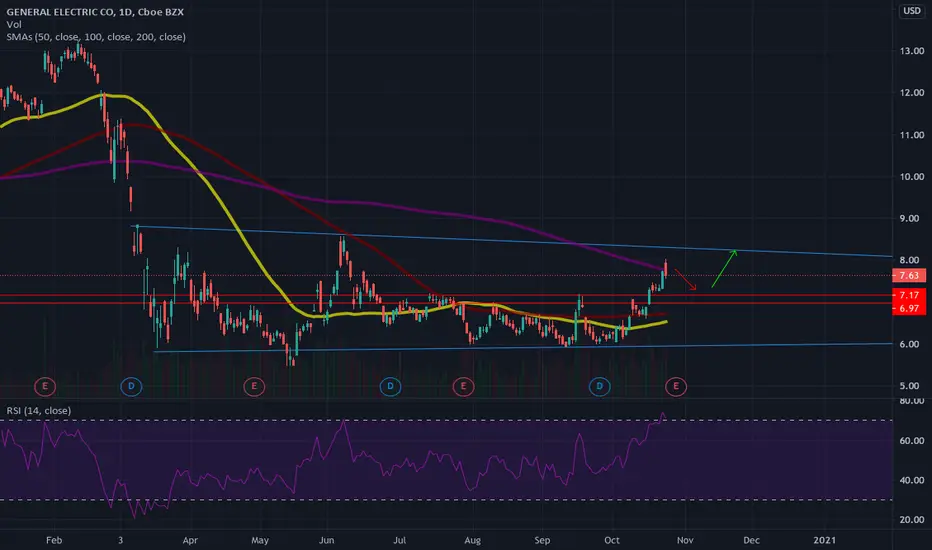
GE Ranging LongGE has been ranging between $6 and $7 for a few months now. In late Sept. we have seen a nice consolidation right at the $6 support. This area seems to be very strong support for GE and provides a good opportunity to go long off it. Bullish price action and bullish divergence on the RSI. Realistically we will see a re-test of the $7 resistance soon.
This is only an idea, and not investment advice. You are responsible for your own trading/investing. Trade according to your own risk tolerance.

$GE - Breakout Incoming$GE
Looks like a breakout coming for the medium term (next 2 mos.).
Good luck to all.
- C
