WDC trade ideas

WDC STOCK CHART
WESTERN DIGITAL CORP. starts to accumulate; a change in trend might be expected on the 16.06.2018
Let´s be patient and wait for a key reversal level then, instead of buying on the bullish pattern now; it is too early and it could still become a bat since there is no sign of divergence.

WDC STOCK CHARTWESTERN DIGITAL CORP. starts to accumulate; a change in trend might be expected on the 16.06.2018
Let´s be patient and wait for a key reversal level then, instead of buying on the bullish pattern now; it is too early and it could still become a bat since there is no sign of divergence.


Western Digital WDC - price in correction waveMACD Oscillating the ZERO line
Possible Bearish tend channel is forming
Momentum & RIS pointing to the down size.
Volume which leads the price is reducing
Quick Sell trade with first target to 76 to close the gap and closest price support level

Long WDC Swing TradeLong position into NASDAQ:WDC today.
RSI shows a lot of strength and MACD has a crossover. Plus: The stock got upgraded today.
I got a little late into this one, but still have a very bullish sentiment with this stock.
Share your opinion, comments and questions. Good Luck!
Risk Level: Moderate.
I will keep updating my position.

WDC Gap to cover Vs the mess to coverKey: Gaps
Possible targets: Boxes
Learn how to beat the market as Professional Trader with an ex-insider!
Next one on June 4th, Book your seat, just 25 available.
Have a Nice Trading Week!
Cream Live Trading, Best Regards!

Western Digital reversal of downtrendWestern Digital will move up off of multiple bottom support after ten weeks of downward movement within a two standard deviation channel. Recent higher than average volume with stochastics and RSI confirmation. Also Barrons news article with bullish fundamental analysis . Shorts will closeout as more long positions are taken.

Western Digital Faded BreakoutAppears the trend breakout is being faded quite hard, expect a retracement and a sharp move down.

Beautiful buy setup on $WDCJust have a little patience and buy the dip. Never ever chase a breakout, always wait for the "good" price. Chasing will result in a loss sooner or later.
This stock is fundamentally on very solid feet and it should hit 115$ pretty soon. I am looking for dips into 90-93$ to build a big position.
We shouldnt see prices below 85$ anymore or else this whole scenario has failed.
Trendlines, flags and whatever dont mean anything if the fundamentals don't line up with them.
Blessings to you all and do your own research.

Monthly FlagI missed the train on that one but that flag sure looks sexy! WDC has been pumping since breakout right in to $100 resistance i would love to see a pullback on this to jump on board with eyes on $120.


$WDC Buying OpportunityI would like to see this stock at $78 and then climb to $90 in the first quarter of 2018
Stops set at $74
Risking 5% to make 15%
See you guys in a couple months for an update.

WDC Bear PutThe recent break of the long term trend at $96 to $78 was the start of the A=B down trend. The retracement to C at $92.17 confirms that the stock is headed to $74 where it will find support at the 1.27 FIB. Short or buy a Bear Put

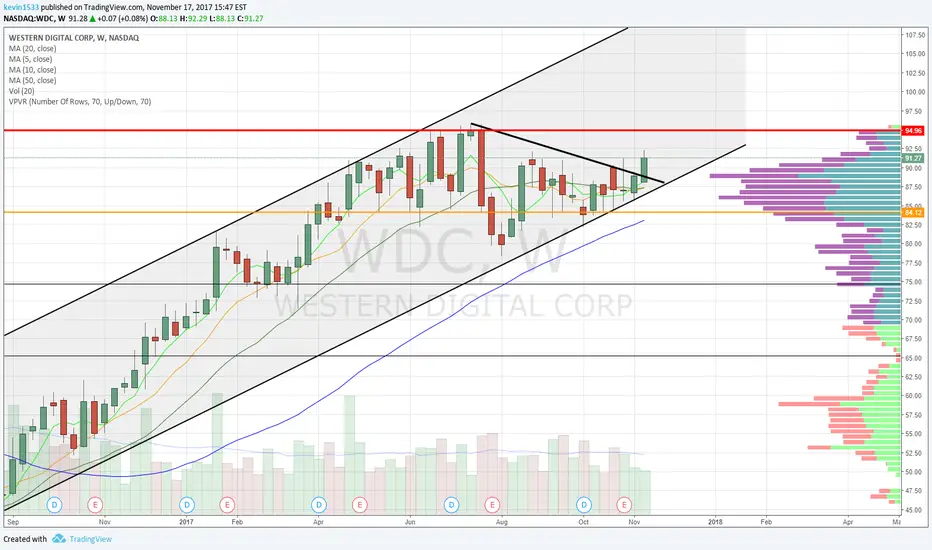


WESTERN DIGITAL - bullish trenThere's a bullish triangle, so we could have another upward impulse pretty soon.

ER Breakout Idea --- Weekly ---ER on Thursday
--Im not a fan of their daily chart at all. So I zoomed out to their weekly chart. Not too sure I would take an entry into this one simply due to the way that their daily is looking
-GMMA shows traders compressing, thus agreeing on price


WDC breaking outNews today about Toshiba preferring a bid from Western Digital over its competitors drove this stock up over 4% midday (from -2.5% to up 1.8%) in a matter of minutes. This price action was sustained throughout the day and the daily candle was able to keep above resistance. This heavy volume, in combination with the downward trend being broken, on the price and RSI, & a cross on the MacD could be the start of a large move upwards.

WDC longmy WDC which i had been worried about announced AH it won the bid on toshiba chip unit. I think this can be the trigger for it to rallye into tripple digits
