CANADIAN DOLLAR / BRITISH POUND
No trades
Trade ideas

GBPCAD Strong Long ConfirmationsWait for a breakout and retest of this H1 TF bull flag and look to the left to identify current structure for TPs.
Overall bias is Bullish.

GBPCAD Trendline Sell IdeaWith the RSI at 64.84, an overbought level, and the current price at the upper trendline. Hence, based on these conditions, I anticipate a sell on the GBPCAD currency pair.

GBP/CAD – Bearish Pressure Building In 3 StepsGBP/CAD – Bearish Pressure Building 🚨
Pair: GBP/CAD
Bias: Bearish
The GBP/CAD pair is showing renewed downside momentum, with sellers regaining control after recent weakness in the British Pound.
🔑 Technical Breakdown
Fibonacci Retracement 📉
Price has broken below key Fibonacci retracement zones, indicating that bulls have lost ground.
Sellers are driving the market toward deeper levels, confirming bearish continuation.
MACD Crossover 🔻
The MACD line has crossed below the signal line, signaling strong downside momentum.
This aligns with the fib breakdown, giving confluence to the bearish bias.
Trend Context 📊
On higher timeframes, GBP/CAD has been trading under heavy resistance.
With CAD showing relative strength, further declines in GBP/CAD are likely.
📌 Trading Plan
Sell Bias: Look for short entries on pullbacks toward broken fib levels.
Targets: Next Fibonacci zones (0.618 → 0.786 retracement area).
Stop Loss: Above the broken fib level or recent swing high.
⚠️ Disclaimer: This analysis is for educational purposes only. Use a simulation account first to practice execution. Always apply risk management and a clear profit-taking strategy before trading with real capital.

GBP/CAD BEARISH BIAS RIGHT NOW| SHORT
GBP/CAD SIGNAL
Trade Direction: short
Entry Level: 1.867
Target Level: 1.854
Stop Loss: 1.875
RISK PROFILE
Risk level: medium
Suggested risk: 1%
Timeframe: 8h
Disclosure: I am part of Trade Nation's Influencer program and receive a monthly fee for using their TradingView charts in my analysis.
✅LIKE AND COMMENT MY IDEAS✅


GBP_CAD BEARISH BIAS|SHORT|
✅GBP_CAD has hit a key
Structure level of 1.8740
Which implies a high
Likelihood of a move down
As some market participants
Will be taking profit from
Their long positions
While others will find this
Price level to be good for selling
So as usual we will have a
Chance to ride the wave
Of a bearish correction
SHORT🔥
✅Like and subscribe to never miss a new idea!✅

GBP-CAD Short From Resistance! Sell!
Hello,Traders!
GBP-CAD shot up sharply
And hit a horizontal resistance
Of 1.8740 from where the pair
Is already making a local
Pullback and we will be
Expecting a further bearish
Move down on Monday
Buy!
Comment and subscribe to help us grow!
Check out other forecasts below too!
Disclosure: I am part of Trade Nation's Influencer program and receive a monthly fee for using their TradingView charts in my analysis.

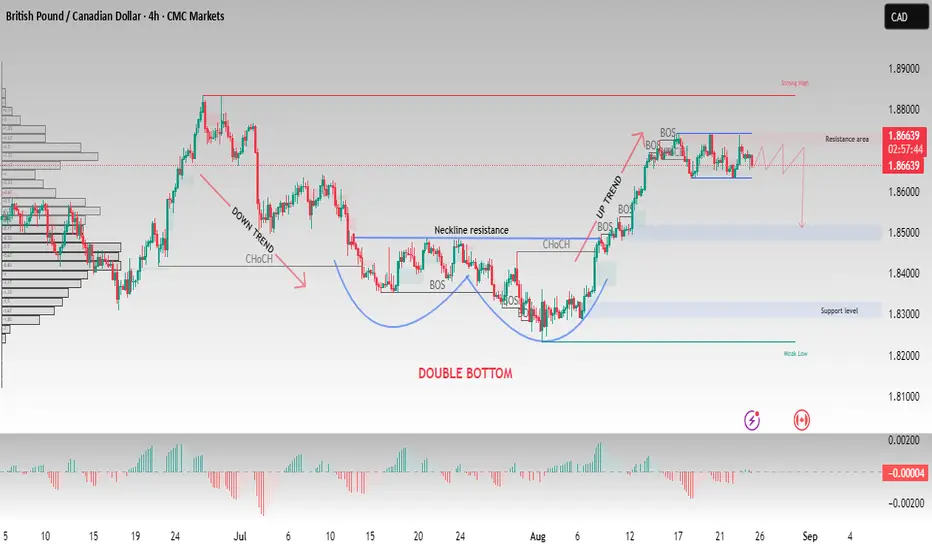
GBP/CAD – Double Bottom Formation & Key Resistance Retest On the GBP/CAD 4H timeframe, the market has completed a double bottom reversal pattern, confirming a bullish structure shift after the previous downtrend. The neckline breakout has led to an upward trend with multiple Break of Structure (BOS) signals.
At the moment, price is consolidating near the resistance area around 1.8700–1.8750. A rejection from this zone could trigger a pullback toward the 1.8500 demand zone.
Pattern: Double Bottom
Resistance Area: 1.8700 – 1.8750 (Strong High)
Support Zone: 1.8500
Key Level to Watch: 1.8300 (major support)
If resistance holds, expect a short-term pullback toward 1.8500.
If price breaks above 1.8750 with momentum, bullish continuation may follow.
This area is critical for the next directional move.
This is an educational analysis, not financial advice. Always manage your risk before entering any trade
GBPCAD Will Go Up! Long!
Please, check our technical outlook for GBPCAD.
Time Frame: 1D
Current Trend: Bullish
Sentiment: Oversold (based on 7-period RSI)
Forecast: Bullish
The market is approaching a significant support area 1.867.
The underlined horizontal cluster clearly indicates a highly probable bullish movement with target 1.890 level.
P.S
Overbought describes a period of time where there has been a significant and consistent upward move in price over a period of time without much pullback.
Disclosure: I am part of Trade Nation's Influencer program and receive a monthly fee for using their TradingView charts in my analysis.
Like and subscribe and comment my ideas if you enjoy them!

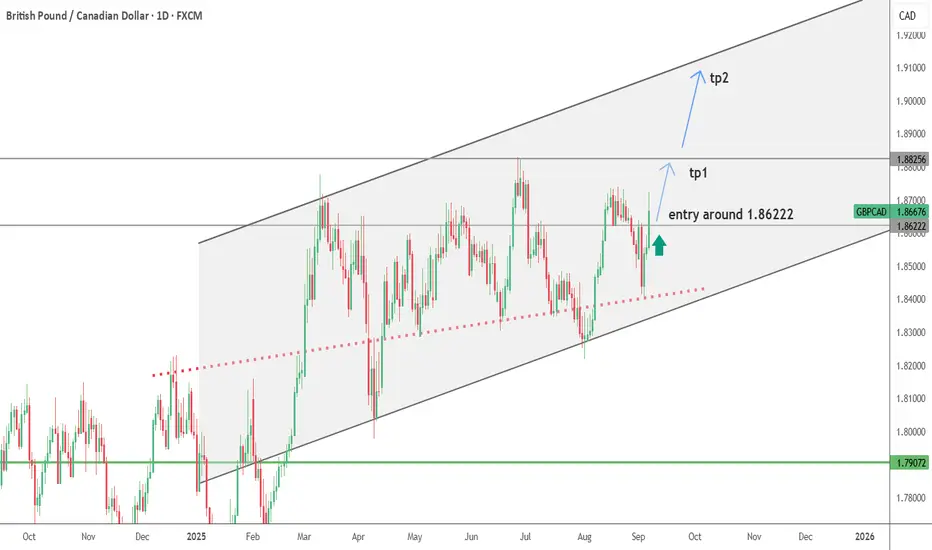
GBPCAD--LONG--ascending channel
--monthly bullish
--daily bullish
--tp and entry levels are as shown on chart


GBPCAD Will Go Lower! Short!
Please, check our technical outlook for GBPCAD.
Time Frame: 1D
Current Trend: Bearish
Sentiment: Overbought (based on 7-period RSI)
Forecast: Bearish
The market is trading around a solid horizontal structure 1.867.
The above observations make me that the market will inevitably achieve 1.853 level.
P.S
We determine oversold/overbought condition with RSI indicator.
When it drops below 30 - the market is considered to be oversold.
When it bounces above 70 - the market is considered to be overbought.
Disclosure: I am part of Trade Nation's Influencer program and receive a monthly fee for using their TradingView charts in my analysis.
Like and subscribe and comment my ideas if you enjoy them!

GBPCADLooking good to short for the 3rd time. From the same area price rejected multiple time making it a very strong resistance.

GBP/CAD SHORT Greetings.. this pair seems to be a little over extended on multiple time frames and has the potential for a pull back. if we can get failure we should get a good risk to reward for a short!!


GbpCadLets see this pullback, in the top we have strong resistence, and the pullback till to retest zone of 1.84550-1.84800, lets see

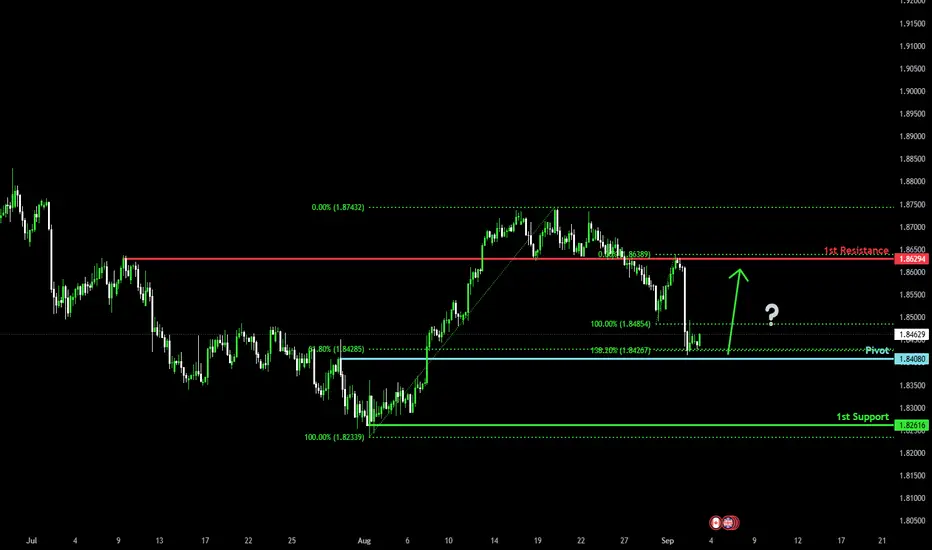
Could we see a reversal from here?GBP/CAD is falling towards the pivot and could bounce to the overlap resistance.
Pivot: 1.8408
1st Support: 1.8261
1st Resistance: 1.8629
Risk Warning:
Trading Forex and CFDs carries a high level of risk to your capital and you should only trade with money you can afford to lose. Trading Forex and CFDs may not be suitable for all investors, so please ensure that you fully understand the risks involved and seek independent advice if necessary.
Disclaimer:
The above opinions given constitute general market commentary, and do not constitute the opinion or advice of IC Markets or any form of personal or investment advice.
Any opinions, news, research, analyses, prices, other information, or links to third-party sites contained on this website are provided on an "as-is" basis, are intended only to be informative, is not an advice nor a recommendation, nor research, or a record of our trading prices, or an offer of, or solicitation for a transaction in any financial instrument and thus should not be treated as such. The information provided does not involve any specific investment objectives, financial situation and needs of any specific person who may receive it. Please be aware, that past performance is not a reliable indicator of future performance and/or results. Past Performance or Forward-looking scenarios based upon the reasonable beliefs of the third-party provider are not a guarantee of future performance. Actual results may differ materially from those anticipated in forward-looking or past performance statements. IC Markets makes no representation or warranty and assumes no liability as to the accuracy or completeness of the information provided, nor any loss arising from any investment based on a recommendation, forecast or any information supplied by any third-party.
GBPCAD (1D) - Swing Trading SetupThis trading plan aims to capture a medium-term upward move on the GBP/CAD pair, leveraging the Smart Money Concept to find optimal entry points for a long position.
Market Context and Bias:
The market has recently experienced a pullback, establishing a clear structure of higher lows and higher highs, confirming a bullish trend. Your bias is long, expecting the price to rebound from a significant demand area to resume its upward momentum.
Key Zones (Critical Areas):
High-Quality (HQ) Order Block (Demand Zone): This is a well-defined demand area where institutional buying is expected. The price is currently near this zone, which serves as a potential entry zone for a pending long position.
Liquidity Pools (LQ Order Block): Below the HQ Order Block, there's also a minor liquidity area that could act as support for any deeper pullbacks.
Imbalance (IRL): Price gaps or imbalances suggest areas where price might fill before continuing its trend, supporting a pullback entry.
Market Structure & Confirmation:
Break of Structure (BOS): The chart shows previous breaks of structure confirming the continuation of the bullish trend.
Price Reaction at Demand Zone: Expect a reaction or bullish candlestick pattern (like a pin bar or engulfing candle) at the HQ Order Block for confirmation of entry.
Liquidity Grab: Watch for a possible liquidity sweep below the demand block to trigger stops before a bullish move.

GBPCAD 3H TECHNICAL ANALYSIS📉 Downtrend — Sequential lower highs from mid-Aug with a capitulation wick into demand near 1.8420.
🔴 RESISTANCE ZONE
🔴 1.85850 — Take-profit shelf / prior support turned resistance
🔴 1.86600 — Supply pivot (lower-high risk)
🔴 1.87300 — Structural cap (trend pivot)
🎯 ENTRIES & TARGETS
📗 BUY LIMIT: 1.84200
📗 BUY STOP (confirmation): 1.84400
🎯 TP ladder: 1.85200 → 1.85500 → 1.85850
🛑 STOP LOSS / Invalidation: 1.83700
🟢 SUPPORT ZONE
🟢 1.8415–1.8425 — Demand block (reaction shelf)
🟢 1.83700 — Hard invalidation; below opens 1.8320 / 1.8280
✍️ STRUCTURAL NOTES
Sharp liquidation drop into a well-defined 3H demand; buyers defending 1.842x.
Reclaim above 1.8440 signals rotation toward 1.8520–1.8585.
Failure below 1.8370 negates bounce idea and resumes trend lower.
📊 TRADE OUTLOOK
Bias = Counter-trend bounce toward 1.8585 while < 1.8660 keeps medium-term trend bearish.
Expect chop on first test of 1.8520–1.8550; partials recommended.
🧪 STRATEGY RECOMMENDATIONS
Conservative (Confirmation Long)
— Entry: 1.84400 (on reclaim)
— TP: 1.85200 → 1.85500 → 1.85850
— SL: 1.83700
— Est. R:R to 1.8585 ≈ ~2.1:1
Aggressive Reversal (Touch of Demand)
— Entry: 1.84200
— TP: 1.85000 → 1.85500 → 1.85850
— SL: 1.83700
— Est. R:R to 1.8585 ≈ ~3.3:1
Watchlist: Reaction at 1.8520–1.8550 (scale), rejection near 1.8585 / 1.8660 (fade risk).
“Discipline | Consistency | PAY-tience™”

GBPCAD With the dramatic bearish momentum today, I’ve opened another sell position. The 1.85000 area seems to be a strong area. Since price has broken the area, it’s most likely that the bearish momentum will continue.

GBPCAD ShortGBPCAD is expected to decline from 1.86, aiming for TP 1 and TP 2, as the confirmed Crab harmonic pattern suggests strong bearish momentum.
