CAD/JPY - Channel Breakout (29.08.2025)The CAD/JPY Pair on the M30 timeframe presents a Potential Selling Opportunity due to a recent Formation of a Channel Breakout Pattern. This suggests a shift in momentum towards the downside in the coming hours.
Possible Short Trade:
Entry: Consider Entering A Short Position around Trendline Of The Pattern.
Target Levels:
1st Support – 106.47
2nd Support – 106.30
🎁 Please hit the like button and
🎁 Leave a comment to support for My Post !
Your likes and comments are incredibly motivating and will encourage me to share more analysis with you.
Best Regards, KABHI_TA_TRADING
Thank you.
Disclosure: I am part of Trade Nation's Influencer program and receive a monthly fee for using their TradingView charts in my analysis.
CADJPY trade ideas

CADJPY: Important Bullish OutlookCADJPY is consolidating throughout the previous trading day, following a test of a significant daily support level.
The recent bullish momentum pushed the price up, and a breach above a minor resistance level within the prevailing sideways pattern may trigger a bullish reversal.
Further upward price movement is anticipated. The subsequent resistance level is projected at 107.66.

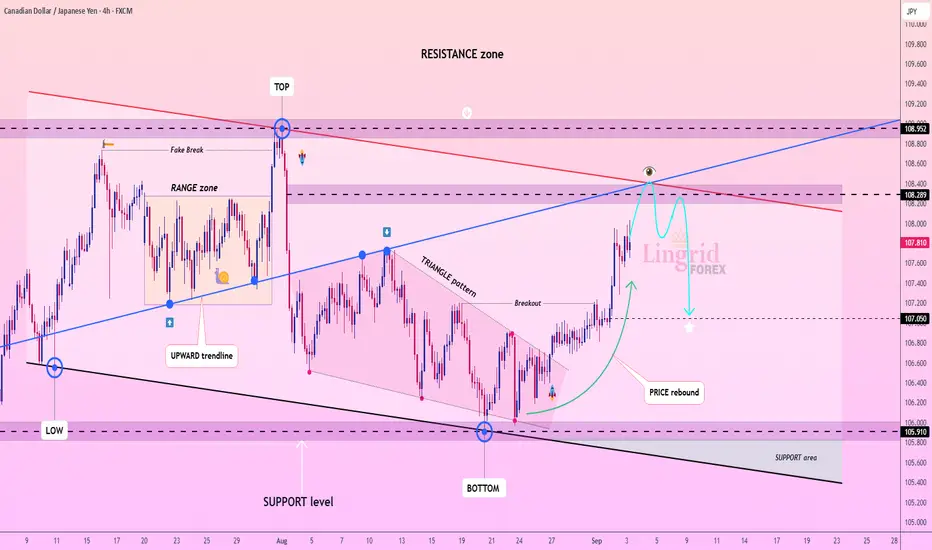
Lingrid | CADJPY Potential Short at the Confluence ZoneFX:CADJPY has recently rebounded from the support zone near 106.00 and surged back toward the resistance structure. The chart shows a breakout from a triangle pattern that shifted momentum upward, but the confluence of trendline and channel border signals a possible rejection at resistance. As long as price remains capped below 108.30–108.50, downside retracement risk increases. A rejection here could send the pair back toward the 107.00 support area, aligning with the broader consolidation phase.
📉 Key Levels:
Sell trigger: Rejection at 108.30 resistance zone
Sell zone: 108.20–108.50 region
Target: 107.05 support
Invalidation: Break and close above 108.95
💡 Risks:
Unexpected strength in CAD fundamentals could fuel a bullish breakout.
JPY weakness from BOJ policy stance could limit downside.
Broader risk-on sentiment in global markets may push price higher despite technical rejection.
If this idea resonates with you or you have your own opinion, traders, hit the comments. I’m excited to read your thoughts!
CADJPY Technical & Order Flow AnalysisOur analysis is based on a multi-timeframe top-down approach and fundamental analysis.
Based on our assessment, the price is expected to return to the monthly level.
DISCLAIMER: This analysis may change at any time without notice and is solely intended to assist traders in making independent investment decisions. Please note that this is a prediction, and I have no obligation to act on it, nor should you.
Please support our analysis with a boost or comment!
CAD/JPY SELLS? Easy Sell spot throughout today. Hope am not tripping lol
B Setup. Retracement to OB targeting OB and Lows.
Continue holding trade if price breaks TP with huge volume targeting lows.
Manage Risk efficiently

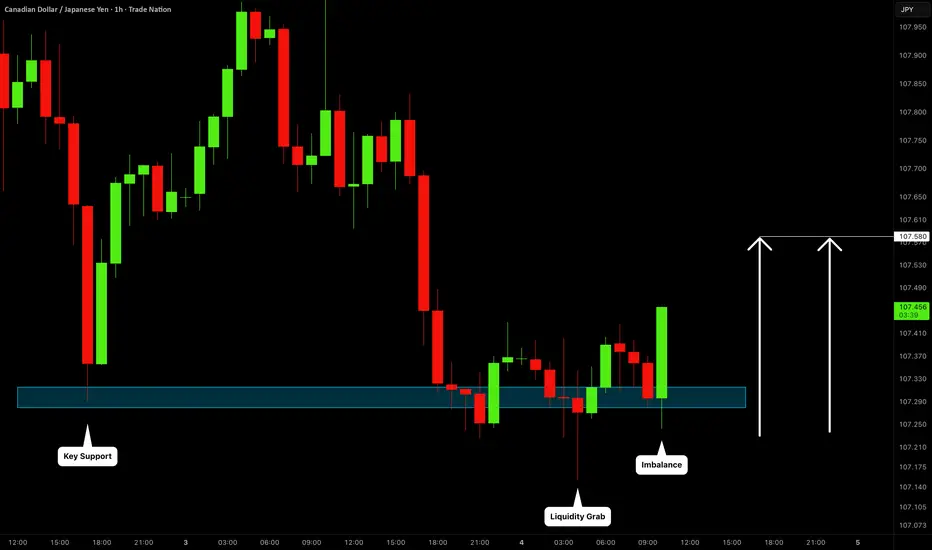
CADJPY: Bullish Move After Liquidity Sweep 🇨🇦🇯🇵
It looks like we have a confirmed bear trap after a test
of a key intraday horizonta support on CADJPY.
A formation of a bullish imbalance candle indicates
a strong bullish sentiment now.
I expect a bullish move to 107.58
❤️Please, support my work with like, thank you!❤️
I am part of Trade Nation's Influencer program and receive a monthly fee for using their TradingView charts in my analysis.
CADJPY SELLWe have officially gotten a change of trend as proven by the transition from a sequence of higher highs and higher lows to a lower low and lower high. Stacked on top of this sequence is a pullback for a retest of a key level confirming our setup.

CAD/JPY BEARISH BIAS RIGHT NOW| SHORT
Hello, Friends!
CAD/JPY is trending down which is clear from the red colour of the previous weekly candle. However, the price has locally surged into the overbought territory. Which can be told from its proximity to the BB upper band. Which presents a great trend following opportunity for a short trade from the resistance line above towards the demand level of 105.850.
Disclosure: I am part of Trade Nation's Influencer program and receive a monthly fee for using their TradingView charts in my analysis.
✅LIKE AND COMMENT MY IDEAS✅

CADJPY: Bullish Wave Will ContinueThe 📈CADJPY pair has demonstrated a decisive breakout above both a declining trend line and a significant horizontal resistance level on the intraday chart.
The subsequent historical resistance level is situated at 107.11, which may serve as a potential target for bullish price action.

Bullish momentum to extend?CAD/JPY has bounced off the pivot, which acts as a pullback support that aligns with the 38.2% Fibonacci retracement and could bounce to the 1st resistance.
Pivot: 107.20
1st Support: 106.88
1st Resistance: 108.24
Disclaimer:
The above opinions given constitute general market commentary, and do not constitute the opinion or advice of IC Markets or any form of personal or investment advice.
Any opinions, news, research, analyses, prices, other information, or links to third-party sites contained on this website are provided on an "as-is" basis, are intended only to be informative, is not an advice nor a recommendation, nor research, or a record of our trading prices, or an offer of, or solicitation for a transaction in any financial instrument and thus should not be treated as such. The information provided does not involve any specific investment objectives, financial situation and needs of any specific person who may receive it. Please be aware, that past performance is not a reliable indicator of future performance and/or results. Past Performance or Forward-looking scenarios based upon the reasonable beliefs of the third-party provider are not a guarantee of future performance. Actual results may differ materially from those anticipated in forward-looking or past performance statements. IC Markets makes no representation or warranty and assumes no liability as to the accuracy or completeness of the information provided, nor any loss arising from any investment based on a recommendation, forecast or any information supplied by any third-party.

CADJPY SHORT Market structure bearish on HTFs DW
Entry at both Weekly and Daily AOi
Weekly Rejection at AOi
Weekly EMA Retest
Previous Weekly Structure Point
Daily Rejection at AOi
Daily EMA retest
Previous Structure point Daily
Round Psych Level 107.000
H4 EMA retest
H4 Candlestick rejection
Levels 3
Entry 100%
REMEMBER : Trading is a Game Of Probability
: Manage Your Risk
: Be Patient
: Every Moment Is Unique
: Rinse, Wash, Repeat!
: Christ is King.

CAD_JPY LOCAL LONG|
✅CAD_JPY is going down now
But a strong support level
Is ahead around 107.200
Thus I am expecting a rebound
And a move up towards
The target of 107.400
LONG🚀
✅Like and subscribe to never miss a new idea!✅

CADJPYADJPY is maintaining bullish momentum and has the potential to continue its upward move next week. Traders should look for confirmation to join the trend.

[CADJPY] Trade ideaEntering a short position on this pair, looking for last low as target and will hold for more if we break through (with a moving SL to secure the PnL)
Great Trade !

CADJPY Bullish After CADJPY broke the trendline and the 20 sma is holding it up, it is now in a consolidation.
We will look to enter as soon as it breaks the consolidation to the upside.


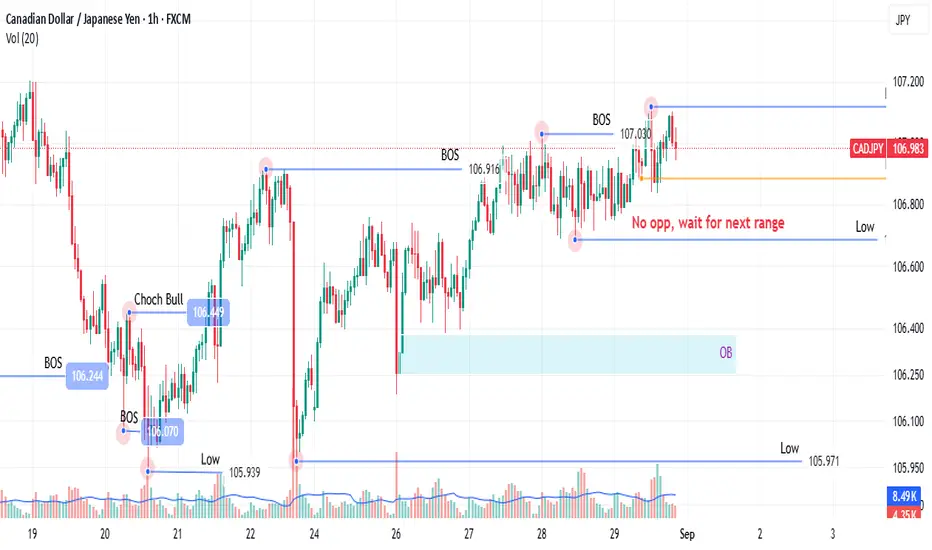
CADJPY (1H) - Swing Trading PlanThis trading plan outlines a swing trade opportunity on the CAD/JPY 1-hour chart, leveraging Smart Money Concepts to identify optimal entry points for a pending long position.
Market Structure Analysis:
The CADJPY pair has recently shown a strong upward trend, indicating a bullish bias. I observe a clear break of structure (BOS) to the upside, confirming the continuation of the bullish momentum. The market is currently undergoing a retracement, presenting an opportunity to enter at a discounted price within the overall bullish trend.
Key Entry Zones (Smart Money Concepts):
- HTF Order Block (Demand Zone): A significant Higher Time Frame (HTF) Order Block is identified around the 106.900 area. This zone represents an area where institutional buying occurred, making it a high-probability reversal point.
- Fair Value Gap (FVG): There is a Fair Value Gap (FVG) present just above the HTF Order Block, aligning with our potential entry zone. FVGs indicate an imbalance in the market, often attracting price back to fill the gap.
- 50% Discount (Equilibrium): The 50% retracement of the recent price swing (often referred to as equilibrium) aligns closely with the identified HTF Order Block and FVG, adding confluence to our entry area, signifying a discounted price.

The Two Pillars That Changed My TradingAfter years of trial and error, I shifted my focus from searching for signals to building a foundation. For me, that foundation rests on two pillars:
Pillar 1: Risk Management
Risk per trade: Fixed % of account. Currently, mine is 0.5%
Minimum Risk/Reward: 1:2. I try as much as possible to make this minimum a rare occasion; I try to aim for higher, but it all depends on other factors of the setup.
Position sizing: Calculated precisely before every entry. I base it on three factors: the current account balance, risk per trade, SL distance.
Pillar 2: The Trading Plan
A written, unambiguous set of rules for every action.
Based on price action and market structure.
Designed to be followed without emotion or deviation.
These pillars work together. The plan gives me confidence, and the risk management gives me the longevity to be wrong. This mindset shift made all the difference. I document my journey applying these principles in detail elsewhere.
What's one rule in your trading plan you won't break?
CADJPY Rejection at Key Supply Zone – Bearish Move Ahead?Hello Traders! 👋
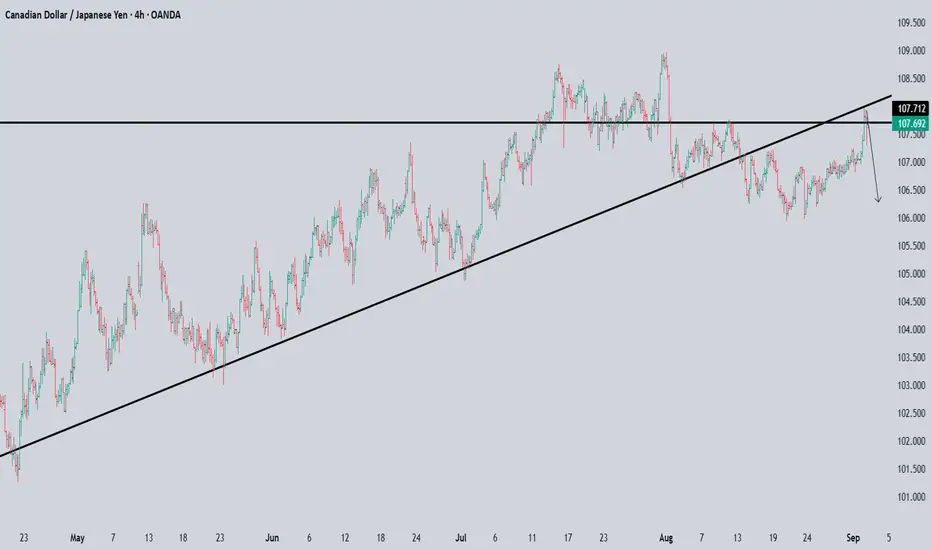
CADJPY is showing signs of weakness after testing the 107.478 – 108.504 supply zone. Price broke below the ascending trendline and is now retesting it as resistance. If this rejection holds, we could see strong bearish momentum pushing price toward the 104.644 support zone.
🔑 Key Levels to Watch:
Resistance Zone: 107.478 – 108.504
Current Price: 106.85
Next Bearish Target: 104.644
⚡ Bias: Bearish if rejection holds below 107.478. A clean close above 108.504 would invalidate this setup.
📌 Technical Confluence:
Trendline break ✅
Supply zone retest ✅
Lower highs forming ✅
What do you think? Will CADJPY respect this supply zone and drop, or will the bulls reclaim control?
💬 Drop your thoughts below & let’s discuss!
👍 Don’t forget to like, share, and follow for more setups. ❤️

CADJPY Bullish outlookH4 just broke the trendline (refer chart)
and the price keep on making higher low.
I'm expecting market to push to higher price.
calculate your own risk & reward.
good luck

Bearish reversal off pullback resistance?CAD/JPY is rising towards the pivot and could reverse to the 1st support.
Pivot: 107.14
1st Support: 106.08
1st Resistance: 107.73
Risk Warning:
Trading Forex and CFDs carries a high level of risk to your capital and you should only trade with money you can afford to lose. Trading Forex and CFDs may not be suitable for all investors, so please ensure that you fully understand the risks involved and seek independent advice if necessary.
Disclaimer:
The above opinions given constitute general market commentary, and do not constitute the opinion or advice of IC Markets or any form of personal or investment advice.
Any opinions, news, research, analyses, prices, other information, or links to third-party sites contained on this website are provided on an "as-is" basis, are intended only to be informative, is not an advice nor a recommendation, nor research, or a record of our trading prices, or an offer of, or solicitation for a transaction in any financial instrument and thus should not be treated as such. The information provided does not involve any specific investment objectives, financial situation and needs of any specific person who may receive it. Please be aware, that past performance is not a reliable indicator of future performance and/or results. Past Performance or Forward-looking scenarios based upon the reasonable beliefs of the third-party provider are not a guarantee of future performance. Actual results may differ materially from those anticipated in forward-looking or past performance statements. IC Markets makes no representation or warranty and assumes no liability as to the accuracy or completeness of the information provided, nor any loss arising from any investment based on a recommendation, forecast or any information supplied by any third-party.

CADJPY BUY - Take it or Leave itThe price break the bearish trend line it is already react on the last supply zone. It is possible to see the price climb on the strong supply zone of 8 - 12/8/2025.

CADJPY Bullish Breakout!
HI,Traders !
#CADJPY made a bullish
Breakout of the falling resistance
And the breakout is confirmed
So we are bullish biased
And we will be expecting
A further bullish move up !
Comment and subscribe to help us grow !
