CADJPY NEXT PLAN 15/8CADJPY update — we’re close to having a near-perfect 5R setup. A buy from here is possible; it’s a bit risky, but still a strong 1:5 R:R opportunity.
I’m Mr 1:5, a trader with a fixed risk–reward ratio. Follow me so you won’t miss setups like this. In just a few days, I’ve already had multiple trades hitting 5R.
TradingView limits how often I can post, so I can’t share too frequently — I have to alternate between “mind” and “ideal” setups. I always keep my positions updated, so make sure to watch for them.
CADJPY trade ideas

Invalid trend?Generally, candles formed by news events, or sudden consecutive green or red candles, are usually unreliable and have a high chance of reversing—unless, after a pause, we get confirmation that the trend isn’t fake.

CAD/JPY Finally Broke C.T.L , Ready For Sell Now To Get 100 PipsHere is my 2H T.F CAD/JPY Chart and we have a very clear breakout and the price confirmed already by amazing bearish candle closed below my C.T.L , So we can sell now and targeting from 50 to 100 pips .
Reasons :
1- Clear Breakout
2- Bearish P.A .
3- Clear Confirmation .

CAD/JPY BULLISH BIAS RIGHT NOW| LONG
CAD/JPY SIGNAL
Trade Direction: short
Entry Level: 106.355
Target Level: 107.547
Stop Loss: 105.559
RISK PROFILE
Risk level: medium
Suggested risk: 1%
Timeframe: 9h
Disclosure: I am part of Trade Nation's Influencer program and receive a monthly fee for using their TradingView charts in my analysis.
✅LIKE AND COMMENT MY IDEAS✅

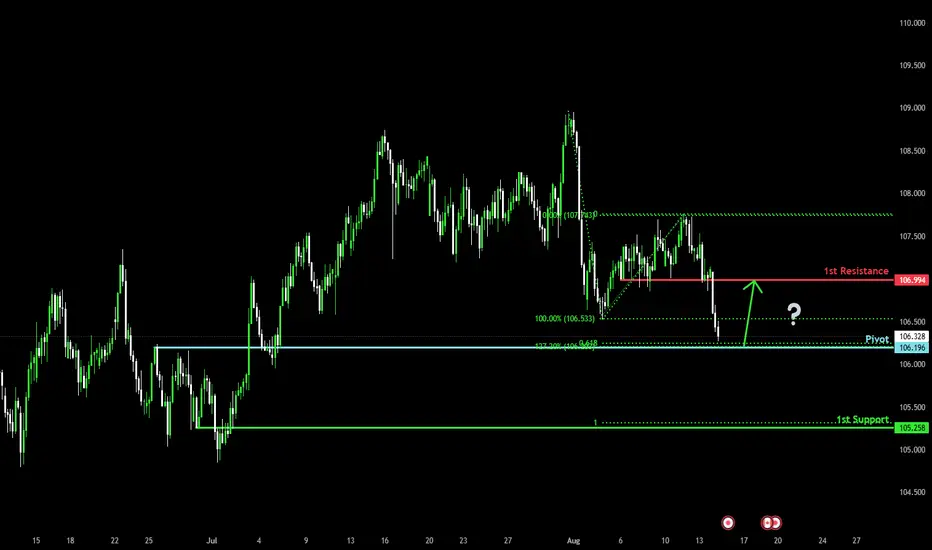
Bullish bounce off Fibonacci support?CAD/JPY is falling towards the pivot which acts as an overlap support that aligns with the 127.2% Fibonacci extension and the 61.8% Fibonacci projection and could bounce to the 1st resistance.
Pivot: 106.19
1st Support: 105.25
1st Resistance: 106.99
Risk Warning:
Trading Forex and CFDs carries a high level of risk to your capital and you should only trade with money you can afford to lose. Trading Forex and CFDs may not be suitable for all investors, so please ensure that you fully understand the risks involved and seek independent advice if necessary.
Disclaimer:
The above opinions given constitute general market commentary, and do not constitute the opinion or advice of IC Markets or any form of personal or investment advice.
Any opinions, news, research, analyses, prices, other information, or links to third-party sites contained on this website are provided on an "as-is" basis, are intended only to be informative, is not an advice nor a recommendation, nor research, or a record of our trading prices, or an offer of, or solicitation for a transaction in any financial instrument and thus should not be treated as such. The information provided does not involve any specific investment objectives, financial situation and needs of any specific person who may receive it. Please be aware, that past performance is not a reliable indicator of future performance and/or results. Past Performance or Forward-looking scenarios based upon the reasonable beliefs of the third-party provider are not a guarantee of future performance. Actual results may differ materially from those anticipated in forward-looking or past performance statements. IC Markets makes no representation or warranty and assumes no liability as to the accuracy or completeness of the information provided, nor any loss arising from any investment based on a recommendation, forecast or any information supplied by any third-party.
CADJPY Sell-Off Triggered by U.S.–Japan Currency TensionsCADJPY Sell-Off Triggered by U.S.–Japan Currency Tensions
During the early hours of the European session, CADJPY experienced a swift sell-off.
This week’s economic calendar has been notably quiet, and as I’ve emphasized several times, trading volume was expected to remain low—barring any major geopolitical surprises.
Ironically, it wasn’t Trump this time, but rather U.S. Treasury Secretary Bessent whose remarks triggered the move, aiming to pressure Japan into strengthening the yen.
CADJPY had already broken down from a major bullish trend that began on May 25, peaking at 108.95 on August 1. Last night, the pair confirmed a clear bearish breakout, dropping nearly 80 pips. While I expect a brief pause before further downside, the bearish momentum appears to be firmly underway.
Now, the market simply needs time to digest the news.
You may find more details in the chart!
Thank you and Good Luck!
PS: Please support with a like or comment if you find this analysis useful for your trading day
Disclosure: I am part of Trade Nation's Influencer program and receive a monthly fee for using their TradingView charts in my analysis.

Short CADJPY and USDJPY, Swing Trade Trading Idea: Short CADJPY & USDJPY
Date: August 14, 2025
Strategy Type: Short-term bearish play on JPY crosses
📰 Key News Drivers
- Japan GDP Data (Q2 Preliminary):
- QoQ: 0.0% (flat growth)
- YoY: -0.2% (mild contraction)
- GDP Deflator YoY: 3.3% (strong inflation signal)
- USDJPY Technical Outlook:
- Current price: ~146.60
- Bearish momentum confirmed by moving averages
- Key support: 146.386
- Break below 146.500 could trigger further downside
- JPY Strength Factors:
- Modest improvement in Japan’s M2 Money Stock
- Lower-than-expected U.S. inflation data weakening USD
- Risk-off sentiment favoring safe-haven JPY
📊 Trade Rationale
| Pair | Bearish Catalyst | Technical Setup | Target Zone |
| USDJPY | Weak U.S. inflation + strong JPY deflator | Testing support at 146.386 | 146.00 or lower |
| CADJPY | CAD vulnerable to oil price volatility + JPY strength | Likely to follow USDJPY breakdown | 106.50–107.00 |
- JPY Strength Thesis: Despite flat GDP growth, the strong deflator suggests inflationary pressure, which may prompt the BoJ to maintain or tighten policy. This supports JPY appreciation.
- USD Weakness: Lower inflation expectations in the U.S. reduce the likelihood of further Fed hikes, weakening USD.
- CAD Vulnerability: CADJPY often correlates with risk sentiment and oil prices. With JPY gaining and global risk tone cautious, CADJPY is exposed.
📌 Execution Plan
- USDJPY:
- Entry: Short below 146.50
- Stop: 147.10
- Target: 146.00 / 145.50
- CADJPY:
- Entry: Short below 107.50
- Stop: 108.20
- Target: 106.50 / 106.00

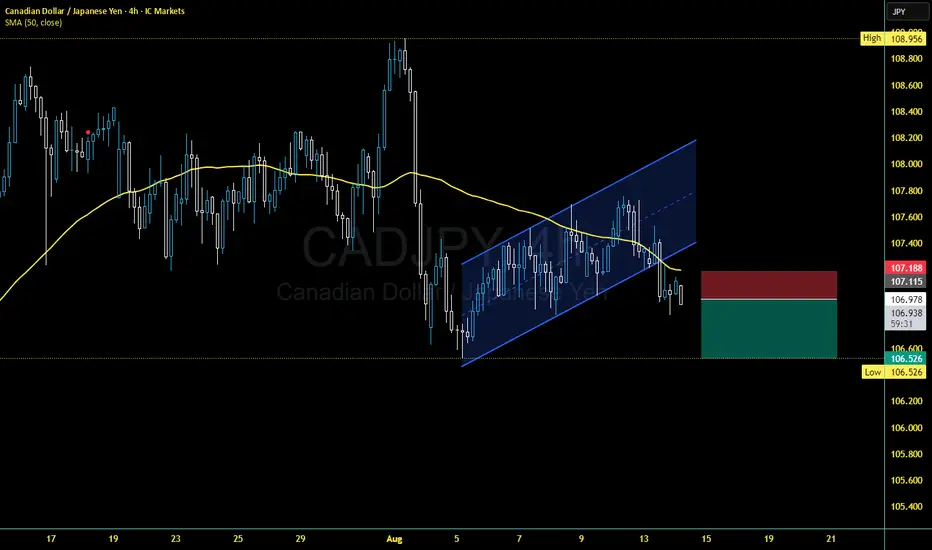
CADJPY 4H bearish continuation??Price broke the bearish channel yesterday(13/08) with a strong bearish candle and re-tested it with a "pseudo" Pin bar. The opening today at 7:00 am (AEST) shows a possible downward continuation. This idea is in agreement with linofx1 post. I will wait for the 11:00 am candle to confirm the downward move and for some PA signs to jump short. Also I will keep one eye on the Fundamentals tomorrow for the JPY GDP.
CADJPY Expected Growth! BUY!
My dear friends,
My technical analysis for CADJPY is below:
The market is trading on 107.09 pivot level.
Bias - Bullish
Technical Indicators: Both Super Trend & Pivot HL indicate a highly probable Bullish continuation.
Target - 107.30
About Used Indicators:
A pivot point is a technical analysis indicator, or calculations, used to determine the overall trend of the market over different time frames.
Disclosure: I am part of Trade Nation's Influencer program and receive a monthly fee for using their TradingView charts in my analysis.
———————————
WISH YOU ALL LUCK

CADJPY: Classic Trend-Following PatternI spotted a favorable bearish pattern on 📉CADJPY on a 4-hour chart,
the price has created a bearish flag.
Currently in a slight bearish trend, breaking below the flag's support would signal a strong continuation of the trend.
We can anticipate a decline to 106.68.

CURRENT TRADE ON CADJPY MY predictions for cadjpy is already playing out small push up before we form a lower low on the daily timeframe

CADJPY, Low probability?In the higher timeframes, CJ has been in an uptrend.
After prices reaches at significant Psychological levels in the previous weeks the pair experienced a counter trend with which we still try to seize an opportunity.

Cadjpy enter for longCadjpy enter for long = in this video i will show my friends what i am gonna trade

CAD/JPY – 4H Technical & Fundamental AnalysisCAD/JPY – 4H Technical & Fundamental Analysis
Canadian Dollar remains under pressure amid slowing exports, weak domestic demand, rising unemployment at 7%, and subdued business investment — all raising recession risks. In addition, recent trade tensions and high U.S. tariffs further weigh on CAD sentiment.
From a technical perspective, the pair has lost bullish momentum after breaking the major key support, creating a Change of Character (CHoCH) to the downside. Following this break, sellers entered the market, but market makers hunted liquidity above recent highs before pushing the price lower again. Price is now approaching the 107.180 zone, with a potential setup for a further bearish continuation if broken decisively.
🔽 Sell Setup Plan:
Entry (Sell Stop): 107.180
Stop Loss: 107.700 (above liquidity zone)
Take Profit: 105.960 (next minor key support)
📌 Disclaimer:
This is not financial advice. Always wait for proper confirmation before executing trades. Manage risk wisely and trade what you see—not what you feel.

MY THOUGHTS ON CADJPYONCE PRICES TOUCHS MY CONFLUENCE ZONE I WOUKD wait for a bullish egulfing candle to close on the 1h time frame above my CTL and take my entry LONG

CADJPY Technical & Order Flow AnalysisOur analysis is based on a multi-timeframe top-down approach and fundamental analysis.
Based on our assessment, the price is expected to return to the monthly level.
DISCLAIMER: This analysis may change at any time without notice and is solely intended to assist traders in making independent investment decisions. Please note that this is a prediction, and I have no obligation to act on it, nor should you.
Please support our analysis with a boost or comment!

CADJPY Bullish Breakout!
HI,Traders !
#CADJPY keeps growing and
The pair made a bullish breakout
Of the key horizontal level
Of 107.376 and the breakout
Is confirmed so we are bullish
Biased and we will be
Expecting a further move up !
Comment and subscribe to help us grow !

AUDJPY & CADJPY Trade Recaps 08.08.25A long position on AUDJPY taken Monday for a -1%, the trade had great potential but one of those ones that didn't have enough steam to commit. Followed by a CADJPY short taken yesterday for a +2% manual close.
Full explanation as to why I executed on these positions and the management plan with both.
Any questions you have just drop them below 👇

CADJPYIt will follow till tomorrow midday.
Let´s see.
Blessings.
Check "passiveincomes" at signal start.
thanks

CADJPY Is Bearish! Sell!
Take a look at our analysis for CADJPY.
Time Frame: 2h
Current Trend: Bearish
Sentiment: Overbought (based on 7-period RSI)
Forecast: Bearish
The market is approaching a key horizontal level 107.345.
Considering the today's price action, probabilities will be high to see a movement to 106.396.
P.S
We determine oversold/overbought condition with RSI indicator.
When it drops below 30 - the market is considered to be oversold.
When it bounces above 70 - the market is considered to be overbought.
Disclosure: I am part of Trade Nation's Influencer program and receive a monthly fee for using their TradingView charts in my analysis.
Like and subscribe and comment my ideas if you enjoy them!

07.08.25.25 Morning ForecastPairs on Watch -
FX:CADJPY (Live position)
FX:EURNZD
FX:EURCAD
A short overview of the instruments I am looking at for today, multi-timeframe analysis down to what I will be looking at for an entry. Enjoy!

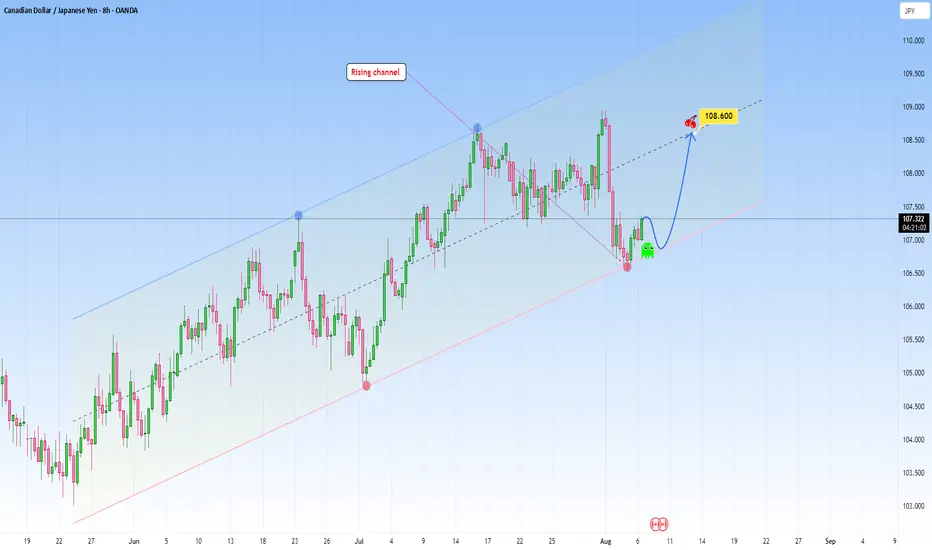
CADJPY: Moving in a clear rising channelCADJPY is currently respecting a well-defined rising channel structure, with price reacting cleanly to both the upper and lower bounds of the channel.
After a sharp correction, price has once again tapped the lower trendline support, a level that has triggered bullish reversals, and is now showing early bullish signs.
This bounce suggests the market is preparing for another leg up, with 108.600 marked as a key target near the midline of the channel, which often acts as dynamic resistance in trending conditions.
Sell from PivotMy trading stradegy is simple
open trades on a Pivot lines (M / W)
this pair had strong movement down and may contiue bit more
my view
