CADJPY, Double Top with Bearish Divergence at Weekly ResistanceDouble Top formation at weekly resistance
Matured Bearish Divergence
Rejection seen with Losing bullish momentum
New low or bearish activity expected
Sell @ CMP
SL above double top
Target 1:1
CADJPY trade ideas

CADJPY might display weaknessThe Canadian dollar might display weakness against the Japanese Yen.
Yields of 30-year bonds of Canada were pushed higher after the stronger than expected inflation print in October, and the situation has been temporarily bullish for CADJPY, but Yen remains to stay either a safe haven amid geopoliitcal uncertainty and a higher yield currency at the same time.
So, CADJPY might follow the track of it's peers (EURJPY, GBPJPY) and slide deeper as shown at the chart. The trade location is potentially interesting for shorts.
Remember - that's not a trading advice, always DYOR and manage your risk!

cadjpy test support zonecadjpy is trading ar support zone if price break support it will bearish and if price bounce back from support it will go bullish

CADJPYit's been in a strong uptrend, it's a bit late to enter a trade here, but if it pulls back to the consolidation of the v-formation neck, I'll open a long.

CADJPY - BEARISH TRADEPrice moving in bullish trend formed bearsih divergence with double top reversal pattern.
It indicates trend reverse to declining phase.
If price crosses down neckline, sellers will remain in control.

#006 DCA CADJPY SellI wanted to short CADJPY just now when price was at the weak up channel, however, on the higher time frame, especially the Daily, price was above the 60SMA, so, I thought to myself, I might sell it later if I get some extra confirmations in some form, for example, strong selling pressure.
Now, price has collapsed downwards and so I decided to sell into this downward pressure.
In the past I like to wait for price to come back to an area of value as taught by Rayner, but based on my experience, the levels I draw is as good as a toddler's drawing.
With this DCA trading, I decided to just enter at any spot that I want to, and then if price retraces back to "previous areas of value", I place pre-determined Limit Orders for price to trigger.
I am an agent.
I buy and sell as the market wishes. I provide the liquidity to whoever who comes to my money exchange shop.
Doesn't matter if SGD 1 is RM2 or RM3.3, I just buy and sell however much the customer wants and profit the difference.
That's my job and that's what I do. Just that, I am doing it on a laptop.
I might be in the brokers B Book. But who cares? Life is a simulation. Trading is also just a simulation for most. Including me.
0000SGT 21112024

CADJPY A Fall Expected! SELL!
My dear subscribers,
This is my opinion on the CADJPY next move:
The instrument tests an important psychological level 111.33
Bias - Bearish
Technical Indicators: Supper Trend gives a precise Bearish signal, while Pivot Point HL predicts price changes and potential reversals in the market.
Target - 110.57
My Stop Loss - 111.79
About Used Indicators:
On the subsequent day, trading above the pivot point is thought to indicate ongoing bullish sentiment, while trading below the pivot point indicates bearish sentiment.
———————————
WISH YOU ALL LUCK

cadjpy sell
H4 there is a bullish channel and a double top
H1 the structure is bearish and the 21 ema is about to cross the 50 ema
M15 fibs reject 61.8 and the tp at 127 and the last floors of H1

CADJPY Breakdown Following Structural FailureHey Guys,
Today, we are trading the CADJPY live. Earlier this week, I highlighted 110.48 as a critical level to monitor, as it marks the reset point (Structure 4) of the last completed H1 bearish wave structure.
Key levels of interest for further downside movement:
109.56
109.06

CADJPY: Pullback From Resistance?! 🇨🇦🇯🇵
CADJPY may retrace from a key daily horizontal resistance.
As a confirmation, I see a tiny double top pattern on an hourly time frame.
Goal - 111.06
❤️Please, support my work with like, thank you!❤️

Midweek Portfolio Selection: Weekly & Daily CSI AnalysisJoin me for the Midweek Portfolio Selection, where we analyse the Weekly and Daily Currency Strength Index (CSI) to identify shifts in the currency landscape. This process helps refine our trading bias to stay aligned with market dynamics.
In this episode, we’ve observed notable changes, particularly in the AUD and USD.
Key Highlights:
Buy Pairs: AUD, CAD, JPY, CHF, USD
Sell Pairs: EUR, GBP, NZD
Combining these buy and sell pairs increases the probability of capturing strong directional movements in the forex market.
If you find this video helpful, please give it a thumbs up and share your thoughts in the comments.
Wishing you a successful trading week!
Happy Trading!

CADJPY LONGSBeen a Bullish trend since October, and November opened above Oct close. Big ingulfing candle with the close and open below( July close was resistance turn to support with November opening above. I'm expecting buys above 109.899 and Take profits FX:CADJPY at 112/113/114 and possibly 115/116 but pullbacks around 113 before the larger scale moves.

CADJPY demand trade idea we have CAD breaking alot of structure to the upside and now its back at a demand and we have a nice rejection candle of the demand and the 200 ema. if we can break this h4 candle to the upside i will get in to this trade and SETANDFORGET as always.

Market Analysis: CADJPY H1 Bearish Wave Structure AnalysisThis evening, my focus is on the CADJPY H1 timeframe. We have identified a completed bearish wave structure on the H1 timeframe. Earlier this afternoon, during the New York session, a trend reset was observed, breaking above the last Structure 4.
From this point, based on wave structure anatomy, we anticipate selling interest to initiate a new bearish wave structure downward. The key level to watch is 110.48.
Happy trading!

CADJPYWe can attempt to buy CADJPY from specified level as it make HL , also 0.618 FIB level intact indicate that it moves upward.
SL , TP mention in chart

Fundamentals 11/19/2024Hello,
Today, we reviewed our fundamental news information. Although all the information has not yet been released, we were able to gain some insight into how our larger player may impact the market. With that said, I would like to express my gratitude to all of you for taking the time to join us again. The fundamentals as of this current moment have provided us with some insight into the euro pairs, the US dollar pairs, and the Canadian dollar.
However, we have received some new information that we will have to review in the following video. It appears that this information has brought some volatility to the market, which is favorable for us. Therefore, we must be patient while this volatility runs its course in the market. As of now, a trade opportunity is developing.
thank you,

CAD/JPY BULLS WILL DOMINATE THE MARKET|LONG
Hello, Friends!
We are now examining the CAD/JPY pair and we can see that the pair is going down locally while also being in a downtrend on the 1W TF. But there is also a powerful signal from the BB lower band being nearby indicating that the pair is oversold so we can go long from the support line below and a target at 111.487 level.
✅LIKE AND COMMENT MY IDEAS✅

CADJPY: Bullish Continuation is Expected! Here is Why:
It is essential that we apply multitimeframe technical analysis and there is no better example of why that is the case than the current CADJPY chart which, if analyzed properly, clearly points in the upward direction.
❤️ Please, support our work with like & comment! ❤️

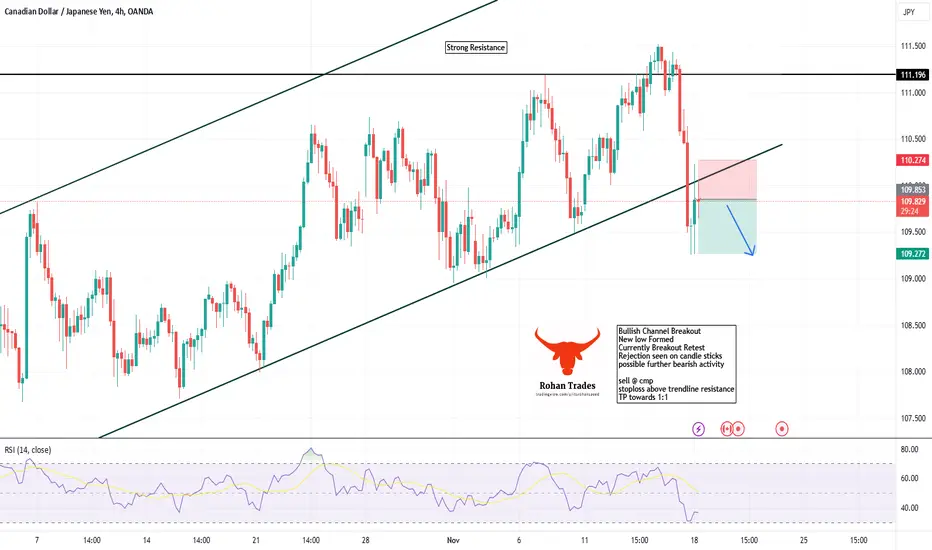
CADJPY, Breakout of Bullish ChannelBullish Channel Breakout
New low Formed
Currently Breakout Retest
Rejection seen on candle sticks
possible further bearish activity
sell @ cmp
stoploss above trendline resistance
TP towards 1:1
CADJPY SELL SETUPCJ also gave an impulse sell off from supply structure also forming an evening star on the daily. Now looking for another sell opportunity on the pull back or retest!

CAD_JPY BULLISH BIAS|LONG|
✅CAD_JPY will soon retest a key support level of 108.993
So I think that the pair will make a rebound
And go up to retest the supply level above at 109.900
LONG🚀
✅Like and subscribe to never miss a new idea!

CADJPYwith the recent market structure shift, cadjpy is expected tp continue it bearish momentum after a pullback to the last demand zone

CADJPY Will Grow! Long!
Take a look at our analysis for CADJPY.
Time Frame: 1h
Current Trend: Bullish
Sentiment: Oversold (based on 7-period RSI)
Forecast: Bullish
The market is trading around a solid horizontal structure 109.494.
The above observations make me that the market will inevitably achieve 110.050 level.
P.S
We determine oversold/overbought condition with RSI indicator.
When it drops below 30 - the market is considered to be oversold.
When it bounces above 70 - the market is considered to be overbought.
Like and subscribe and comment my ideas if you enjoy them!
