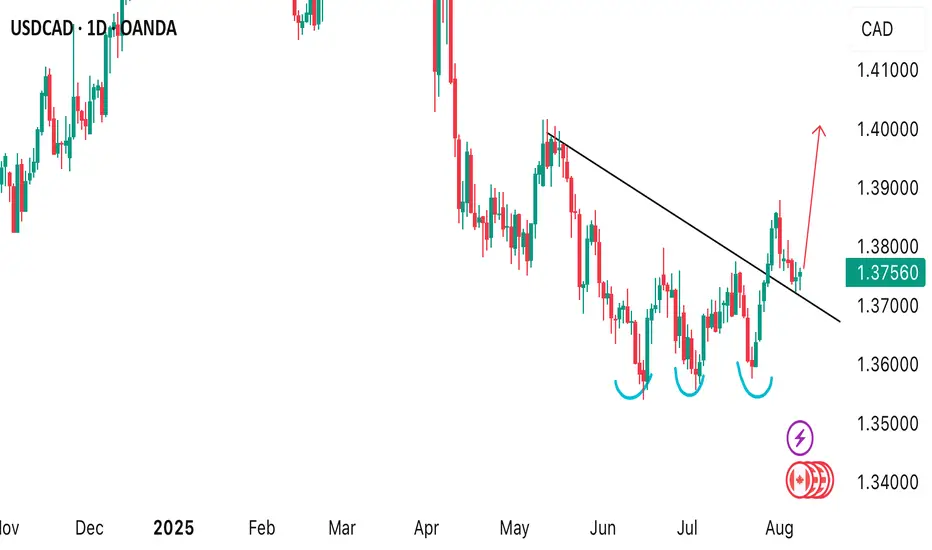
USDCAD BUY OPPORTUNITY Price is looking quite interesting for a buy opportunity from the current market price. We can see how price recently rebounded from the dynamic resistance and support trendline. It’s signaling a possible buy opportunity.
CADUSD trade ideas

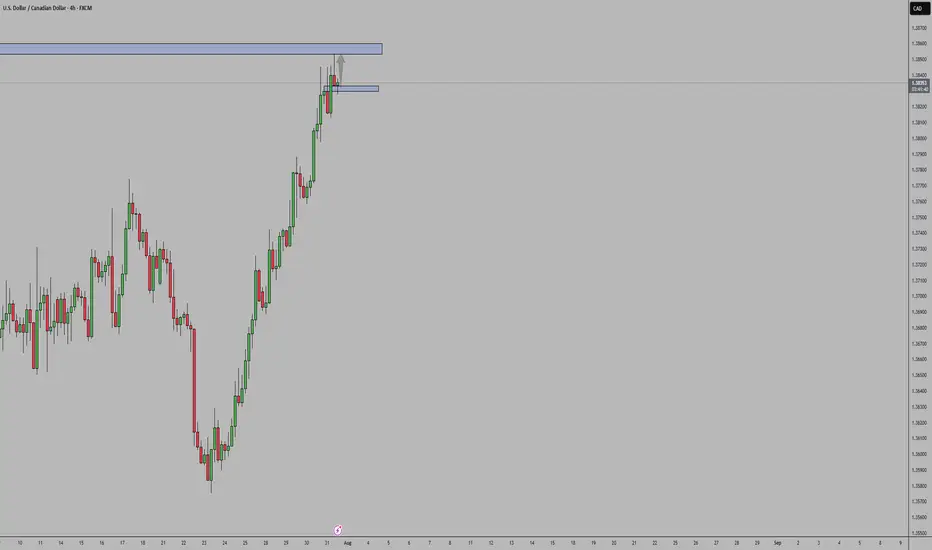
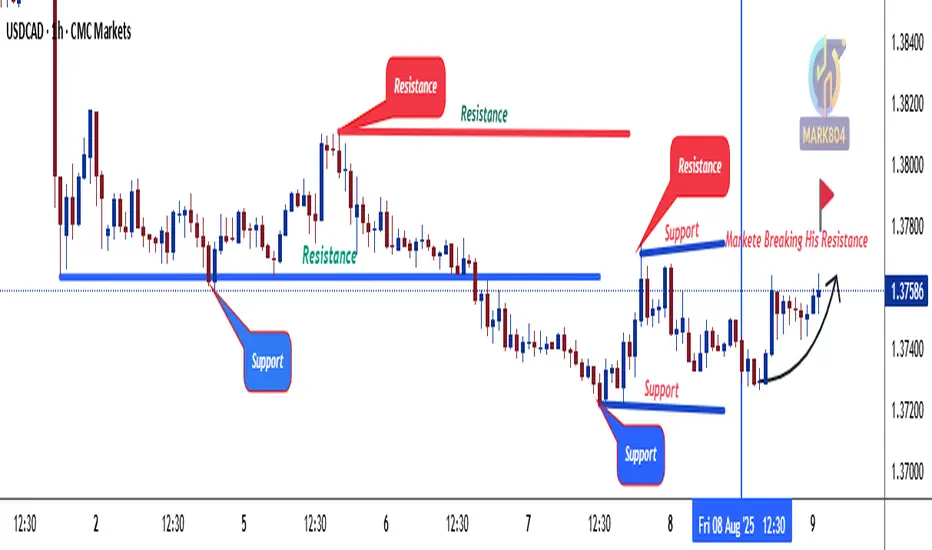
USDCADSupport Zone: Price has retested a strong support area
Price Action: The retest held — buyers defended it, showing rejection wicks / bullish candles.
Bias: Bullish while support holds → look for continuation to next resistance.
Invalidation: Bias weakens if support breaks and closes below the zone.
So as long as price stays above the retested support, USD/CAD remains bullish.
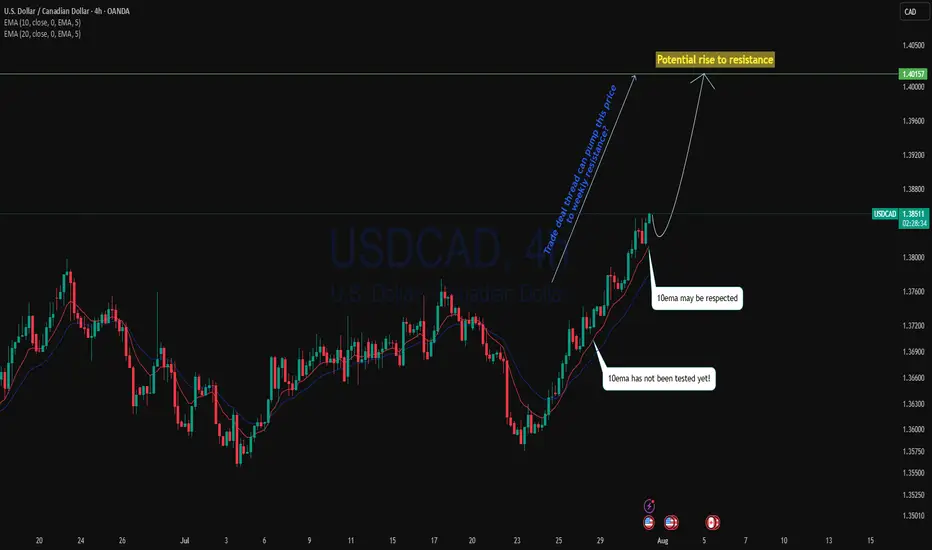
Trade deal thread could pump USDCAD?USDCAD as with the bounce off the monthly support level, current is a strong uptrend.4H perspective, price is trading above 10ema since the cross over of 20ema and 10ema price is pushing back to the upside. With trade deal thread, including upcoming GDP on CAD could pump this price back to the resistance ?
As 10ema has not been tested since cross over, we may see the price to back to the upside with respecting the 10ema.
Buying on EMA is a high probability trade setup.
USD/CAD Unless oil rockets, then the pair has room to rise.From June till now, we’ve been in a range-bound market, with multiple failed attempts to break lower.
But now we’re seeing higher lows forming, and price is bouncing off my fvp zone @ 1.36600 . So if the Fed stays patient and oil stays weak or sideways, USD/CAD bulls have the upper hand. I am expecting a bearish retest soon to develop @ Key Bullish FVP Zone: 1.36600, but if 1.3577 gets violated with strength, then scratch the long idea — it might be time for CAD bulls to party instead.
Extreme Discount Zone: Just below at 1.36000,
If the price dips into this area, it could be a liquidity hunt. But if not, then the bulls will have to come in and drive the market to the
1st Take Profit Target: 1.38400

USD/CAD SHORT FROM RESISTANCE
Hello, Friends!
It makes sense for us to go short on USD/CAD right now from the resistance line above with the target of 1.376 because of the confluence of the two strong factors which are the general downtrend on the previous 1W candle and the overbought situation on the lower TF determined by it’s proximity to the upper BB band.
Disclosure: I am part of Trade Nation's Influencer program and receive a monthly fee for using their TradingView charts in my analysis.
✅LIKE AND COMMENT MY IDEAS✅

USD/ CAD Are We Heading to $1.46 Territory Watch OUT Afternoon Trading Family
Based on what we are seeing is a nice bullish run up to the following levels :
Levels To Watch For:
1) $1.39
2) $1.41
3) $1.43
4) $1.46
However be aware if we for whatever reason we sink back into the 1.35 territory then we could see a drop down to 1.34
Trade Smarter Live Better
Kris

USD/CAD Ascending Triangle BreakoutUSD/CAD was hit hard during the Q2 sell-off in the USD. And with the almost decade long range still in-play for the pair, with the reversal around 1.4500 in February, that makes sense.
The problem quickly became sentiment as sellers jumped on the move so aggressively, and since mid-June bears have had trouble breaking down to any fresh lows.
We can even see an element of this from May, when prices found support at 1.3750 and sellers were suddenly stalled despite a clear downside trend.
This is a great illustration of why sentiment is so important - if anyone that wants to sell or that can sell the pair already has - even the worst news in the world would have trouble pushing fresh lows. Because if there's no supply coming into the market and there's more demand, well, then prices will go up just given basic supply/demand dynamics. And with a heavy built in short position following a clean downside trend, there will be some sellers looking to take profit which is what generates the start of that demand. And then more shorts will be motivated to take profit as they see price rising even with negative news flow, when prices should be falling.
This can continue all the way until we get to a point that is attractive again to draw fresh sellers into the market and in USD/CAD, that was the 1.4000 handle that held a clean show of resistance in mid-May, and that ushered in another wave of selling. But in mid-June, as price got close to the 1.3500 handle, a similar type of thing started to happen as sellers began to shy away from chasing the move.
Initially that allowed for pullback to that same 1.3750 level that was support in May. Sellers took another shot and even as the USD was setting fresh three-year-lows on the first day of Q3, USD/CAD was setting a higher-low above the prior swing. The trendline produced from those two lows came into play just last week - and when combined with the 1.3750 level made for a textbook ascending triangle formation.
Those setups are often tracked with aim of bullish breakout as it's essentially showing a line in the sand that sellers have defended, in this case at 1.3750; but there's a diminishing impact of that resistance as shown from the increasingly higher-lows. The thought is that, eventually, sellers will give way to the buyers that have been defending higher-lows and that will lead to a breakout and fresh highs.
This is what's taking place now in USD/CAD.
This doesn't necessarily mean that bears are done for, as the big question here is the same from back in May, whether we get to a resistance level that's appealing enough to draw fresh shorts into the market. From the chart attached, I've outlined three areas of interest for such, with 1.3900 nearby and 1.4000 above that. If we do see a prolonged push of USD-strength, there's a zone of support-turned-resistance around 1.4151-1.4178 that becomes of interest for bigger-picture scenarios. - js

USDCAD Bullish Breakout!
HI,Traders !
#USDCAD was trading in a
Falling wedge pattern
But now we are seeing a
Bullish breakout so we
Will be expecting a
Further bullish move up !
Comment and subscribe to help us grow !

USDCAD short move
Price is currently at a support level and if there should be a break then i will be expecting more downward movement in price.

USDCAD ~ Real Time Elliott Wave UpdatesThis is an update of a USDCAD chart I had previously posted. Wave 1(Red) completed and a Wave 2(Red) or Wave A(Grey) has a lso completed. This wave has two readings at the moment because it could be a completed Zigzag or the first Wave of a Flat formation. I will provide updates soon. Analysis remains the same as my previous post and can be used for references. Sentiment still remains buy.

usdcad long Fundamental and candle stick , market structure
up to 1.39750
possible moving
swing long idea for 2 months


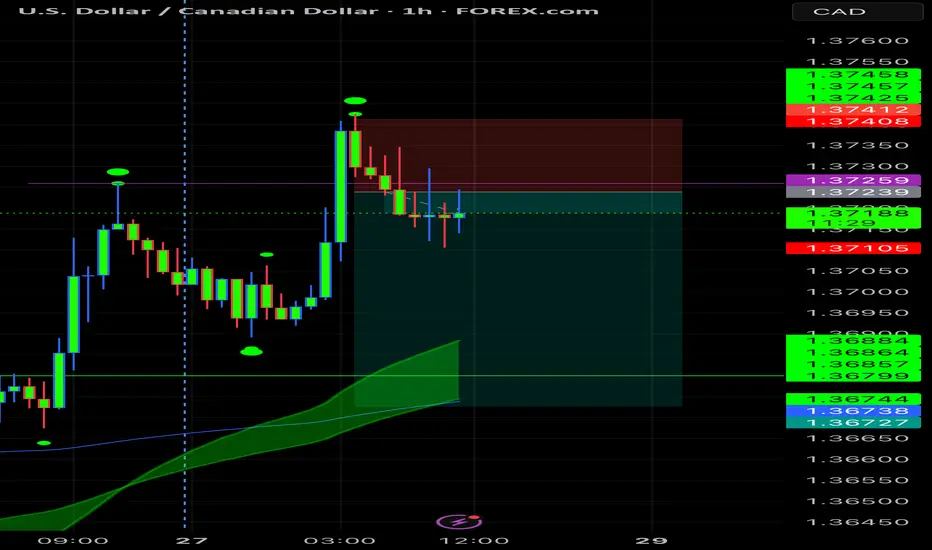
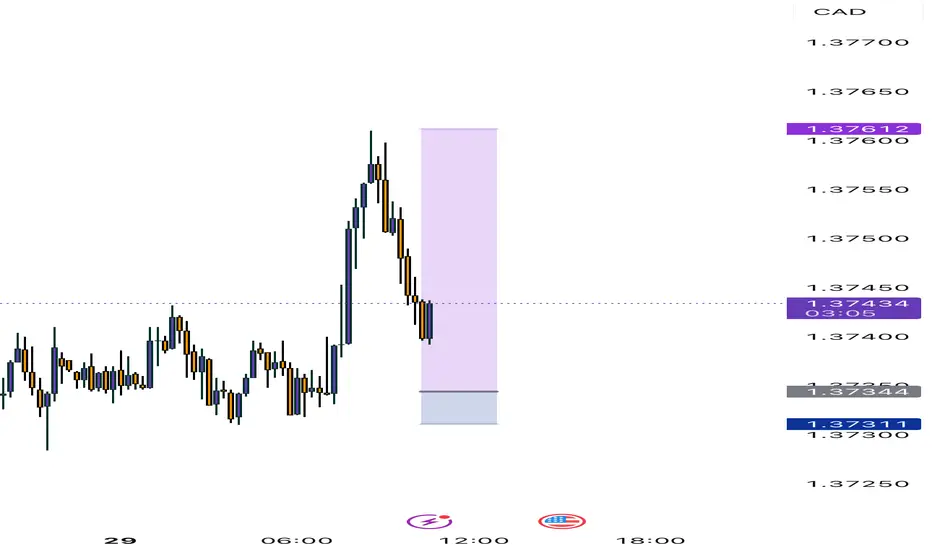
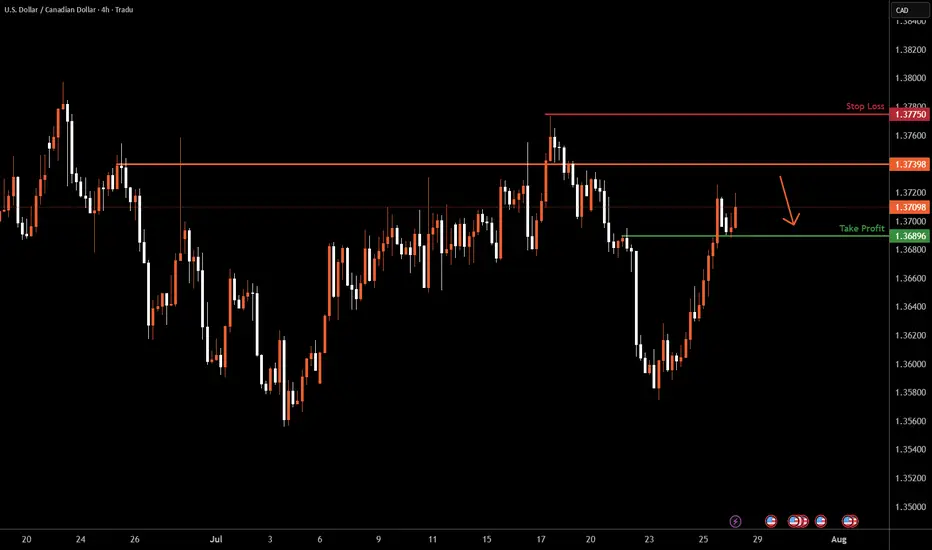
USDCAD H4 I Bearish Reversal OffBased on the H4 chart analysis, we can see that the price is rising toward our sell entry at 1.3739, which is a pullback resistance.
Our take profit will be at 1.3689, an overlap support level.
The stop loss will be placed at 1.3775, the swing-high resistance level.
High Risk Investment Warning
Trading Forex/CFDs on margin carries a high level of risk and may not be suitable for all investors. Leverage can work against you.
Stratos Markets Limited (tradu.com ):
CFDs are complex instruments and come with a high risk of losing money rapidly due to leverage. 66% of retail investor accounts lose money when trading CFDs with this provider. You should consider whether you understand how CFDs work and whether you can afford to take the high risk of losing your money.
Stratos Europe Ltd (tradu.com ):
CFDs are complex instruments and come with a high risk of losing money rapidly due to leverage. 66% of retail investor accounts lose money when trading CFDs with this provider. You should consider whether you understand how CFDs work and whether you can afford to take the high risk of losing your money.
Stratos Global LLC (tradu.com ):
Losses can exceed deposits.
Please be advised that the information presented on TradingView is provided to Tradu (‘Company’, ‘we’) by a third-party provider (‘TFA Global Pte Ltd’). Please be reminded that you are solely responsible for the trading decisions on your account. There is a very high degree of risk involved in trading. Any information and/or content is intended entirely for research, educational and informational purposes only and does not constitute investment or consultation advice or investment strategy. The information is not tailored to the investment needs of any specific person and therefore does not involve a consideration of any of the investment objectives, financial situation or needs of any viewer that may receive it. Kindly also note that past performance is not a reliable indicator of future results. Actual results may differ materially from those anticipated in forward-looking or past performance statements. We assume no liability as to the accuracy or completeness of any of the information and/or content provided herein and the Company cannot be held responsible for any omission, mistake nor for any loss or damage including without limitation to any loss of profit which may arise from reliance on any information supplied by TFA Global Pte Ltd.
The speaker(s) is neither an employee, agent nor representative of Tradu and is therefore acting independently. The opinions given are their own, constitute general market commentary, and do not constitute the opinion or advice of Tradu or any form of personal or investment advice. Tradu neither endorses nor guarantees offerings of third-party speakers, nor is Tradu responsible for the content, veracity or opinions of third-party speakers, presenters or participants.
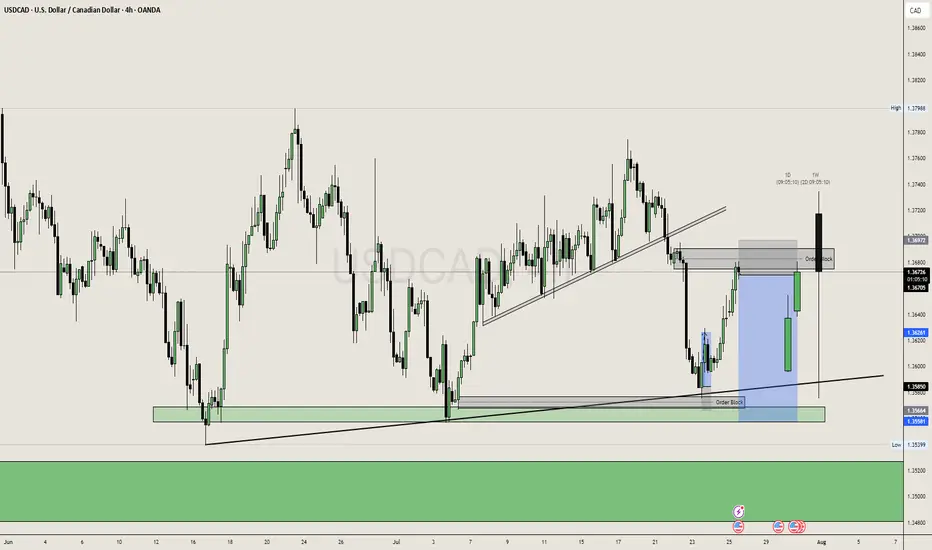
USDCAD Sell Move PossibleAs USDCAD is in Downtrend, we can expect a sell side move from this OB in NY Session towards low SSL.
Friday Closing also coming near so plan trade accordingly.
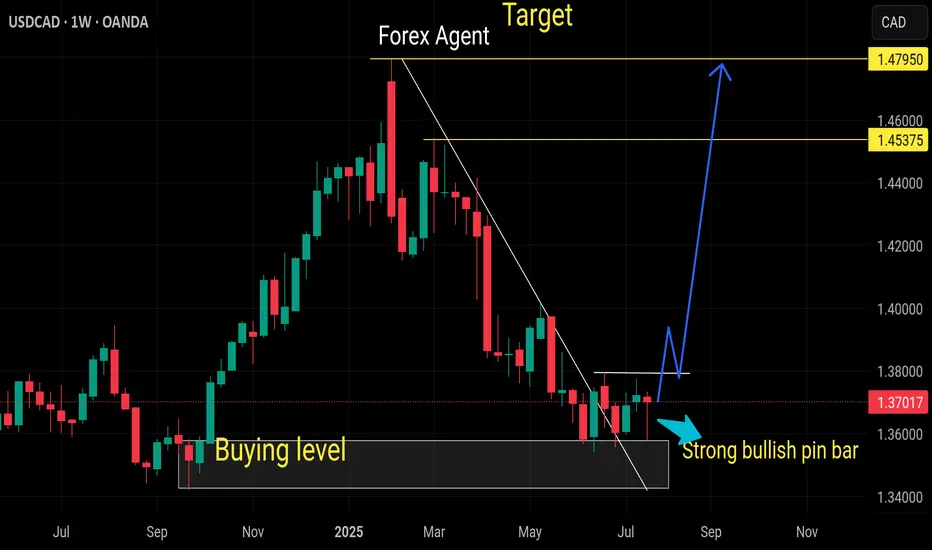
Buy usdcadStrong buyers coming now
Weekly pin rejection
Monthly oversold pair
Daily trend already breaks
TRIPPLE BUTTON REVERSAL PATTERN ON USDCAD USDCAD look promising for a buy as we saw a triple button reversal pattern formation which successfully broke the neckline and currently retesting it. A buy opportunity is expected this coming week.
USD/CAD Bullish Bias Supported by COT Data and Seasonal Trends🗓 Monthly Chart Overview
• Price Inefficiency Zone: There's a clear imbalance between 1.40165 and 1.41248, suggesting a potential magnet for price. A retracement to at least the 50% level of this inefficiency could be expected.
• Bullish Structure: Price has formed a bullish order block and is currently retracing, which often precedes a continuation move upward.
• This setup hints at accumulation before a bullish expansion.
📆 Weekly Chart Insights
• Inefficiency Filled: Price has filled previous inefficiencies, showing healthy market structure.
• Liquidity Behavior: We've seen price sweep lows, then begin sweeping highs, while respecting bullish blocks—a strong indication of a shift in directional intent.
• This behavior supports the idea that USD/CAD is preparing for a bullish continuation.
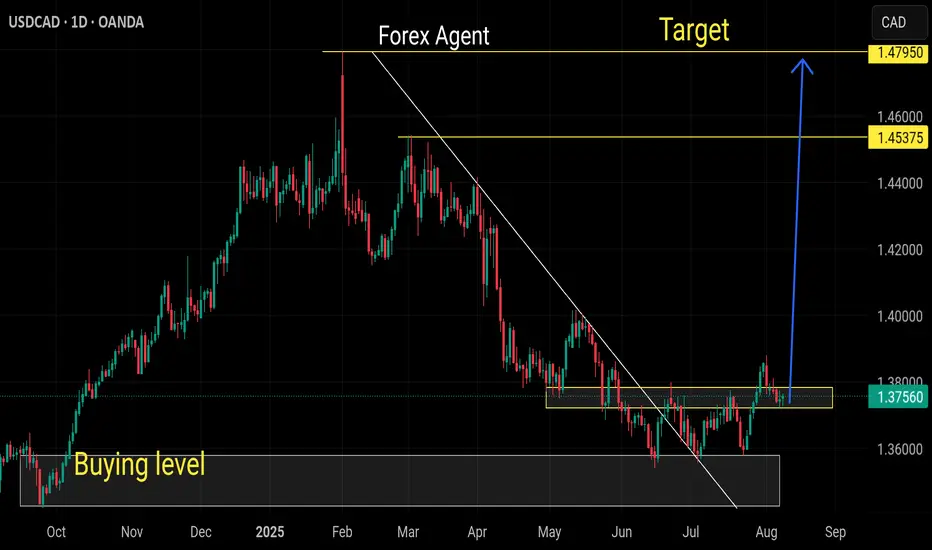
📅 Daily Chart Momentum
• Aggressive Breakout: After a period of consolidation, price broke out aggressively to the upside, confirming bullish momentum.
• Structure: The daily chart maintains a bullish structure, reinforcing the higher timeframe bias.
💹 Commitment of Traders (COT) Data
• USD Positioning: The U.S. Dollar is showing net buying interest, supporting strength.
• CAD Positioning: The Canadian Dollar is net bearish on average when compared to last year’s data.
• This divergence in sentiment adds confluence to a bullish USD/CAD bias.
📊 Seasonal Trends
• Historically, USD/CAD tends to rise from August through November, with September, October, and especially November being the most bullish months.
• This seasonal tendency aligns with the current technical and fundamental setup.
🏦 Macro Considerations
• Interest Rates: Keep a close eye on central bank rate decisions and forward guidance, as they can significantly impact USD/CAD volatility and direction.
🔍 Summary
USD/CAD shows strong bullish potential across monthly, weekly, and daily timeframes. Technical structure, COT data, and seasonal trends all point toward a continuation to the upside. A revisit to the inefficiency zone around 1.4060–1.4120 could be a key target in the coming months.

USD/CADLooking for a bullish breakout here
Been in a downtrend for a while now and looking for a bullish breakout
Already rejected and showed a higher low on the retest and aiming for local high
USD strong after some positive SEC replacement news to add strength
I also have another trade shorting EUR/USD if you want to check that out!
Lets see how we go!

USDCAD BEARISH ZONE COMESUP Current Technical Landscape
Market Sentiment & Drivers
The USD/CAD has risen modestly following Canada’s weak jobs data showing a −40.8 k drop in employment, raising expectations of dovish Bank of Canada policy and fueling a weaker Loonie.
Meanwhile, signals of a more dovish Fed—especially after Trump’s appointed governor tone—have added further downward pressure on the USD.
Key Levels & Technical Indicators
ActionForex (Intraday):
4H MACD has crossed above its signal, neutralizing bias for now.
Break below 1.3720 could target a deeper fall back to 1.3538 — the recent corrective low.
Break above 1.3809 would invalidate that bearish view and suggest a retest of 1.3878.
ActionForex (Weekly):
The pair hovered around 1.3720 last week with a neutral weekly bias.
A downside break could confirm continuation of the corrective decline toward 1.3538.
A bullish breakout beyond 1.3809 could lead to a retest of 1.3878 and possibly higher.
StockTA (as of July 28):
Overall sentiment remains bearish (score: −0.26), particularly in the short-term (−0.48).
Key resistance cluster around 1.47 to 1.45, with multiple levels noted between 1.47 and 1.37.
Support appears near 1.36, based on their analysis.
Marketscreener (latest in July):
Short-term trend: Neutral; Mid-term trend: Bearish; Long-term trend: Neutral.
Short-term resistance: 1.3733, support: 1.3571.
Mid-term resistance: 1.3978, support: 1.3571.
Long-term resistance: 1.4524, support: 1.3490.
Interpretation: Bearish Zone “Coming Up”
The phrase “bearish zone comes up” likely refers to the pair approaching a key resistance area where bearish reversal pressure is increasing. Currently:
1.3720–1.3809 is a critical near-term range. A failure to break above 1.3809 may invite renewed downside toward 1.3538.
Medium-term resistance clusters between 1.37 and 1.40 are also zones where bearish setups may form.
Broader resistance around 1.45–1.47 remains the major structural ceiling, although this lies further out unless the bias shifts.
Strategy Considerations
Bearish setup: Wait for rejection near 1.38, ideally with confirmation (e.g. bearish candle, MACD crossover). A break below 1.3720 could accelerate retest of 1.3538.
Bullish invalidation: A sustained move above 1.3809 could negate the immediate bearish bias, opening targets back toward 1.3878 and beyond.
USD-CAD Resistance Ahead! Sell!
Hello,Traders!
USD-CAD went up and will
Soon hit a horizontal resistance
Of 1.3774 from where
We will be expecting a
Local bearish pullback
Sell!
Comment and subscribe to help us grow!
Check out other forecasts below too!
Disclosure: I am part of Trade Nation's Influencer program and receive a monthly fee for using their TradingView charts in my analysis.
