USD-CAD Resistance Ahead! Sell!
Hello,Traders!
USD-CAD went up and will
Soon hit a horizontal resistance
Of 1.3774 from where
We will be expecting a
Local bearish pullback
Sell!
Comment and subscribe to help us grow!
Check out other forecasts below too!
Disclosure: I am part of Trade Nation's Influencer program and receive a monthly fee for using their TradingView charts in my analysis.
CADUSD trade ideas


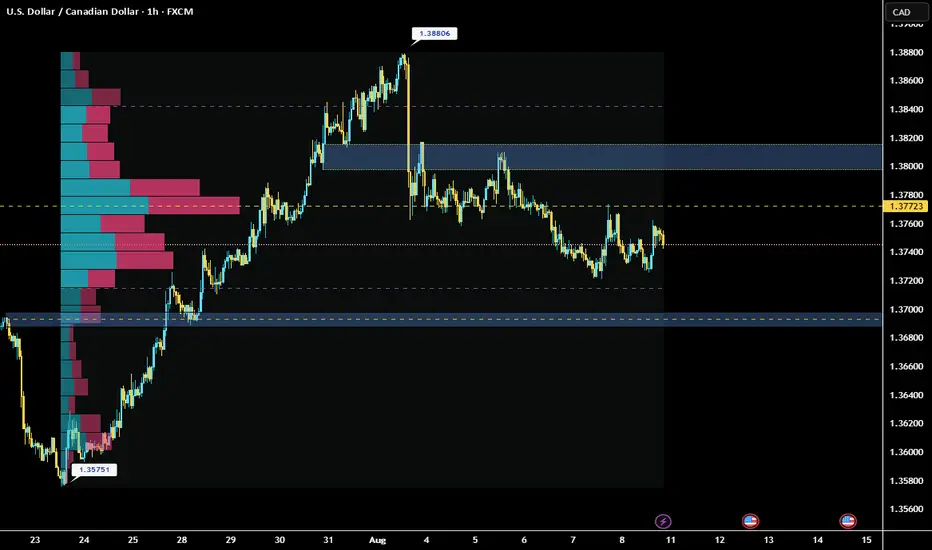
sentiment to the downward trend 1-hour analysis FX:USDCAD
The price has corrected towards 1.37723 after falling within the trading volume range. At first glance, the price may fall towards the target of 1.36726.
New selling level 1.37723
What do you think, friends?
Buy Market has created a support on the daily time frame and has created a double bottom chart pattern on the 4hrs time frame, buying at a phycological level of 1.37500 , sl @1.37055 and tp @1.39272

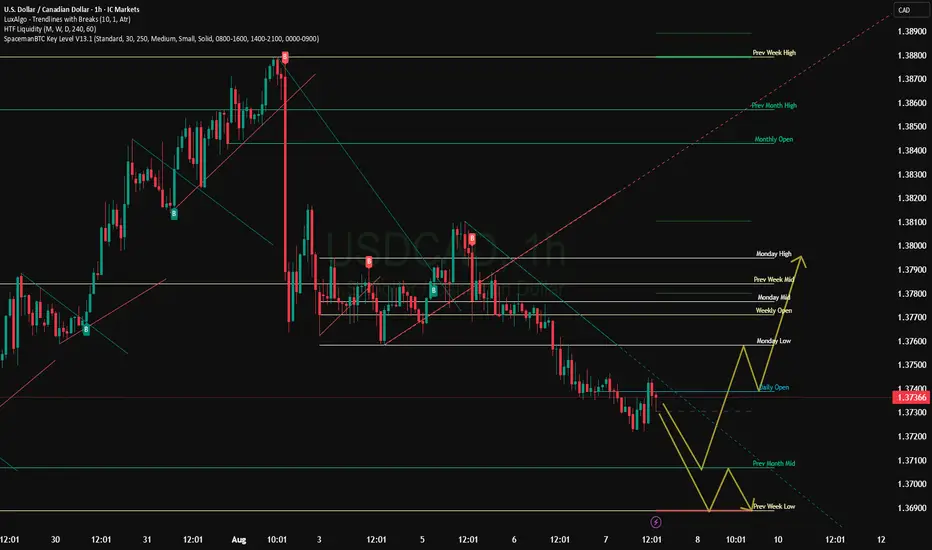
USDCAD(20250808)Today's AnalysisMarket News:
① Trump nominated Stephen Milan, Chairman of the White House Council of Economic Advisers, to serve on the Federal Reserve Board, with a term ending January 31, 2026.
② Waller is reportedly a leading candidate for the next Fed Chair.
③ U.S. Treasury Secretary Bensont stated that the interview process for the Fed Chair has begun.
④ Bostic stated that the July jobs report did change the Fed's outlook on its employment goals.
Technical Analysis:
Today's Buy/Sell Levels:
1.3746
Support and Resistance Levels:
1.3798
1.3778
1.3766
1.3726
1.3713
1.3694
Trading Strategy:
If the price breaks above 1.3746, consider a buy entry, with the first target price being 1.3766. If the price breaks below 1.3726, consider a sell entry, with the first target price being 1.3713.

USDCAD BULLISH Technically:
Printing HH and HL
Bullish divergence
Resistance became support
Fib Retacment 0.5
Respecting Trendline support


USD/CAD – Watchlist UpdateWe were watching USD/CAD for a possible pullback and long setup earlier this week. While we did get an engulfing candle, momentum was not strong enough to justify a trade — especially considering the subpar support/resistance zone.
Now, the market appears to be shifting direction, possibly forming a pullback into a stronger resistance zone that could set up a downtrend continuation.
We’ll continue to wait and watch with patience, only considering this a valid opportunity if all components of the VMS strategy align.
📌 Let the setup come to you. No alignment, no trade.

USDCAD - Big Picture and MomentumBig Picture and Momentum
USD/CAD is trading comfortably above the 50-day EMA (~1.3728) and above the 9-day EMA, indicating continued bullish momentum. The 14-day RSI is above the 50 level, confirming the positive market sentiment.
Key Support and Resistance
Resistance: 1.3770–1.3798 range is the current target, a break of which could open the way to the January high around 1.4016.
Support:
50-day EMA (~1.3728) is the first line of defense.
Next is the 9-day EMA (~1.3679).
A further weakening could see a decline to 1.3560, and a strong correction could see a decline to the February 2024 lows (~1.3420).
Market Behavior Scenarios
Bullish scenario: holding above EMA with RSI > 50 creates good conditions for a move up to 1.3770-1.3800, and then to 1.4016, with increasing momentum.
Bearish scenario: falling below EMA, especially below 1.3679, can lead to a deeper decline - to 1.3560 and then to 1.3420.
Recommendations for traders
Long position: can be considered for entry when holding above 1.3728, with a target of 1.3770-1.3800, and a stop just below the EMA.
Short position: justified when falling below 1.3728-1.3679, with a target of 1.3560, and a stop just above the EMA level.
USDCAD going for a lower lowIf we patiently look at USDCAD we will notice that theres still some bearish momentum its goin to take some time before it will go up but make sure you aet your Sls right

USDCAD Sell Setup – Watching for Rejection at 1.37679Looking to enter short if price retests the 1.37679 level. Waiting for confirmation of resistance holding before executing the trade. Targeting downside continuation if the level holds.

Strong bearish sentiment For the longest time USDCAD has been bullish, not that we broke and retested the trendline. I see a continuation down to
.35000

USDCAD support at 1.3730The USDCAD remains in a bullish trend, with recent price action showing signs of a corrective pullback within the broader uptrend.
Support Zone: 1.3730 – a key level from previous consolidation. Price is currently testing or approaching this level.
A bullish rebound from 1.3730 would confirm ongoing upside momentum, with potential targets at:
1.3830 – initial resistance
1.3860 – psychological and structural level
1.3890 – extended resistance on the longer-term chart
Bearish Scenario:
A confirmed break and daily close below 1.3730 would weaken the bullish outlook and suggest deeper downside risk toward:
1.3716 – minor support
1.3690 – stronger support and potential demand zone
Outlook:
Bullish bias remains intact while the WTI Crude holds above 1.3730. A sustained break below this level could shift momentum to the downside in the short term.
This communication is for informational purposes only and should not be viewed as any form of recommendation as to a particular course of action or as investment advice. It is not intended as an offer or solicitation for the purchase or sale of any financial instrument or as an official confirmation of any transaction. Opinions, estimates and assumptions expressed herein are made as of the date of this communication and are subject to change without notice. This communication has been prepared based upon information, including market prices, data and other information, believed to be reliable; however, Trade Nation does not warrant its completeness or accuracy. All market prices and market data contained in or attached to this communication are indicative and subject to change without notice.

USDCAD (sell)USDCAD has broken a previous bullish trendline (green line) and started to fall.
My entry idea is to wait for a pullback and a bounce of the 61% fib level before heading back down to the previous low.
for added confluence you can wait for an overbought level on the stochastic oscillator indicator once it reaches the 61% fib level

USDCAD SELL OPPORTUNITY Price just formed and broke the symmetrical triangle pattern which is a sign of bearish continuation from the pullback resistance of 1.38550 therefore, a sell opportunity is envisaged from the current market price. Target price is 1.36918

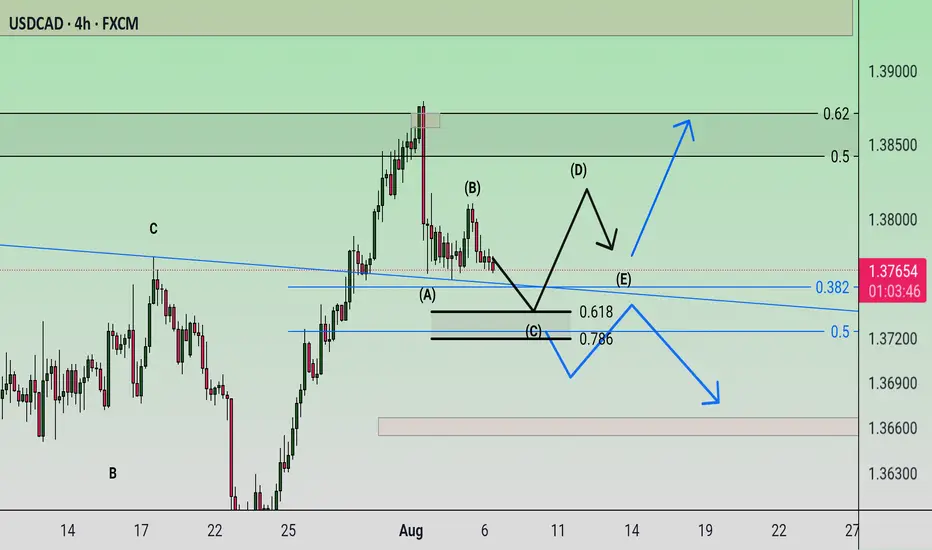
Triangle The triangle pattern is expected to move in the specified direction. Then, with the completion of the corrective pattern, the start of an uptrend is likely. If the price breaks through the specified support area, a continuation of the downtrend is likely.
USD/CAD(20250806)Today's AnalysisMarket News:
The US non-manufacturing PMI fell to 50.1 in July from 50.8 in June, below the expected 51.5. The ISM New Orders Index fell to 50.3 in July from 51.3 in June, with export orders contracting for the fourth time in five months.
Technical Analysis:
Today's Buy/Sell Levels:
1.3781
Support and Resistance Levels:
1.3828
1.3810
1.3799
1.3763
1.3751
1.3734
Trading Strategy:
On a breakout above 1.3781, consider a buy entry, with the first target at 1.3799. On a breakout above 1.3763, consider a sell entry, with the first target at 1.3751.

USD CAD Where Are We Heading DEEP ANALYSIS Hi Trading Fam
So with USD CAD this is what we are seeing:
Bearish:
If we stay under 1.38 then a drop down to the 1.37 range
Bullish:
If we can close above the high at 1.38 then we have levels of 1.3840 , and 1.3980 that could be hit
Trade Smarter Live Better
Kris


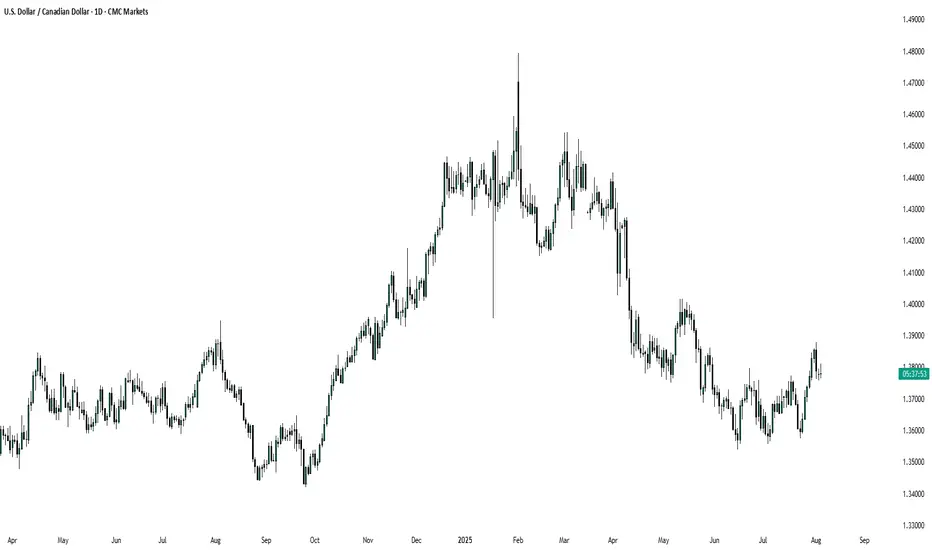
USD Could Gain Further Against CAD Despite Weak Jobs ReportThe weaker-than-expected US jobs report on 1 August, along with significant downward revisions, sent shockwaves through the market, and the US dollar was not spared. The stronger upward momentum observed over the past couple of weeks seemed to vanish almost instantly. Although the USDCAD has recently moved lower, it still maintains strong bullish momentum, indicating a potential move back toward higher levels.
The USDCAD formed a rather convincing triple-bottom pattern in June and even moved above a long-term downtrend. Additionally, the currency pair rose above the neckline of the triple bottom at 1.376, which now serves as a support level. Momentum, as measured by the Relative Strength Index, has turned upward and suggests that the USDCAD could move higher.
To further reinforce the bullish trend, the USDCAD remains above its 10-day exponential moving average. Therefore, while the prevailing market sentiment might lead one to believe the dollar will weaken, technical indicators suggest that the Canadian dollar will continue to weaken against the US dollar if support and the moving average around 1.37 hold. A break below this support area would indicate a trend reversal, potentially causing the USDCAD to fall back to lows around 1.358.
However, if the bullish trend persists and the USDCAD manages to hold above support at 1.37, the currency pair could head higher towards 1.397, retesting a resistance level established in mid-May.
Written by Michael J. Kramer, founder of Mott Capital Management.
Disclaimer: CMC Markets is an execution-only service provider. The material (whether or not it states any opinions) is for general information purposes only and does not take into account your personal circumstances or objectives. Nothing in this material is (or should be considered to be) financial, investment or other advice on which reliance should be placed.
No opinion given in the material constitutes a recommendation by CMC Markets or the author that any particular investment, security, transaction, or investment strategy is suitable for any specific person. The material has not been prepared in accordance with legal requirements designed to promote the independence of investment research. Although we are not specifically prevented from dealing before providing this material, we do not seek to take advantage of the material prior to its dissemination.
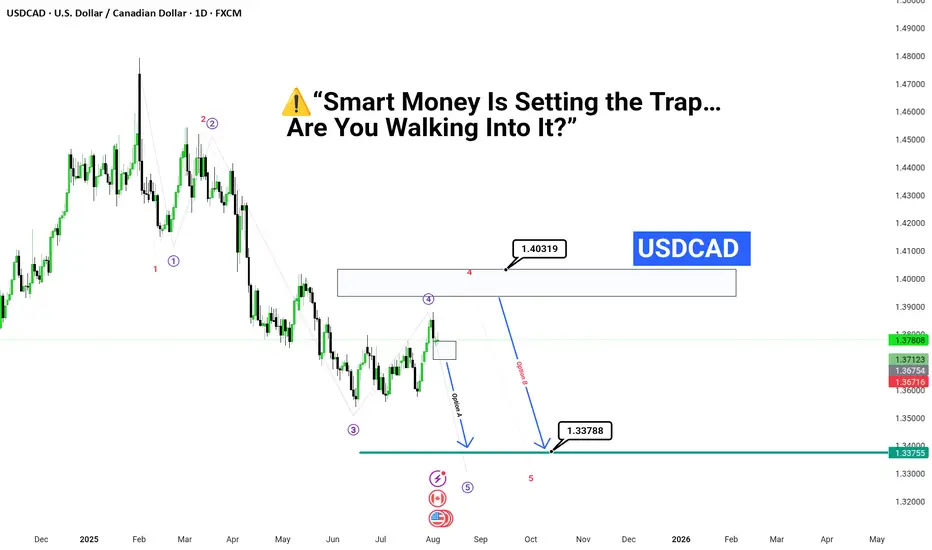
Smart Money Is Setting the Trap… Are You Walking Into It?”“💥USDCAD About to Explode — Final Wave Is Loading.
📉 If You Miss This Entry, You’ll Chase the Exit.
🧠 Wave 5 ≠ Just Another Move
It’s the final shot before the reversal storm.
✅ All signs point to liquidity being hunted
📍Stay sharp. 1.403 may be the bull trap of the year.
🎯 Make no mistake — the market is not random,
it’s engineered to fake you out before the real drop.
---
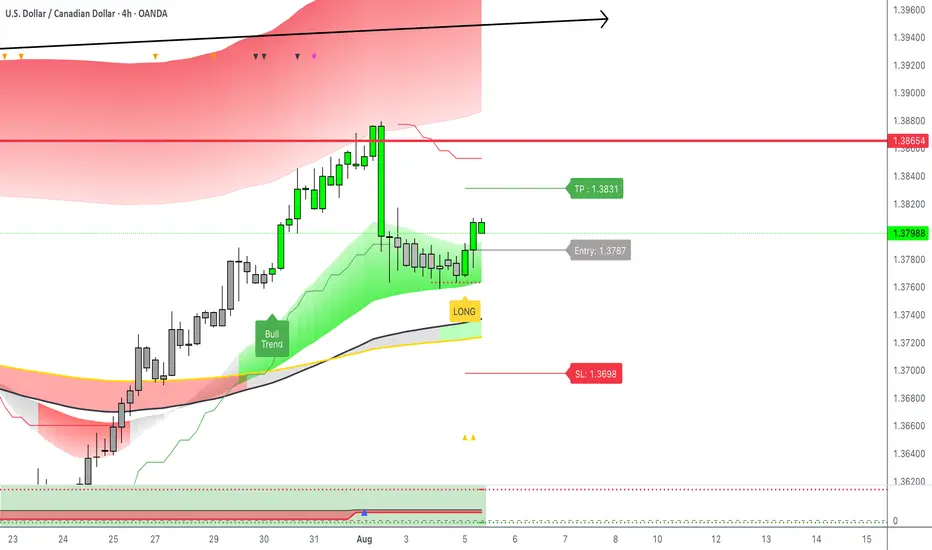
USDCAD: Long entry trigger on 4HGood morning everyone,
today I am sharing a Long signal received now via alert from the LuBot Ultimate indicator.
I will enter on correction (around 50% of the trigger candle).
TP slightly higher than suggested at 1.1850 e
SL on the suggested level.
The signal is confirmed by the positive structure (green candles) just started on the 4H and a bullish trend confirmed by the signal a few candles back.
The predictum also shows a rising signal, thus predicting a positive situation for the current month.
👍 If you want to see other similar posts, like/boost
🙋♂️ Remember to follow me so you don't miss my future analyses
⚠️ Disclaimer: This post is for informational purposes only and does not constitute financial advice. Always do your research before making investment decisions.
Watching Retracement Levels for Potential USDCAD Entry📈 The USDCAD remains firmly in a bullish trend following a sharp pullback on the 4-hour timeframe. Price continues to print higher highs and higher lows, showing sustained upward momentum. I’m watching for a retracement back into equilibrium of the previous price swing — if price dips and then breaks structure to the upside, I’ll be eyeing a potential long entry 🔍📊 (not financial advice).
