CAKE : Like a delicious cakeHello friends
Given the entry of buyers and the creation of higher price floors and ceilings, now in the price pullback in the support areas marked with Fibonacci, there are points that can grow the price to the specified limits and in these areas I buy.
*Trade safely with us*
Market insights

do you think will happen?First, the price must break the resistance, then we can make sure that the chart is bullish...

Pancake Swap (CAKE): End of Channel | Looking For BreakoutCAKE is holding its structure well, moving inside the ascending channel with buyers keeping control. At the moment, price is sitting close to support and we are waiting for a proper bounce confirmation.
The main thing here is the breakout. As soon as buyers secure the local resistance, the path is open for continuation to higher levels. The major resistance zone is sitting around $4.20–$4.50, which remains our main target for this move.
Swallow Academy

Is #CAKE About to Crumble? Breakdown Alert Below Key SupportYello Paradisers! Are you watching what’s unfolding on #CAKEUSDT? Because if you’re not, you might get into a trap. Let’s break down #PanCakeSwap setup:
💎#CAKE has been respecting a clean ascending channel since mid-June, riding between dynamic support and resistance levels. However, after multiple rejections from the resistance zone near $3.00–$3.20, momentum has started to fade. The structure is now showing early signs of potential reversal.
💎A clear breakout below the ascending support has just taken place, and this opens the door to a potential bearish leg—especially if we get a successful retest of that broken support, which would now act as resistance. This is a crucial signal that smart traders are watching.
💎The bearish setup invalidation sits above $3.09. Only a clean breakout and hold above this level would invalidate the short bias and reintroduce the potential for a bullish expansion. Until then, the market structure remains vulnerable.
💎Currently trading around $2.63, #CAKEUSD is eyeing the $2.33 support zone. If this level fails to hold, we expect a deeper move toward the strong demand zone at $1.79, which also aligns with key high-volume nodes on the VRVP—making it a magnet for smart money accumulation.
Trade smart, Paradisers. This setup will reward only the disciplined.
MyCryptoParadise
iFeel the success🌴

PancakeSwap (CAKE) Price target Price
46 ┤ 🎯 Long-term Target 46
40 ┤
35 ┤
30 ┤
25 ┤ ⚡ Strong Resistance Zone
20 ┤
15 ┤
10 ┤
7.50 ┤
6.50 ┤
5.50 ┤
4.50 ┤
3.50 ┤
2.87 ┤ 🎯 Short-term Target 2.87
2.70 ┤━━━━━━ 🔹 Support / Floor 2.70
2.50 ┤
2.30 ┤
Key Levels & Analysis
Level (USD) Description
2.70 Strong support, accumulation zone
2.87 Short-term target, consider taking partial profits
3.50–7.50 Medium-term resistance, monitor breakout volume
10–25 Long-term bullish zone, major investors may enter
30–40 Strong resistance, trend confirmation needed
46 Long-term target, high reward but high risk
---
🔹 Strategy Notes
1. Short-term: Entry near 2.70, target 2.87, stop-loss below 2.65.
2. Mid-term: Track 3.50–7.50, scale positions based on trend strength.
3. Long-term: Aim for 46 USD gradually, stagger positions to manage risk.
4. Indicators: RSI, EMA9/21, VWAP, trading volume for trend validation.

Pancake Coin (CAKE): Good Buy Opportunity | Going for BOSCAKE looks good for upside movement here, with the price pushing for that BOS on smaller timeframes currently.
More in-depth info is in the video—enjoy!
Swallow Academy


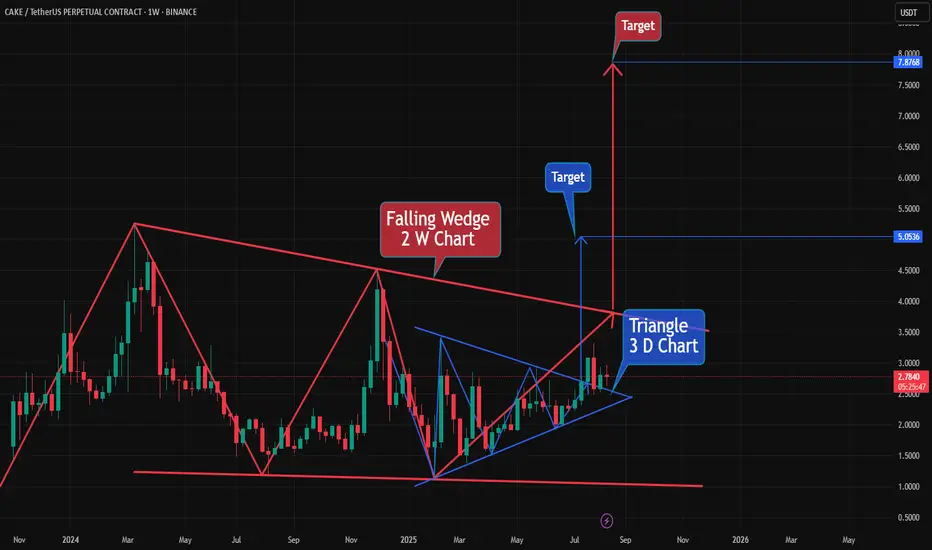
#CAKE Coin has formed a Triangle Pattern on the 3D chart💰 #CAKE Coin has formed a Triangle Pattern on the 3D chart. However, since there has been no liquidation, we can expect a price drop from the
current level to liquidate it. However, the price may increase to $5.. 🔽🔼
👀 Also, a Falling Wedge pattern is forming on the 2W chart, and if the price rises to $5 on the 3D chart, the falling wedge pattern formed on the 2W could breakout and the price could rise to $7.8 & $ 23🔼
💵 Tp 1 : $ 3.15
💵 Tp 2 : $ 3.62
💵 Tp 3 : $ 4.30
💵 Tp 4 : $ 5.02
💵 Tp 5 : $ 7.87
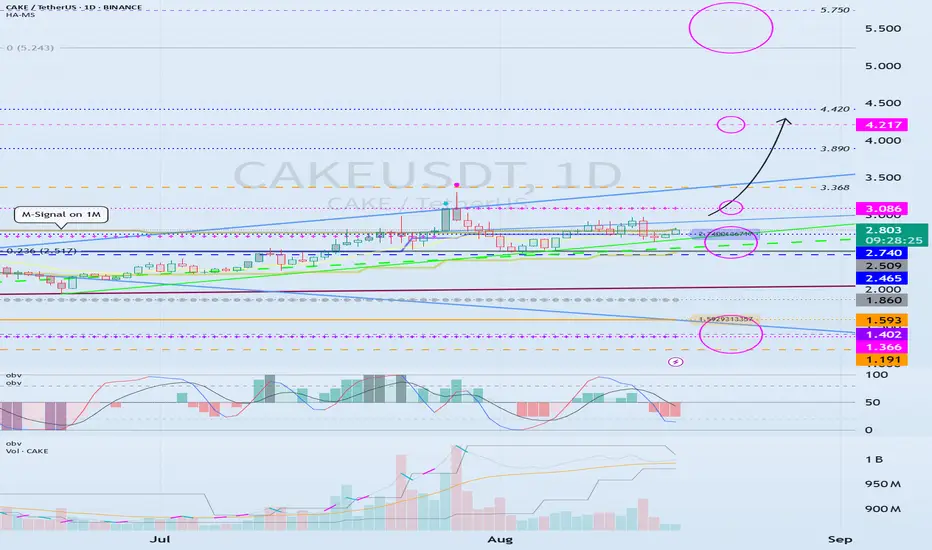
The key is whether it can rise above 3.086
Hello, fellow traders.
Follow us to get the latest information quickly.
Have a great day.
-------------------------------------
(CAKEUSDT 1W chart)
For the uptrend to begin, the price must rise above 5.750 and hold.
-
(1D Chart)
The key is whether the price can maintain support around 2.465-2.740 and rise above 3.086.
If the price holds above 3.086, a stepwise upward trend is highly likely.
At this point, the key point to watch is whether it can rise above 4.217.
If it finds support around 2.465-2.740 and rises, a medium- to long-term uptrend is likely, so you can develop a trading strategy based on this.
-
If it falls below 2.465, it could fall below 1.860, so you should stop trading and wait and see how things go.
The strong support area is 1.191-1.593, so if it finds support around this area, it would be a good time to buy.
-
Thank you for reading.
I wish you successful trading.
--------------------------------------------------
- Here's an explanation of the big picture.
(3-year bull market, 1-year bear market pattern)
I'll explain more in detail when the bear market begins.
------------------------------------------------------
CAKEUSDT.P : Small Long and Short OpportunityThere is 2 Opportunities for a Long and Short on Cake, Dont miss it. free Profit waiting :)

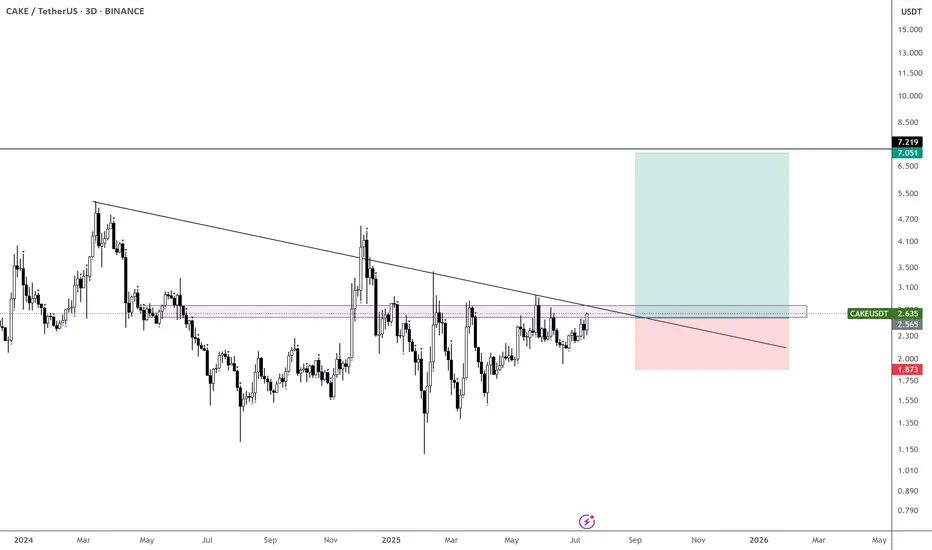
CAKE/USDT Weekly — Time to Break the Multi-Year Downtrend Curse?Full Analysis
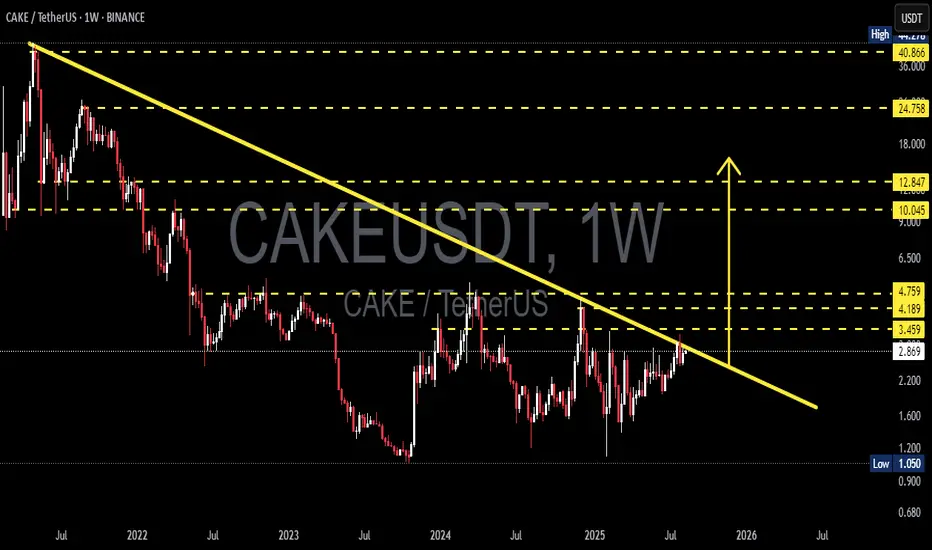
CAKE/USDT is now at one of the most critical points since the 2021 bear market began. Price is currently around $2.87, touching the multi-year downtrend line that has acted as a ceiling for more than three years.
From the chart, we can see:
📉 Downtrend Line: Originating from the 2021 all-time high, connecting multiple lower highs. It’s a major resistance that has never been broken since the decline started.
📊 Layered Resistance Zones: $3.46 → $4.19 → $4.76, followed by major resistances at $10.04 and $12.85.
📈 Strong Support Zones: $2.20 (minor support), $1.60, and the historical low at $1.05.
⏳ Consolidation Range: Since 2023, price has mostly moved sideways — potentially signaling quiet accumulation before a major move.
---
Pattern & Context
The current market structure shows:
1. Compression / Pressure Convergence: Downtrend line meets strong horizontal support → often a trigger for either a breakout or a sharp rejection.
2. Potential Breakout Setup: A weekly close above the trendline + key level $3.45–$3.50 could mark the start of a bullish reversal.
3. Bearish Continuation Risk: Failure to break out and a rejection from this zone could resume the long-term downtrend channel toward previous lows.
---
Bullish Scenario 🟢
Trigger: Weekly close above $3.50 + strong breakout volume.
Target 1: $4.19 → psychological and horizontal resistance.
Target 2: $4.76 → a historical supply zone.
Mid-term Target: $10.04 → a key historical resistance; breaking it could open the way to $12.85 and even $24.76 (in case of a strong market-wide bullish cycle).
Extra Confirmation: RSI > 55–60, MACD bullish cross on the weekly timeframe.
---
Bearish Scenario 🔴
Trigger: Rejection at the trendline + weekly close below $2.70.
Target 1: $2.20 → intra-range support.
Target 2: $1.60 → previous major support from 2022–2023.
Final Target: $1.05 → historical low, possible liquidity grab in a panic sell.
Extra Confirmation: Long upper wicks, increasing selling volume, RSI failing to cross above 50.
---
Strategy & Risk Management
Breakout Traders: Wait for a confirmed weekly close above $3.50 before entering, with stops below the swing low or trendline.
Rejection Traders: Look for false breakout signals at the trendline to short with targets at lower supports.
Position Sizing: Risk only 1–3% per trade.
Multi-TF Confirmation: Check daily and 4H charts to validate breakout/rejection setups.
---
Conclusion
📍 CAKE is at a make-or-break point — will this be the start of a major trend reversal or a continuation of the long-standing downtrend? Medium- and long-term traders should closely watch the weekly close this week.
🚨 A breakout here could reshape the entire trend map — but beware of potential fakeouts that are common at such key moments.
---
> CAKE/USDT is testing a multi-year downtrend line after 3 years of pressure. A weekly close above $3.50 could open the path to $4.19–$4.76, and even $10+. A rejection here risks a drop to $2.20 or $1.05. This could be the start of a major trend change — or the biggest trap of the year.
#CAKEUSDT #PancakeSwap #CryptoAnalysis #PriceAction #Breakout #TechnicalAnalysis #CryptoTrading #WeeklyChart #SupportResistance #TrendReversal #CryptoBreakout #DeFi
CakePancake swap
Cake usdt Daily analysis
Time frame daily
Risk rewards ratio >3.3 👈👌
Target 4$
If cake can break the resistance on 2.9 $ it can move up to my target
If can't break it my analysis is failed and must try at the other time

PancakeSwap Holds Strong Support, Eyes 18% Rally Toward $3.40Hello✌️
Let’s analyze Pancake Swap’s price action both technically and fundamentally 📈.
🔍Fundamental analysis:
Altcoin Season Index jumped 39% yearly, with CAKE up 82%, but BTC dominance stays high at 59.19%, holding altcoins back. 📈
📊Technical analysis:
BINANCE:CAKEUSDT is holding key Fibonacci levels near strong daily support and a solid trendline. If this zone holds, an 18% rally toward $3.40 is likely.📊🔥
✨We put love into every post!
Your support inspires us 💛 Drop a comment we’d love to hear from you! Thanks, Mad Whale

Keep buying a big piece of $CAKE!This chart is just beautiful. It has everything you want for a solid consolidation:
Bullish structure
Consistent tests of highs
Flipping support/resistance levels within the range
Holding above previous yearly swing lows
Monthly trend is active and aligned with time@mode — can’t ask for more.
If CRYPTOCAP:BNB is running strong and looking good, this one should follow — similar to what NASDAQ:RAY did when CRYPTOCAP:SOL had that impressive run.
BINANCE:CAKEUSDT

Pancake Swap (CAKE): Risking 1% to Gain 5% | Good R:R TradeCAKE has good opportunities ahead, where we are looking to catch good risk and reward ratio trades; all we need is that breakout we are looking for!
More in-depth info is in the video—enjoy!
Swallow Academy

It's time for tea and cake.The bull market is the best time to accumulate wealth. Cake is one of the best companions on this path.

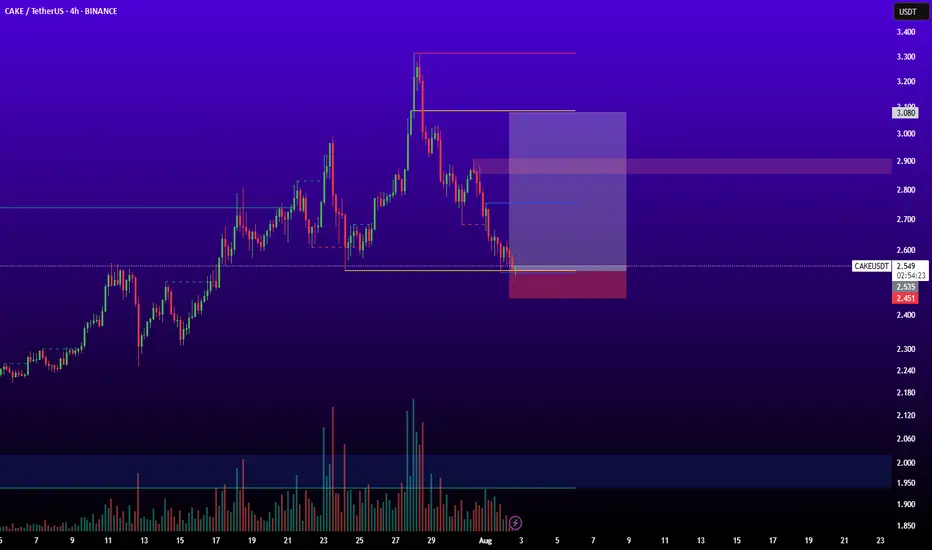
CAKEThis idea is best for person that control risk management.
entry: 2.535
sl: 2.450
tp: 2.700 - 2.900 - 3.080
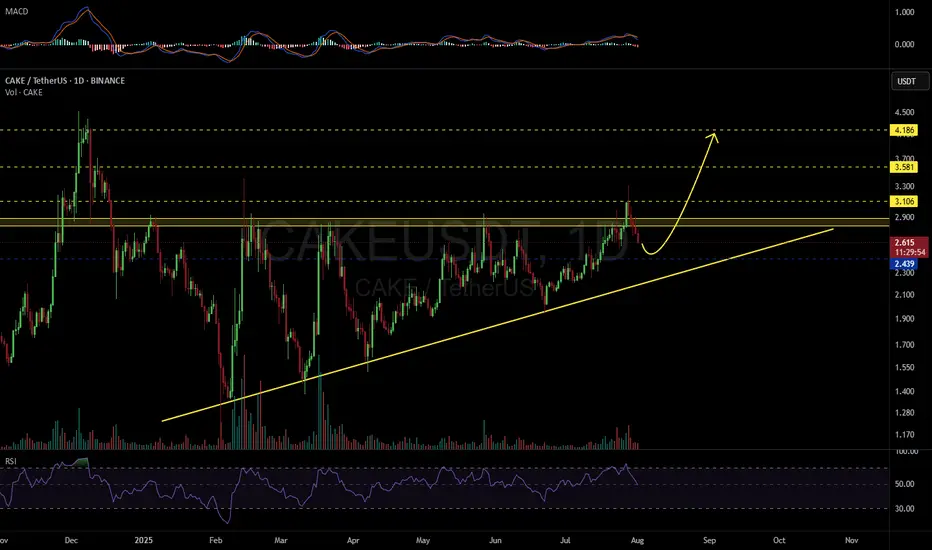
CAKEUSDT 1D#CAKE broke above the ascending triangle resistance, but due to Bitcoin's drop, it pulled back inside the triangle.
📌 If you're looking to enter, consider placing a buy order near the support level at $2.439.
In case of a bounce and a breakout above the triangle resistance, the upside targets are:
🎯 $3.106
🎯 $3.581
🎯 $4.186
⚠️ As always, use a tight stop-loss and apply proper risk management.
CAKE USDT :WThe CAKEUSDT currency is in a good position on the weekly timeframe near long-term dynamic resistance. Considering the RSI and trading volume, the probability of breaking this resistance is high.

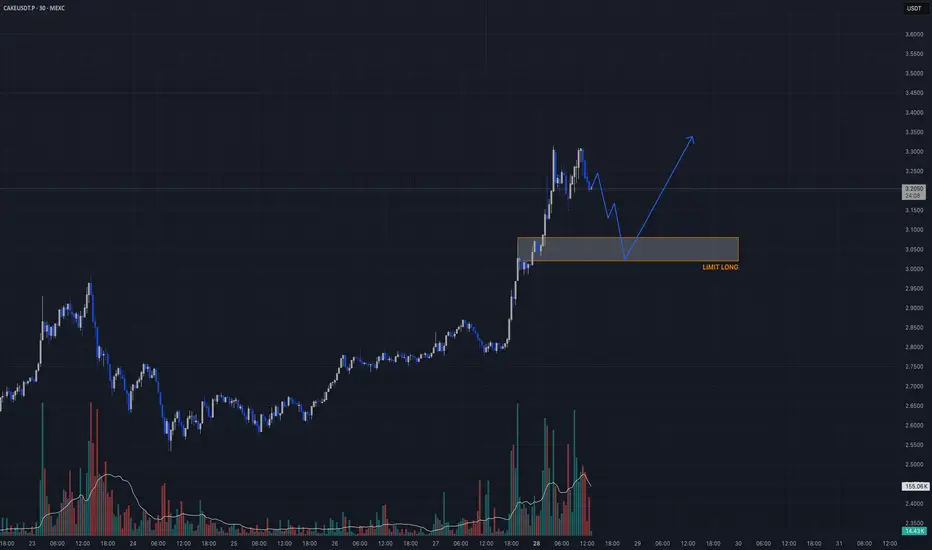
Breakout Retest (HTF Structure Shift)🔥 BINANCE:CAKEUSDT.P TRADE IDEA 🔥
📈 Bias: Long
🧠 Strategy: Breakout Retest (HTF Structure Shift)
📍 Entry Zone:
▫️ Entry: 3.02 – 3.08
🛡️ SL: 2.92
🎯 Take Profits:
▫️ TP1: 3.55
▫️ TP2: 3.88
▫️ TP3: 4.20+
Why?
– HTF breakout from long-term accumulation
– Bullish volume spike confirming trend shift
– Retesting OB + flipped structure
– 15m confirmation will validate entry
⚠️ Wait for a sweep + BOS or volume spike in entry zone
—
Posted by: Candle Craft | Signal. Structure. Execution.
From Rejections to Breakout? CAKE Faces Key TrendlineNASDAQ:CAKE has been stuck in a long-term downtrend, constantly getting rejected from that falling red trendline.
But things are starting to shift...
After bouncing off the major support zone, price is once again pushing toward that trendline, and this time, momentum looks stronger.
If CAKE can break and hold above this level, we could finally see a powerful move toward the $5+ resistance zone.
Just a heads-up: it’s been rejected here before, so let the breakout confirm before getting too excited.
DYOR, NFA

$CAKE is coiling up nicely - Aiming for $7
It hasn’t done much over the past few months, but it’s now above the yearly open and on its 6th attempt to break through the monthly supply zone.
Could this finally be the breakout that leads us toward $7?
Taking bids here and exercising patience.
With CRYPTOCAP:XRP , CRYPTOCAP:ETH , CRYPTOCAP:HBAR , and EURONEXT:ALGO already moving — and possibly CRYPTOCAP:BNB next — this could be a perfect setup for a delayed BINANCE:CAKEUSDT catch-up play.
CAKEUSDT UPDATE
Pattern: Falling Wedge Breakout
Current Price: \$3.199
Target Price: \$4.50
Target % Gain: 90.24%
Technical Analysis: CAKE has broken out of a long-term falling wedge on the daily chart, supported by strong bullish candles and increased volume. Price has cleanly closed above trendline resistance, indicating potential continuation toward \$4.50.
Time Frame: 1D
