Stuck in the Zone: DXY Tests Balance Between 98 and 99Hello Traders,
After a sharp and uninterrupted decline in the DXY, price found support at the 97.921 level. Sellers then regained control from the weekly bearish Fair Value Gap (W-FVG), pushing price back into the 99 zone.
In this zone, neither sellers nor buyers have managed to assert dominance—suggesting that these levels may act as a pause or balance point. Given the extended drop, a temporary correction could follow if buyers gain traction after one last push.
For now, the bearish USD narrative remains intact. With upcoming catalysts like China/US talks and tomorrow’s CPI release, a renewed move toward 98 is likely to accelerate.
Whether this leads to further selling or a corrective phase will be assessed afterward.
DXY trade ideas

DXY OUTLOOK - SWING SETUPThe dollar has been on a six-month decline, but I anticipate a recovery. This is primarily due to the current economic climate, geopolitical landscape, and the dollar's traditional role as a safe-haven currency during periods of significant uncertainty
"May fortune attend thee, and thy trade prosper." .......L2Earned
DXY: US dollar To Drop Further Around 95?The US dollar has been steadily declining since the new president was elected in the USA. This decline has been accompanied by the ongoing trade wars. Numerous economic indicators have supported this trend, and we anticipate further depreciation in the coming days or weeks. Before trading, it’s essential to conduct your own analysis and gain a comprehensive understanding of the market.
We wish you the best of success in trading. Good luck and trade safely.
Like and comment for more, and as always, happy trading!
Team Setupsfx_

DXYThe DXY has faced severe sell off due to President Trump's policy and idea of how the dollar should be controlled/managed. Though it has fallen, a pullback will happen soon. I will be using the DXY as a good guide for all the USD/XXX or XXX/USD pairs. You as a trader can take what you can from this.
These 4HR FVG'S seem like a very good place where you can do one of two things. First you may be able to manage and hold a trade throughout the whole pullback. Another option is take complete profits instead of partials and enter in at good prices with this pullback in mind for bias.

Dollar consolidating - Still long term bearishLets see if the Daily Volume imbalance can hold price lower here. If it breaks higher then the clean highs will be a target for a sweep then return lower again. FOMC Tomorrow!! Stay safe

DXY Elliott Wave AnalysisThe dollar is finishing a corrective pattern. A good trade opportunity will present itself shortly. Stay tuned for updates.

dxy 1hr chart analaysis The current bullish trend in the DXY is likely to face a strong rejection around the 99.55–99.65 zone. Unless there is major news that significantly shifts the market direction — such as a surprise policy announcement like the tariffs introduced during Trump's era — the dollar index is not expected to break above that level. That zone could act as a major turning point, and a bearish reversal is likely to emerge from there

DXYWe are expecting DXY to give us bullishness in this week first.
Disclosure: We are part of Trade Nation's Influencer program and receive a monthly fee for using their TradingView charts in our analysis.

DXY is turning BULLISH,I'm buying at market open, you should tooTechnically, DXY should retrace from here, range for sometimes, take out liquidity and then continue higher. My DXY post this year has a 99% accuracy. Dont take it lightly.
Now, Dxy had been following a downward trendline since the beginning of this year and I'm seeing a break out soon. Conservative traders can wait for a break and retest but I'm fairly sure we will get it. Enter and add more as the move goes in your favour, stop wasting pips. Dont hold this trade and make only 1k. Add more, compound, not when in loss but when in gain. This will change the game for you.
This means that you should be looking for sell on EURUSD, GBPUSD, AUDUSD et al.
Ya gaziere unu
TP1 @ 99.4
TP2 @ 100.5

DXY OUTLOOKhello.
this is my view or the dwy in the next 2 days :)
hope you find this helpfull
i wil update in the mid week

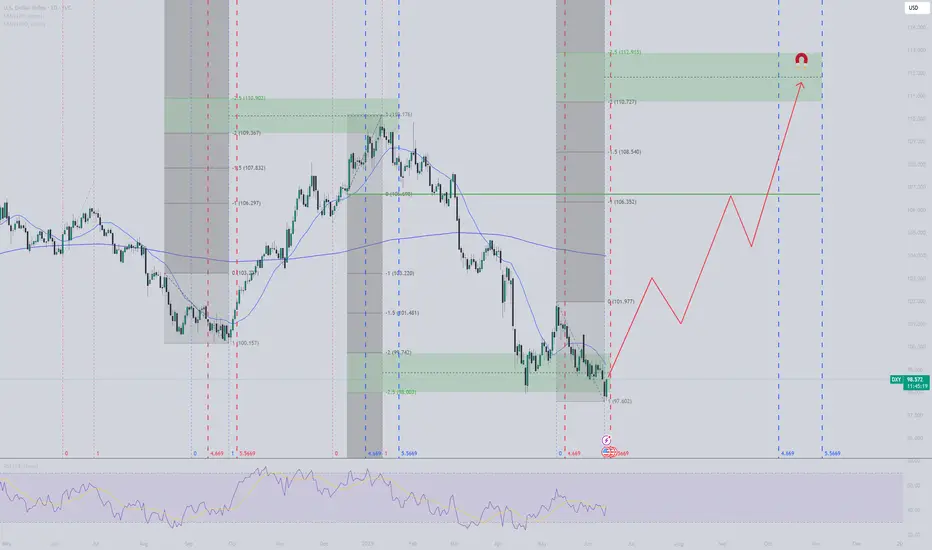
Follow up on DXY Short post from 2022The DXY follows Fib levels quite accurately on macro movements using the monthly chart. Both on retracement and extension. It has recently tagged the .618 retrace of the last bullish wave 5 movement that started its decline.
I would suppose it is close to completion of wave A of a ABC correction that will play out over the next several months. As it tagged the .618 mentioned above, it has also tagged the .786 extension of what is likely the c wave of the abc structure (of the larger A).
B wave trade to the upside has good probability now in my opinion. I took the trade this morning with a 3-1 RR in place. It could fall to the trend line which is fine, but if it breaks in earnest and closes a few sessions below then my stop would be triggered.
There was a bullish divergence prior to the April lows on the Daily TF and one is developing at the current lows. A close above 99.40 would confirm.
Long term the dollar is likely still going to weaken and go much lower as QE inevitably comes back into the market picture. TP levels are at 99.40, 100.54, 101.25 and 101.76.

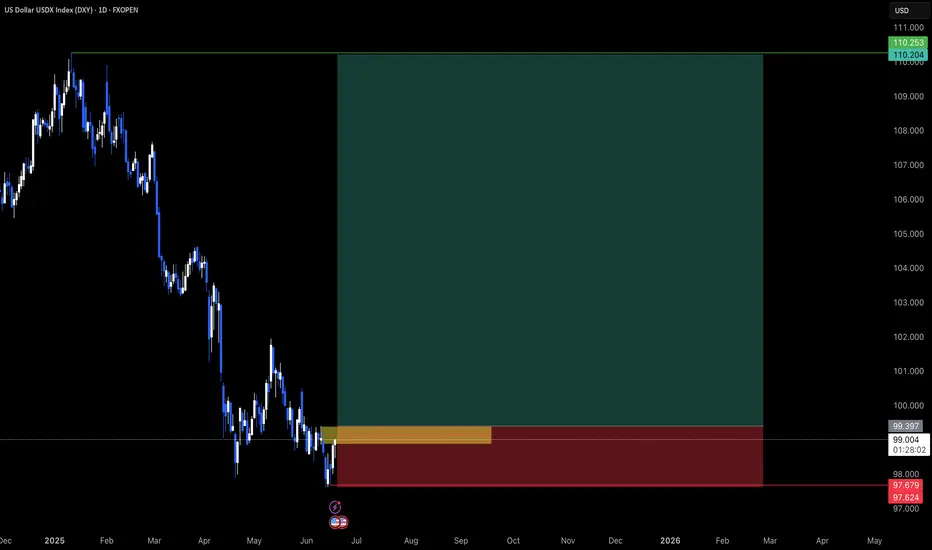
DXY ready for takeoffDXY seems to have reached the bottom for now, as planned within the marked red timezone. I expect a bullish run until October (blue timezone) with target around 111-113 USD, which corresponds to 2-2.5 stdv from this last manipulation leg lower. All areas marked in chart.
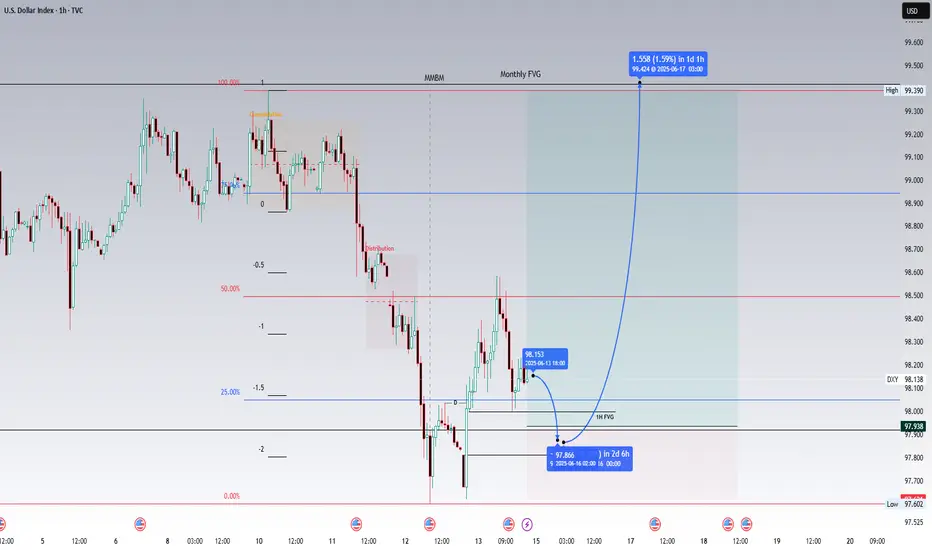
Potential bullish scenario formulating for DXY. Target: 99.418.Higher timeframe analysis
Thursday, 12 June 2025 saw the DXY take out the monthly low of 97.921. This poses the bearish monthly FVG as an immediate draw on liquidity at 99.418. Warranting a bullish bias till this level.
Intermediate timeframe analysis
This bullish bias is further confirmed by an initial consolidation identified on the 1H chart immediately below the said monthly FVG. This is a signature of the formation of a market maker buy model. Note the displacement to the updside which occurred at 21:00 EST leaving behind a bullish fair value gap on the 1H. This signals the beginning of the buyside of the curve of a market maker buy model.
Scenario
A potential long scenario could play out whereby price could respect the bullish 1H FVG at 97.999 and reprice updwards towards 99.418. I suspect that the target could be reached by Tuesday morning at 2:00 am - 3:30 am EST, though this is merely an estimation at best. This analysis is largely dependent on the reaction of price in the weekly open. Though in the event of a non-volatile market open this analysis holds decent probability.
Alternate Scenario
Should the above analysis fail the relative equal lows at 97.602 could be taken out before upside to 99.418 is seen.
US DOLLAR INDEX(DXY): Classic Bearish SetupI believe that 📉DOLLAR INDEX has a potential to continue falling.
The market has been consolidating in a wide intraday horizontal range, and the breakout below the range support is a significant bearish indicator.
Target levels are 98.08 then 97.80 support.

DXY HOTD SetDXY HOTD Set
Unemployment Claims delivery lower expected.
H1 FTB, Weak Low.
H1 FVG, H1 QM
LOWER !!!
Let's see...

My Thoughts #015My Thoughts
Are that the pair will sell in this manner.
The pair is in a bearish pattern
Currently the pair is making a new LL
Meaning that on the lower time frame the pair is in a bearish pattern.
As you can see that pair just made a new LL a new LH is expected
It could buy and invalidate the set up.
Just use proper risk management
Let's do the most

Short Idea on DXYBased on :
- Investors surprised by the cpi new and seeking safety in bonds (ZB1!) making dollar go down
- break out of an important support level
- 2 supply zones

DXY ||| • Sell Completed Below Orange Line📉 Pair: GBP/USD
⏱ Timeframe: 4H
🔶 Orange Line = Major S/R Zone
📌 Confirmed Break + Retest
🎯 Profit Locked | Risk Managed
Strategy: Elliott Wave + Parallel Channel + SMC (Break of Structure)
🔶 Status:
Completed Wave 5 inside falling wedge
Sell executed after orange support break
Anticipating accumulation phase > BOS > bullish reversal
📍Key Zones:
Demand zone near 97.455
Resistance near 98.426
🎯 Next Steps: Looking for bullish structure post BOS + Wave 2 pullback.
🔁 Watch for:
Accumulation near lower trendline
Structure shift > Breakout of wedge
Long confirmations in late July – early August
🟢 Plan the trade, trade the plan.

DOLLAR INDEXThe DXY (U.S. Dollar Index) is a measure of the U.S. dollar’s value relative to a basket of six major foreign currencies: the euro (57.6%), Japanese yen (13.6%), British pound (11.9%), Canadian dollar (9.1%), Swedish krona (4.2%), and Swiss franc (3.6%). It serves as a benchmark for the dollar’s global strength and is influenced by macroeconomic factors like interest rates, trade flows, and inflation expectations.
10 years bond yield Correlations with DXY
1. 10-Year Bond Yield
Positive Correlation: The DXY and U.S. 10-year Treasury yields generally move in the same direction. Higher yields attract foreign capital into U.S. bonds, increasing demand for dollars and strengthening the DXY.
Current 10-Year Yield (June 12, 2025): 4.36%, down slightly from 4.41% the previous day but up 1.16% year-over-year.
2. Bond Price
Inverse Relationship with Yields: Bond prices fall when yields rise (and vice versa). Since DXY and yields are positively correlated, the dollar tends to strengthen when bond prices decline.
3. Interest Rates
Direct Link: Higher U.S. interest rates increase the dollar’s appeal as investors seek higher returns, boosting DXY. Conversely, rate cuts weaken the dollar.
Example: The Federal Reserve’s rate hikes in 2023–2024 contributed to DXY strength, while recent rate-cut expectations have moderated its gains.
Current 10-Year Treasury Yield
As of June 12, 2025, the 10-year Treasury yield is 4.36%, below its long-term average of 5.83%.
Key Drivers of DXY in 2025
Federal Reserve Policy: Markets are pricing in potential rate cuts later in 2025, which could limit DXY upside.
Global Risk Sentiment: Safe-haven dollar demand rises during geopolitical or economic uncertainty.
Inflation Trends: Persistent U.S. inflation could delay Fed easing, supporting DXY
technical level to watch is the support level at 97,949

XAGUSD, XAUUSD, BTCUSD, ETHUSD & DXY Daily Trade SetupsIn this update we review the recent price action in Silver, Gold, Bitcoin, Ethereum & the Dollar Index and identify the next high-probability trading setups and price targets. To review today;s video analysis click here!

Caution for Dollar Shorts with Middle East Tensions FlaringMy educated guess is that the dollar is moving similar to the first time trump was elected. I am expecting dollar weakness to abate early next year. A major swing low formed in early 2018 one year after Trump was elected first round. Let us see if a similar situation forms next year. For now with DXY structured bearish caution is warranted with Oil up and 10 yr remaining elevated. There is a prior up move in April and until a decisive break below the current area Price Action and circumstances in the middle east warrant caution for dollar shorts.

DXY for short 45m*The content on this analysis is subject to change at any time without notice, and is provided for the sole purpose of assisting traders to make independent investment decisions.

DXY: Local Bullish Bias! Long!
My dear friends,
Today we will analyse DXY together☺️
The market is at an inflection zone and price has now reached an area around 97.757 where previous reversals or breakouts have occurred.And a price reaction that we are seeing on multiple timeframes here could signal the next move up so we can enter on confirmation, and target the next key level of 97.970.Stop-loss is recommended beyond the inflection zone.
❤️Sending you lots of Love and Hugs❤️
