NAS100 at Critical Supply Zone – Is a Major Reversal Brewing?The NAS100 (US100) just tapped a key supply zone around 21,250, showing strong signs of overhead resistance. This is the same area that previously triggered sharp rejections – and we’re back there again.
What I'm watching:
Price Action is currently reacting to a visible supply zone (highlighted in blue).
If the market fails to break above 21,250, I expect a potential rejection leading to:
First support zone: 17,064
Second deeper target: 12,588 (strong demand zone highlighted in orange).
Bearish Outlook Triggers:
Daily close below 20,900
Increased sell volume at resistance
Failure to form higher highs
Bullish Invalidator:
Clean breakout and retest above 21,250 with momentum
My Plan:
Watching for short signals near resistance with tight SL above 21,400. TP zones set around 17k and 12.5k if weakness confirms.
Technical Confluence:
Previous highs acting as resistance
Supply & demand zones (LuxAlgo VR)
Bearish divergence forming on RSI (not shown here but visible on lower TFs)
What do you think? Will NAS100 break out or is a deep correction coming?
#US100 #NASDAQ #Indices #PriceAction #SupplyAndDemand #LuxAlgo #TradingStrategy #ReversalSetup #SmartMoney #BearishBias
US100 trade ideas

are we going ath? let us now~~indices looks green, so we rally?
no trump tariffs?
🐉We value full transparency. All wins and fails fully publicized, zero edit, zero delete, zero fakes.🐉
🐉Check out our socials for some nice insights.🐉
information created and published doesn't constitute investment advice!
NOT financial advice


$NDX And The Expanding WedgeNASDAQ:NDX has a lot going for it and plenty of lifechanging money to be made.
As you can see whether you draw a bear flag that is still valid or a large Triangle (also valid) there is an amazing opportunity for profit.
Firth thing to notice other than this triangle is the weakness creeping in at the retest of weekly resistance above. MA angles are starting to cross down and a clear indication of a false breakout is signaling on the CCI.
Keeping in mind that not only on the Futures charts but also on the indexes we have quite a few long distance gaps left open, most notable at 18,300.
Whichever way this triangle breaks, the move will be massive.
Hang on to your butts..

NAS100...Ever The Bullish Instrument 37Last week the market created great opportunities for buyers and sellers as there was a high level of volatility and consolidation, so much so that many traders ignored a key element in the movement for NAS100 and that is that with all the selling that took place, the NAS100 index still closed above the previous weeks low and above the lowest point so far of the year...a clear indication that the HL's are still intact.
As I have always said and will continue to say...any sells on the NAS100 are only temporary retracements to form the HL on a larger timeframe. With that being said, any retracement sell that I take is simply to capitalized on the current retracement and to build my account to be able to scale up to a larger lot size.
While many continue to anticipate a sustained drop in the NAS100...A master class in trend movements is currently being prepared and will be executed when the time is right.
For now, I continue to capitalize on this perfect opportunity to take buys and sells in a consolidatory market that clearly is making space for the next move once it completes it's required retracement.
Until such times:
1. I enter on my largest HL
2. Exit on my largest LH (if the market continues to consolidate and wait for the next HL to be
formed for another entry
3. The HH's are guaranteed to come again once the upper level consolidation is broken.
Until then, the retracements provide some very profitable bonus moves once you have an understanding that they will not continue forever.
So for this week...no rush to enter any buys without proper confirmation.
My original level is 20,667.9, however my if I get a confirmation before that level is touched then the buys will resume for me.
Have a great week and happy trading.
#oneauberstrategy
#auberstrategy
#whywewait
#patience
#zigzagtheory
#oneauberstrategy

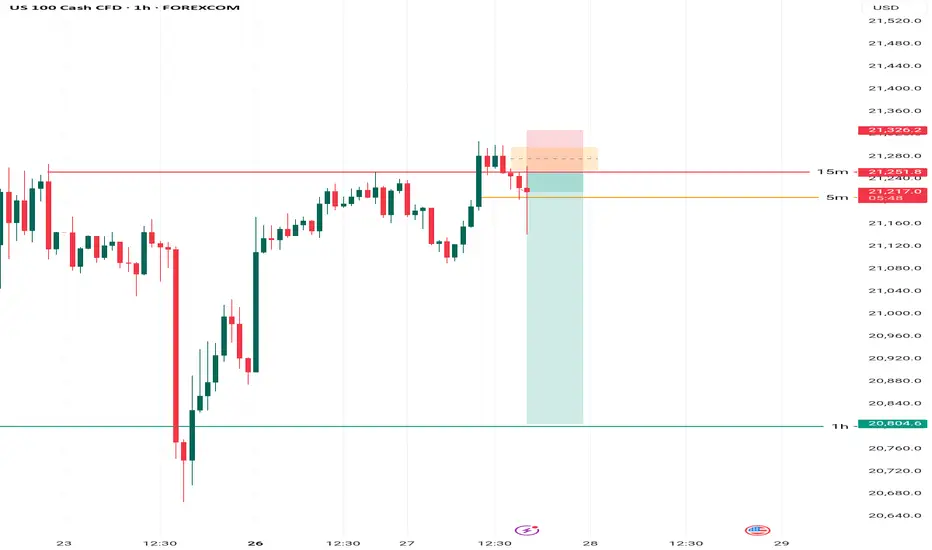
Nasdaq 100 Heading Downwards on the 1-Hour TimeframeConsidering the positive trend on the 1-hour and 2-hour timeframes, and the need for energy to continue the upward movement, along with the fact that the M15 trend was negative, given the pullback in this area, we expect a decline towards the 1-hour low.
Please make sure to maintain a 2% risk of your account balance and do not risk more than that. Always take responsibility for your trades.
US100 (NASDAQ) BREAKOUT BLUEPRINT: LOOT LIKE A SMART TRADER!🔥 NASDAQ 100 HEIST: STEAL THE TREND LIKE A MARKET BANDIT! 🚨💰
Locked & loaded for the US100 (NASDAQ 100) heist? This slick blueprint cracks the code to loot profits—blending killer technicals with macro intel. Ride the bullish wave, but dodge traps near the Overbought Zone. Bears lurk, so secure your bag before the reversal hits! 🐻💨
🎯 ENTRY: STRIKE LIKE A PRO THIEF
Long the breakout near 21,500.0 (or ambush pullbacks at 20,400.0 & 19600.0).
Set stealth alerts to catch moves in real-time. 🕶️🔔
🛡️ STOP LOSS: ESCAPE ALIVE
Hide stops under the last 4H swing low/wick—no reckless bets!
Adjust for your risk—survivors play smart. ⚡
💸 TAKE PROFIT: VANISH WITH THE LOOT
Main Target: 22,250.0 (or bail early if momentum fades).
Scalpers: Trail stops & ghost out with quick wins. 🏃♂️💨
📡 WHY THIS HEIST WORKS
NASDAQ 100’s on fire: Fundamentals + COT data + macro tides align.
Sentiment’s bullish, but stay sharp—links below for the full intel. 🔍🌐
⚠️ WARNING: NEWS = POLICE SIRENS
Avoid new trades during high-impact news. 📢
Lock profits with trailing stops if you’re already in. 🔐
🤝 JOIN THE TRADING MAFIA
Smash LIKE, drop a comment, & let’s dominate the US100! �
Ready for the next big move? Stay tuned. 👀
Happy hunting, chart pirates! 🏴☠️📉

US100 INDEX TRADE IDEA 27 MAY 2025The US100 index is currently demonstrating strong bullish momentum, underpinned by both Smart Money Concepts and supportive market fundamentals. From an SMC perspective, the index recently completed a clear shift in market structure following a major sell-side liquidity sweep below the 16,000 region in April. This move tapped into a long-term demand zone and a bullish order block before sharply reversing upward. The subsequent rally broke the previous bearish structure from February to April, indicating a clear change in sentiment and suggesting that institutional players have re-accumulated positions. Price action reinforces this outlook through a breakout from a falling wedge pattern followed by a bullish continuation channel. The current structure shows a series of higher highs and higher lows, with price consolidating just above a key short-term demand zone near the 21,000 mark. This consolidation phase could represent a reaccumulation before a continuation toward the next liquidity targets.
The technical setup suggests a long opportunity with an entry zone between 21,000 and 21,100, targeting the next major resistance levels at 22,134 and 22,524. A protective stop loss can be placed just below the recent swing low or order block around 20,113, ensuring invalidation only if the bullish structure breaks. From a fundamental standpoint, mid-2025 has been favorable to tech-heavy indices like the Nasdaq, as investors anticipate potential Federal Reserve rate cuts later in the year. Inflation has shown signs of easing, and corporate earnings in the tech sector have continued to outperform expectations, boosting investor sentiment. The broader macroeconomic landscape remains supportive, with resilient labor markets and improving risk appetite driving capital back into equities. With these tailwinds and a technically sound chart setup, the US100 presents a compelling swing long opportunity.

NASDAQ: Needs to reclaim the 4H MA50.Nasdaq is bullish on its 1D technical outlook (RSI = 62.436, MACD = 467.180, ADX = 28.529) as it maintains its long term bullish trend through the Channel Up pattern, which recently is transitioning into a Rising Wedge. We are willing to turn bullish again upon a 4H candle closing over the 4H MA50 and aim for a +11.17% rise (TP = 23,000) on the HH trendline, like the April 21st rebound did.
## If you like our free content follow our profile to get more daily ideas. ##
## Comments and likes are greatly appreciated. ##

Genius or Just Guessing? NAS100 Setup Has It AllNAS100 has broken its uptrend but still feels bullish overall. The plan? A tactical short on the pullback and a long if it reclaims strength. If both play out, it’s a multi-legged win. If not, it’s a lesson in humility. Here’s how we’re threading the needle with a high-risk/high-reward setup.

US index futures and Apple tumble on Trump warningUS index futures and Apple shares tumbled in premarket as Trump warned the company of 25% tariffs if manufacturing of iPhones is not moved to the United States.
This is what Trump posted on social media:
"I have long ago informed Tim Cook of Apple that I expect their iPhone’s that will be sold in the United States of America will be manufactured and built in the United States, not India, or anyplace else. If that is not the case, a Tariff of at least 25% must be paid by Apple to the U.S. Thank your for your attention to this matter!"
Let's see if the recent stall in the rally will now turn into more than just a pause.
The other big concerns remains over US Treasuries and rising long term bond yields. Long-dated US Treasuries managed to claw back some of their recent losses yesterday and that helped the markets a little. But if the bond market selling resumes then yields will remain elevated and pressurize all sorts of risk assets. Without a fundamental shift in US fiscal policy, the implications of rising US borrowing costs and widening fiscal deficits means the US is on an unstable fiscal policy path, which could lead to heighten market volatility.
By Fawad Razaqzada

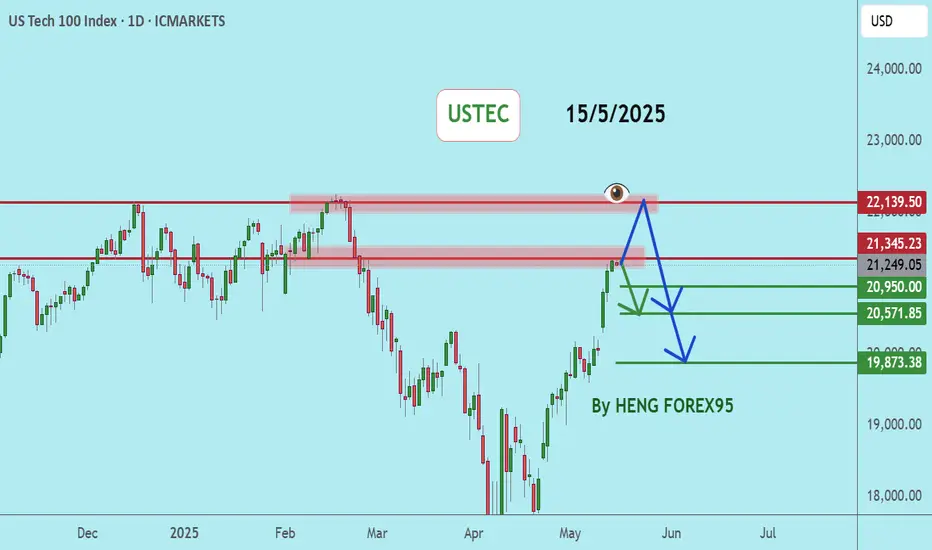
USTECUSTEC price is near the important resistance zone 21345 and 22244. If the price cannot break through 22244, it is expected that the price will drop.
**Very Risky Trade
🔥Trading futures, forex, CFDs and stocks carries a risk of loss.
Please consider carefully whether such trading is suitable for you.
>>GooD Luck 😊
❤️ Like and subscribe to never miss a new idea!

Position for a Short-Term Bounce
- Key Insights: The NASDAQ has entered a historically oversold state, presenting
a high-probability opportunity for a short-term rebound. While bearish
signals persist due to recent momentum shifts, long-term institutional
activity indicates underlying support. Traders should look for defensive
buying near support zones to capitalize on upward moves. Critical levels
must be monitored closely for confirmation.
- Price Targets:
- Next Week Targets:
- T1: 21,000
- T2: 21,479
- Stop Levels:
- S1: 20,426
- S2: 20,250
- Recent Performance: The NASDAQ has faced four consecutive days of declines,
breaking below key technical levels that signal bearish pressures. However,
institutional support and broader bullish indicators remain intact, keeping
the index positioned as the strongest major U.S. equity index in the longer
term. Historically oversold conditions provide optimism for a potential
bounce next week.
- Expert Analysis: Despite short-term bearish momentum, expert outlook continues
to align with NASDAQ’s long-term resilience above major moving averages.
Institutional liquidity flow and ongoing interest in technology continue to
support the index, though caution is warranted around immediate support
barriers to avoid deeper pullbacks. Monitoring liquidity gaps is crucial.
- News Impact: NVIDIA earnings are anticipated to be a pivotal event next week
and could drive volatility in NASDAQ tech sectors depending on the outcome.
Elevated volatility levels, as evidenced by the VIX, further warrant caution
while underscoring potential opportunities for rebound plays. Additionally,
NASDAQ’s move to expand zero-day options trading has drawn mixed responses
but could influence short-term speculative activity in its top tech stocks
like Apple, Microsoft, Amazon, and Alphabet.
USTEC100 Chart 4H, Trends To Watch for Short The provided USTEC 100 (US Tech 100) 4-hour chart highlights a strategic short (sell) trade setup based on technical price action and defined risk levels. The analysis suggests a bearish market bias, provided that specific price conditions are met and maintained. Let's explore the details and rationale behind this trade idea to understand how traders might approach this setup with calculated entries, targets, and stops.
As per the current market data presented, USTEC 100 is trading around 21,115.00 on Monday, 19 May 2025. The chart emphasizes a critical resistance zone highlighted in red, located at approximately 21,445.10. This level acts as a potential invalidation point for the short trade. If the price crosses above this red zone and a full candle closes above it, the entire bearish setup becomes invalid. This is a key condition – any move above this threshold signifies a shift in market sentiment and cancels the downward outlook.

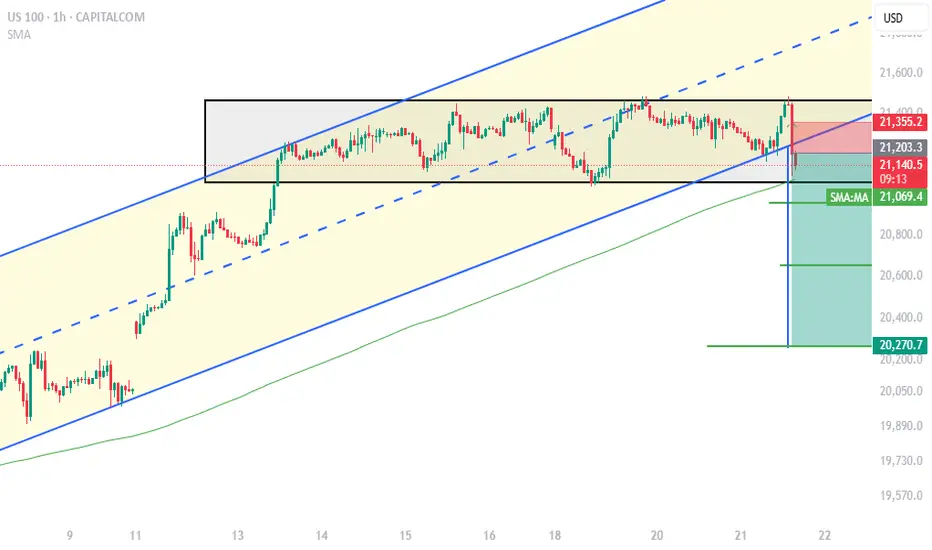
US100 4HAs expected from last week’s analysis , the market reacted and dropped.
Right now, multiple scenarios can play out, but based geometric analysis, the most likely one is a continuation of the bearish structure unless 21200 is broken.
Confirmation for further downside is a clean break below 20770.
Failure to break this level would invalidate the bearish outlook.
Downside targets:
20500
20330
20000
If there’s strong selling pressure, even a deeper correction toward 19000 is possible — but only valid if price returns with strong bullish rejection.
Otherwise, holding below 19000 would confirm a deeper bearish move (which I personally don’t expect for now).

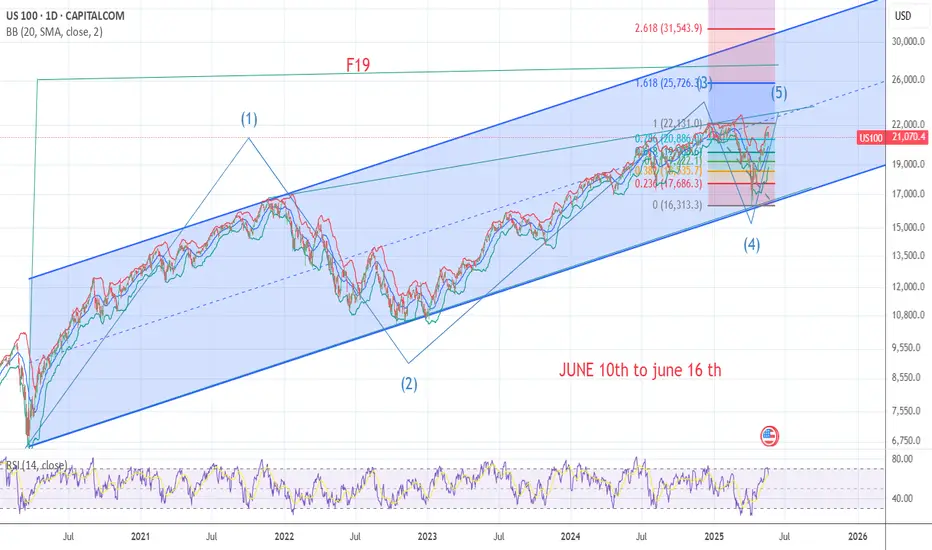
This is why I am still Bullish until then The way I have been counting the market since march 23 th 2020 low this was the Bullish count . A diagonal I can come up with a lot of targets . I rather wait till I have 5 up I still think we break just above the BB bands we sure did at the low 4835 = was .786the wave 2 drop on Pct basis and was equal to on points . Best trades Wavetimer!
NAS100USD: SMT Divergence Signals Reversal from Discount PricingGreetings Traders,
In today’s analysis, we are closely monitoring NAS100USD for a potential reversal of bearish institutional order flow. While the broader trend has been bearish, current price action presents strong confluence for a bullish shift, suggesting an opportunity to align with a possible upside move.
Market Context:
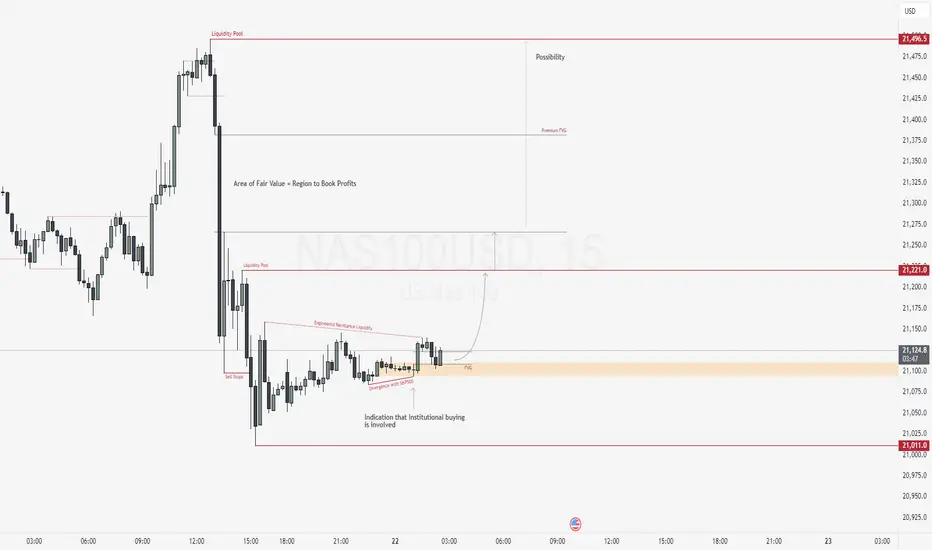
NAS100USD is currently trading in deep discount territory, which historically presents favorable conditions for institutional accumulation. We’ve observed a liquidity sweep—price took out previous sell stops—suggesting institutions may have order-paired against willing sellers at these discounted levels.
Key Observations:
SMT Divergence with S&P500: While the S&P500 took out its previous low, NAS100USD remained above its corresponding low. This divergence signals underlying strength and institutional buying on NAS100USD, offering a strong indication of a reversal.
Bullish Structure Hints: Minor breaks in market structure to the upside are emerging, further validating the bullish narrative.
Institutional Support Zone: Price is currently trading inside a bullish order block that is also aligned with a Fair Value Gap (FVG)—a strong confluence zone that may act as support for continued upside movement.
Trading Strategy:
Await confirmation of support holding within the order block and FVG zone.
Target 1: Relatively equal highs just above current price action—an engineered liquidity pool where buy stops are likely resting.
Target 2: The premium FVG, a key area of institutional interest where longs accumulated at a discount will be offloaded for profit. The area of fair value is an region where the institutions start to book their profits.
By reading the divergence, price action, and institutional behavior, we can strategically position ourselves to capitalize on a high-probability reversal.
Happy Trading,
The Architect 🏛📊


NASDAQ 100 Setup After Bearish Pullback. My Bullish Game Plan!🚀 NASDAQ US100 Update – Key Levels I'm Watching 💡📈
Looking at the NAS100 right now, we’ve seen a strong rally kick off after the weekend 📊🔥 — this comes on the back of an aggressive bearish pullback last week 📉.
📌 My bias is bullish, but with a condition: I want to see price retrace into the 10-minute fair value gap and hold above the previous low 🧠🔍.
If we get a clean pullback, followed by a continuation with higher highs and higher lows, I’ll be watching closely for the first bullish break after that next pullback — that’s where I’d look to position long 🐂📈.
🛑 Not financial advice.
👇 Drop a comment if you're watching these levels too!

NASDAQ100 (US100) – Supply Zone Rejection in Play?Fundamental
Despite strong earnings from big tech and resilient economic data, concerns around Fed’s hawkish tone and sticky inflation are resurfacing. Rate cut expectations are being pushed further out, weighing on high-growth sectors like tech.
Technical
The index is testing a key supply zone between 21,380–21,420, aligned with previous highs and fib levels (0.618–0.786). Volume is thinning above, and momentum (Stoch RSI) shows early signs of bearish divergence.
Trade Setup (Short-biased)
- Entry: If price rejects the 21,380–21,420 zone. Before entering, make sure you see bearish pressure first. Like strong red candle on 1h, 2h time frame.
- First Take Profit 1: 20,600
- Second Take Profit 2: 20,000
Follow me for updates on entry confirmation, scaling strategies, and live adjustments.
Thank you

