Rice 6.29.22Rice prices setting up for another leg higher. Explosive move at least a 2.5x
“Who controls the food supply controls the people; who controls the energy can control whole continents; who controls money can control the world.” H Kissinger
ZR1! trade ideas

RICE FUTURES (ZR1!), H1 Potential for Bearish MomentumType : Bearish Drop
Resistance : 16.570
Pivot: 16.310
Support : 16.035
Preferred Case: On the H1, price is moving below the ichimoku cloud and within the descending channel which gives us a bearish bias that prices will drop to the pivot at 16.310 where the 78.6% fibonacci retracement, 61.8% fibonacci projection and swing low support are. Once there is downside confirmation that price has dropped to pivot , we would expect bearish momentum to carry prices to 1st support at 16.035 where the swing low support, 78.6% fibonacci projection and 61.8% fibonacci projection are.
Alternative scenario: Alternatively, price may rise to the 1st resistance level at 16.570 in line with the pullback resistance.
Fundamentals: Since both countries, Russia and Ukraine, are major exporter of agriculture goods and their persistent war will lead to a shortage of agricultural goods and give us a bullish bias for rice.

Rough Rice commodity USA Sun Storm Investment Trading Desk & NexGen Wealth Management Service Present's: SSITD & NexGen Portfolio of the Week Series
Focus: Worldwide
By Sun Storm Investment Research & NexGen Wealth Management Service
A Profit & Solutions Strategy & Research
Trading | Investment | Stocks | ETF | Mutual Funds | Crypto | Bonds | Options | Dividend | Futures |
USA | Canada | UK | Germany | France | Italy | Rest of Europe | Mexico | India
Disclaimer: Sun Storm Investment and NexGen are not registered financial advisors, so please do your own research before trading & investing anything. This is information is for only research purposes not for actual trading & investing decision.
#debadipb #profitsolutions

RICE FUTURES (ZR1!), H1 Potential for Bearish MomentumType : Bearish Momentum
Resistance : 16.715
Pivot: 16.570
Support : 16.105
Preferred Case: On the H1, with price moving below the ichimoku indicator and within the descending channel , we have a bearish bias that price will rise to and drop from our pivot at 16.570 in line with the swing high resistance to the 1st support at 16.105 in line with the 61.8% fibonacci projection and swing low support.
Alternative scenario: Alternatively, price may break the pivot structure and rise to the 1st resistance at 16.715 in line with the overlap resistance, 61.8% fibonacci projection and 38.2% fibonacci retracement .
Fundamentals: Since both countries, Russia and Ukraine, are major exporter of agriculture goods and their persistent war will lead to a shortage of agricultural goods and give us a bullish bias for rice.

RICE FUTURES (ZR1!), H1 Potential for Bearish MomentumType : Bearish Momentum
Resistance : 16.990
Pivot: 16.725
Support : 16.125
Preferred Case: On the H1, with price moving below the ichimoku indicator and within the descending channel , we have a bearish bias that price will rise to and drop from our pivot at 16.725 in line with the 38.2% fibonacci retracement and overlap resistance to the 1st support at 16.125 in line with the 161.8% fibonacci extension and swing low support.
Alternative scenario: Alternatively, price may break the pivot structure and rise to the 1st resistance at 16.990 in line with the overlap resistance, 100% fibonacci projection and 50% fibonacci retracement .
Fundamentals: Since both countries, Russia and Ukraine, are major exporter of agriculture goods and their persistent war will lead to a shortage of agricultural goods and give us a bullish bias for rice.

RICE FUTURES (ZR1!), H1 Potential for Bearish MomentumType : Bearish Momentum
Resistance : 16.775
Pivot: 16.610
Support : 16.040
Preferred Case: On the H1, with price moving below the ichimoku indicator and price breaking the ascending trendline, we have a bearish bias that price will drop from our pivot at 16.610 in line with the 23.6% fibonacci retracement and overlap resistance to the 1st support at 16.040 in line with the 78.6% fibonacci retracement and swing low support.
Alternative scenario: Alternatively, price may break the pivot structure and rise to the 1st resistance at 16.775 in line with the overlap resistance, 61.8% fibonacci projection and 38.2% fibonacci retracement .
Fundamentals: Since both countries, Russia and Ukraine, are major exporter of agriculture goods and their persistent war will lead to a shortage of agricultural goods and give us a bullish bias for rice.

Rough Rice Commodity USASun Storm Investment Trading Desk & NexGen Wealth Management Service Present's: SSITD & NexGen Portfolio of the Week Series
Focus: Worldwide
By Sun Storm Investment Research & NexGen Wealth Management Service
A Profit & Solutions Strategy & Research
Trading | Investment | Stocks | ETF | Mutual Funds | Crypto | Bonds | Options | Dividend | Futures |
USA | Canada | UK | Germany | France | Italy | Rest of Europe | Mexico | India
Disclaimer: Sun Storm Investment and NexGen are not registered financial advisors, so please do your own research before trading & investing anything. This is information is for only research purposes not for actual trading & investing decision.
#debadipb #profitsolutions

RICE FUTURES (ZR1!), H1 Potential for Bearish MomentumType : Bearish Momentum
Resistance : 16.985
Pivot: 16.760
Support : 16.360
Preferred Case: On the H1, price is moving below the ichimoku cloud and has a bearish exit from the ascending channel which supports our bearish bias that when price drops to our pivot at 16.760 in line with swing low resistance, 61.8% fibonacci projection and 78.6% fibonacci projection , there will be a bearish momentum that price will drop to the 1st support at 16.375 in line with the swing low support and 100% fibonacci projection .
Alternative scenario: Alternatively, price may break through pivot structure and rise to the 1st resistance level at 16.985 in line with the pullback resistance.
Fundamentals: Since both countries, Russia and Ukraine, are major exporter of agriculture goods and their persistent war will lead to a shortage of agricultural goods and give us a bullish bias for rice.

RICE FUTURES (ZR1!), H1 Potential for Bearish MomentumType : Bearish Momentum
Resistance : 16.985
Pivot: 16.760
Support : 16.360
Preferred Case: On the H1, price is moving below the ichimoku cloud and has a bearish exit from the ascending channel which supports our bearish bias that when price drops to our pivot at 16.760 in line with swing low resistance, 61.8% fibonacci projection and 78.6% fibonacci projection, there will be a bearish momentum that price will drop to the 1st support at 16.375 in line with the swing low support and 100% fibonacci projection .
Alternative scenario: Alternatively, price may break through pivot structure and rise to the 1st resistance level at 16.985 in line with the pullback resistance.
Fundamentals: Since both countries, Russia and Ukraine, are major exporter of agriculture goods and their persistent war will lead to a shortage of agricultural goods and give us a bullish bias for rice.

RICE FUTURES (ZR1!), H1 Potential for Bearish MomentumType : Bearish Momentum
Resistance : 17.430
Pivot: 16.990
Support : 16.440
Preferred Case: On the H1, price is moving below the ichimoku cloud and has broken out from the ascending channel which supports our bearish bias that price will drop from our pivot at 16.990 in line with the pullback resistance and 78.6% fibonacci retracement to the 1st support at 16.440 in line with the swing low support, 127.2% fibonnaci extension and 100% fibonacci projection.
Alternative scenario: Alternatively, price may break through pivot structure and rise to the 1st resistance level at 17.430 in line with the pullback resistance.
Fundamentals: Since both countries, Russia and Ukraine, are major exporter of agriculture goods and their persistent war will lead to a shortage of agricultural goods and give us a bullish bias for rice.

RICE FUTURES (ZR1!), H1 Potential for Bullish RiseType : Bullish Rise
Resistance : 17.980
Pivot: 17.430
Support : 16.990
Preferred Case: Price is moving within the ascending trend channel and is breaking through the ichimoku cloud in an uptrend momentum which supports our bullish bias that price will rise from the pivot at 17.430 where the overlap support and 23.6% fibonacci pullback to the 1st resistance at 17.980 in line with the 78.6% fibonacci projection and swing high resistance.
Alternative scenario: Alternatively, price may break pivot structure and drop to the 1st support at 16.990 in line with the swing low support and 78.6% fibonacci retracement.
Fundamentals: Since both countries, Russia and Ukraine, are major exporter of agriculture goods and their persistent war will lead to a shortage of agricultural goods and give us a bullish bias for rice.

RICE FUTURES (ZR1!), H1 Potential for Bullish RiseType : Bullish Rise
Resistance : 17.980
Pivot: 17.430
Support : 16.990
Preferred Case: Price is moving within the ascending trend channel and is breaking through the ichimoku cloud in an uptrend momentum which supports our bullish bias that price will rise from the pivot at 17.430 where the pullback support is to the 1st resistance at 17.980 in line with the 78.6% fibonacci projection and swing high resistance.
Alternative scenario: Alternatively, price may break pivot structure and drop to the 1st support at 16.990 in line with the swing low support.
Fundamentals: Since both countries, Russia and Ukraine, are major exporter of agriculture goods and their persistent war will lead to a shortage of agricultural goods and give us a bullish bias for rice.

Long positionROUGH RICE FUTURES (MAY 2022) - Bullish
BUY limit at support: 15.52 - 15.67
Stoploss: 15.40
Takeprofit: 16.42


Where's the Rice. Rice is an integral part of life in many countries, particularly the ASEAN region. It also plays a key role in the economies in the some of world's most populated regions. Countries like Malaysia have seen annual growth in exports of 6.3% annually over the last decade. Rice exporting leaders in the region, Thailand and Vietnam, have also maintained small growth in exports. Statistics show that the consumption of rice within the ASEAN region is also increasing. According to Ricepedia, 640 million tons of rice is grown in Asia, 90% of the global supply.
In 2010/2011 China imported 540,000 metric tons and exported 500,000 metric tons of rice. Ten years later imports swelled to 800,000 metric tons while exports doubled to 100,800 metric tons of rice.
I think getting invested in rice after its next big dip, whenever that is, may be a good idea.
Being interested in the business of food I wanted to have a look at how Rice's price action has looked in years past. I did a little bit of wave analysis here. Let me know where you think we are.
I drew the weekly Fib range retracement and found that a good trade on the larger time frame has taken place with the optimal entry fibs hit and target met.
To get a better understanding of how price moved in the past I noted key Market Structure Breaks on this chart here. They help me find potential OBs and FVGs and potential areas of confluence.
Here is the same wave count but shown on the weekly time frame.
Overall I'm interested in the food sector as an area of investment. Rice was one of the first things that came to mind. Looking forward to doing more research on this.
Let me know what you think!

Rice bull Rice futures at the 1/1 Gann line. The price is coiling ready for the next move up. Probability H. Look for buying opportunities next week.

ZR - Rough Rice / Price Control - In_Flay_Shun not permittedPaddy Rice is the most widely covered spread for an AG Product.
1000+ Cultivars are in Trade within the ZR Instrument.
Global rice production is heavily concentrated between China and India
@ 52.7% annual global output, with the top 5 producers @ 70% of global supply.
____________________________________________________________________
+4 Billion people are dependent on Rice Production and Consumption.
Why RR has underperformed.
Can't have the Peeps revolting.

COMMODITIES - RICE ZR1 - Breakout ImminentLine of Least Resistance determined by Underlying Conditions in my Global Macro Campaign.
Price Action Behavior suggests short attack taking advantage of sellers at previous breakout, to accumulate for next wave... which is building up quickly.
I will know if my suspicions are correct at the median line.
US-China tensions will make the supply scarce, and NATO + allies' free trade agreements are under pressure due to pandemic handling. I speculate a global shift towards domestic production, if not military tensions... Nations will most certainly need to stockpile food!
Other Commodities of interest:
Coffee:
Wheat:
Soybeans:
Corn:
GLHF
- DPT

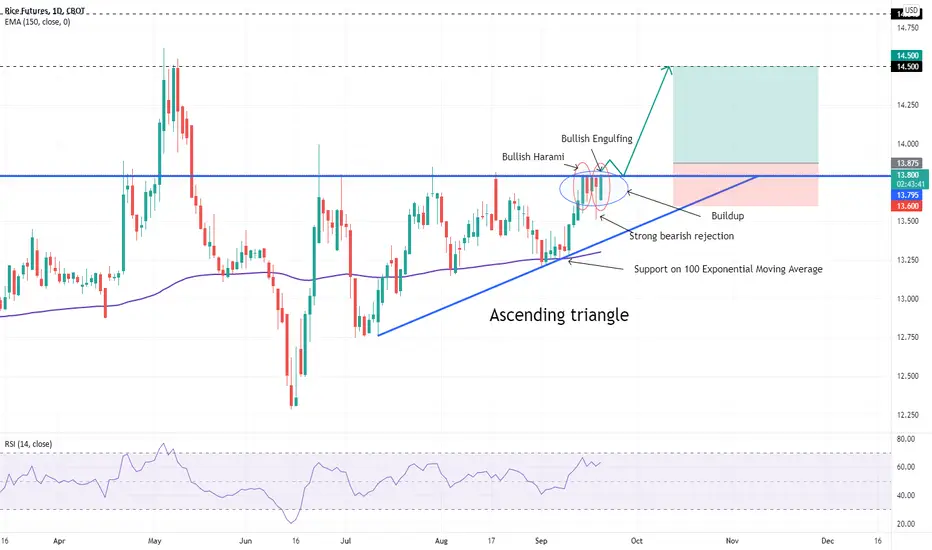
BULLISH ON US RICEBullish clues:
- General uptrend since mid of June
- Ascending triangle , with a strong resistance at $13.795 USD
- Prices are making a buildup , sign of an upcoming strong resistance break up
- Strong bearish rejection of candlesticks on the resistance (buyers are not able to get the price down)
- Bullish Harami and Bullish Engulfing at the resistance
- Relative Strength Index ( RSI ) is above the 50 level, sign of uptrend
- 150 Exponential Moving Average act as a support
Fundamental news:
/
Objective:
If the ascending triangle is confirmed, rice could goes up to the level of $14.500 USD (previous highest).
MAYBE HAVE TO WAIT A PULLBACK AS A CONFIRMATION OF THE ASCENDING TRIANGLE BECAUSE THE RICE MARKET CAN BE TRICKY AND UNPREDICTABLE. But good risk-to-reward ratio possible = 2.27
Feel free to share, comment and give your opinion if it is constructive ;)
DISCLAIMER: This is not investment advice
Melt up --> Bubble top --> insane food prices --> social unrest2008, tech bubble and 1929 all at once.
Food commodities going on parabolic run. Until deflation makes it correct. Then a decade of inflation.
#FourthTurining

BULLISH ON US RICEBullish clues:
- Selling volumes were decreasing
- Price reached support zone at 13.115 USD (demand zone)
- Price crosses upward the 20 exponential moving average
- Price crosses upward the bearish oblique resistance (end of the falling wedge)
- RSI crossed the 50 level
The price of US Rice could reach the strong resistance at 13.455 USD, which is exactly the 23.6% Fibonacci retracement level, to the nearest pips.
Feel free to share, comment and give your opinion if it is constructive ;)
DISCLAIMER: This is not investment advice

Traditional|ZR1!|Long and shortLong and short ZR1!
Activation of the transaction only when the blue zone is fixed/broken.
The author recommends the use of anchoring fixed the blue zone, this variation is less risky.
If there is increased volatility in the market and the price is held for more than 2-3 minutes behind the activation zone after the breakdown, then the activation of the idea occurs at the prices behind the activation zone.
Working out the support and resistance levels of the consolidation zone.
* Possible closing of a trade before reaching the take/stop zone. The author can close the deal for subjective reasons, this does not completely cancel the idea and is not a call to the same action, you can continue working out the idea according to your data, but without the support of the author.
+ ! - zone highlighted by the ellipse is a zone of increased resistance, in this area there is a possible reversal for a correction, please take this factor into account in this transaction.
The "forecast" tool is used for more noticeable display of % (for the place of the usual % scale) of the price change, I do not put the date and time of the transaction, only %.
The breakdown of the upper blue zone - long.
Breakdown of the lower blue zone - short.
Working out the stop when the price returns to the level after activation + fixing in the red zone.
Blue zones - activation zones.
Green zone - take zone.
Red zone - stop zone.
Orange arrows indicate the direction of the take.
Red arrows indicate the direction of the stop.
Priority - The value of the priority parameter implies the author's subjective opinion about the more likely activation zone on this idea, this does not mean that this idea will be 80% activated by this parameter, the purpose of the parameter is to provide for the risk of the inverse of the zone parameter.
Example: "Priority Long: So the author inclines more in the direction of the activation zone open long trades, in this case, when reaching the activation zone in short you should be very careful, because this area may be highly likely to be punched about the breakdown/do not get to take/activate transaction from go to stop."
Please consider this parameter if you use my ideas.
SUM PNL: This parameter displays the total % of all closed ideas of the "new" format (according to the author) for this sector at the time of publication of the idea. The calculation is very "clumsy" just the sum of the profits of all the ideas, based on this indicator, you can more accurately assess the risks when working with my ideas of this sector. I present you the construction of the idea, you can use it yourself as you like based on your subjective view and risks, the calculation of the PNL indicator is carried out only on transactions that the author closed on TV in manual mode or by take.
P.S Please use RM (risk management) and MM (money management) if you decide to use my ideas, there will always be unprofitable ideas, this will definitely happen, the goal of the system is that there will be more profitable ideas at a distance.
