YM (US30, Dow Jones Industrial Aveage) Puts in a Double TopYM (US30) 4 Hour, Fibs: Traded the first bear fib after the double top and saw it trade past its objective yesterday. The Dow has been one of the weaker indices of late, after outperforming most of the year. It didn't even make it up to the 50% line, selling off at the 38.2% line in the initial down move. Then, yesterday, on the rebound, it traded it's halfway back short. ####TRADE ALERT####
YM (DOW 30)
Call: Short
Entry Type: Market 39320
SL: 39500
TP1 / TP2: 38636
################### Normal Size Position - Much Better Entry at A Series Fib with a Much Larger Reward:Risk 900 points of reward:200Points of Risk
Micro E-mini Dow Jones Industrial Average Index Futures
No trades
Market insights

YM ran to 40k without any resistance just like I said it wouldI've been saying for some time now that Dow Jones has _no_ relevant resistance till 40k and now here we are
If that resistance fades quickly then the next relevant resistance is at 45k and probably most retailers will come up with excuses to short it the whole way there also
"But how did you come up with that number?"
See for yourself heh this is a very clear cut chart at such high timeframes not too dissimilar to BTC and XAU
Some very notable calls in recent years:
SPREADEX:NIKKEI and TVC:DJI both to 40k (over 1y in advance)
CRYPTOCAP:BTC pico bottom at 15k and recent local top at 70k
FX:EURUSD pico bottom & TVC:DXY pico top at 115
TVC:USOIL pico bottom at 68
NASDAQ:SMCI mega breakout at 100
NASDAQ:NVDA mega support at 120
NASDAQ:TSLA pico bottom at 105
NASDAQ:NFLX pico bottom at 165

MMSM US30, Friday April 15thIf you look at the 4HR, US30 made a clear Smart Money Reversal, and we are going for a second phase distribution, aiming towards Previous Monthly Low, & external Sellside liquidity. We also have a bullish Fair Value Gap below that external liquidity, which could indicate a point of reversal where the sell program would be done.

Dow Jones Non Farm Payroll Day Trading GameplanI will try to formulate a gameplan for Friday's NY session for a possible day trade
Starting with the daily chart
Price was in a spike and channel pattern that just got broken out of with its 850 point drop from its high of day.
This is a sell signal for people that trade the daily chart.
Thursday surged off of the daily 21ema and the 21ema is now curling down. This indicates downside momentum.
Next up is the 30 minute chart
Price was basing near the lows of the channel. Price bumped its head up against the 30 minute 200sma and sold off to create the daily breakout candle.
Using range expansions, Thursday's price hit the 1 full expansion as noted by the teal line. This also so happens to be the price that Friday opened up at to the dot.
I will be looking for any green bars under the declining 30 minute 21ema to be eliminated by red for an entry short for the continuation down to either 1.5 or 2X range expansion. I don't know which one and so will pick the 1.5X to be conservative.
The setups will look like this
Using the 30 minute chart as my guide, I will short the lows of any green body's candle that pulls back into the declining 21ema

S&P 500, Nasdaq close slightly higher after soft services sectorThe S&P 500 and Nasdaq closed higher on Wednesday after data showing the U.S. services industry growth slowed further in March, but the advance was limited after Federal Reserve Chair Jerome Powell indicated a cut in interest was still not in sight.
Most of the major S&P 500 sectors advanced, led by gains in energy materials and communication services .
Powell reaffirmed in a speech on Wednesday that the Fed will stick to its wait-and-see approach as it considers when to start cutting rates given the continued strength of the U.S. economy and recent higher-than-expected inflation data.

A Review of Trades of Day 3 Day TRading ChampionshipUS30
BAD:
1.)Forgot to check NEws then TRaded before news: Rookie Mistake
2. )Didn't have a stop loss in place at 10am due to thinking time was available for a stop order and did not check news. News hit at 10am and ran the market higher while in a sell. Horrible trading execution.
3.) Got up from a trade due to a phone call distraction and have to move stop loss into a protective stop. lessing profits.
4.Lost 1,000 today
5. didn't allow day to materailize and stop hunt all three sessions at the end of day.
6. didn't wait for 9:30 to open and allow 30 Min to close. (10am news)
Good
1: Scalped 3 trades at the end of day for 10 Pips each, quickly moving stop loss into break even or profit off of prime levels. levels were low round number to low, and close to high roundd numbers. 10 pip scalps.
Correct about thesis needed to have more patience.
2: Protective stop +40 Pips

3rd DAy of the World Cup Trading Day trading competition3rd Day trading was rough. Missed opportunities and human error has caused some imperfect trades which cost us Money. Trading account in recovery mode only on Day 3!!!


Thought on US30Hello. I am the forescastah. We are all in some form our fashion. We try to use ours minds to predict price movement. Here are some of my thought on US30 today as we trade the third day of the world cup of Trading.

Rally Would Setup High RR Short.Markets have been selling hard recently. Done well with shorts but starting to feel it's a bit too easy.
Would be much more comfortable shorting into a rally.
This may or may not come, but at this point we can prep to trade momentum setups long if the bear move fails and then plan the retracement trade.

YM - Weekly Range AttackWe kept it short and sweet last week and my short term projections delivered just before reversing to current price now @ 40,140.
YM trading back into the median of the weekly range is still considered as a healthy retracement in a overll bull market.
It's also in-line with ES short term shorts.
My philosophy is simple...
Fortify Michael J Huddlestone's concepts that I have studied to consistently predict where the market is more likely to go.
This includes;
- Market Structure
- Buyside/Sellside Liquidity
- Order Blocks
- Liquidity Voids
- Fair Value Gaps
- Optimal Trade Entry
- Premium/Discount Array
- SIBI/BISI
- Many More!
The strategies mentioned here are some of many that I use to implement into my analysis and over time, with consistency I aim to achieve a high degree of accuracy in the markets with the foresight and understanding to assess what went wrong when my bias is negated.
Credits;
- Michael Joe HUDDLESTONE
- Shawn Lee POWELL
- Toray KORTAN

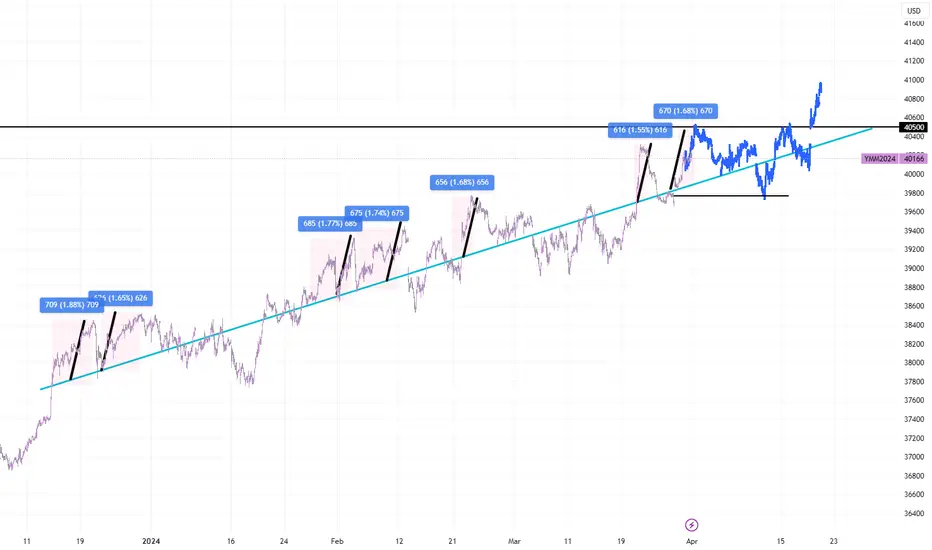
Dow Jones YM Weekly Day Trading Gameplan AprilUsing the teal line as the mean, every time price moves roughly 650 ticks above the mean, it snaps back.
We are pushing off the mean now and I believe will continue bullish up to 40,500 which is roughly 650 ticks above the mean.
Monday I expect a bullish continuation higher.
After the move is complete, I will be looking for the revert back to the mean. I don't know if it will move below the mean or not.
The move below the mean will be able to close that gap to the downside
The average range of a monthly candle is roughly 2500 ticks from high to low
Dow Jones Bullish Mean Reverting The Hourly Chart's 200sma is the same as the Daily Chart's 21ema
Price is mean reverting back and forth between the mean
Price is above the Hourly 200sma/ Daily 21ema, Bullish
Price does not respect the Hourly 21ema and trades back and forth between it.
The Hourly 21ema is the same as the 5 Minute's 200sma
The 5 Minute mean reverting back and forth above the Hourly 200sma. It seems to me that each move in the extreme position should not be trusted
I need to figure out when a move will continue with the 5 minute 21ema or will mean revert back to the 5 Minute 200sma.

YM1! - Keeping It Short, Sweet & SimpleSimilar to ES1!, I am expecting next week to be forgiving as we have seen a huge bullish run to 40316 without a retracement to the weekly EQ @ 39703 which I do believe is a strong possibility.
Any major movements, I will update this analysis.
39767 is t1
39703 is t2
My philosophy is simple...
Fortify Michael J Huddlestone's concepts that I have studied to consistently predict where the market is more likely to go.
This includes;
- Market Structure
- Buyside/Sellside Liquidity
- Order Blocks
- Liquidity Voids
- Fair Value Gaps
- Optimal Trade Entry
- Premium/Discount Array
- SIBI/BISI
- Many More!
The strategies mentioned here are some of many that I use to implement into my analysis and over time, with consistency I aim to achieve a high degree of accuracy in the markets with the foresight and understanding to assess what went wrong when my bias is negated.
Credits;
- Michael Joe HUDDLESTONE
- Shawn Lee POWELL
- Toray KORTAN

YM Wednesday Big Sell Off Day? Fill In Gap At 39,150? 600 ticksA couple of pieces of information that I think will cause a sell off down to 39,150
A declining Hourly 21ema
A gap at 39,150
A rising 200sma that has been poked through last two times
Ramped volume from the FOMC
600 ticks seems really excessive for one session. Maybe two sessions.
Do I go for the throat and hold for a massive trade or do I take the base hit 2 to 1?
I don't want to be greedy but I also don't want to leave money on the table.
Maybe I will go in the middle just watch each hourly candle and close it when I see a fat red candle exhausting itself

Micro DOW Late Night Trade Setup4 hour chart: trend, cycle, and momentum are all up.
1 hour chart CCI is above +100 and the trend is up
15 min chart: trend is up and support is at the 50 SMA this is also the 50 SMA on the 1 hour chart
1 hour demand zone RBR formation
$200 risk with 5 contracts

YM Dow Jones In State 4 Pullback to Mean (Bullish Position)The market only moves from narrow to wide states and repeats. Currently, the market is in state 4 out of the 5 states.
State 1: Narrow state before the move higher ( Narrow )
State 2: The trending move higher ( Trending )
State 3: The expanded move away from the mean ( Wide )
State 4: The reversion back down to the mean ( Trending )
State 5: The narrow state again prepping for the next move higher ( Narrow )
The past 6 times the market has been in its pullback state 4 phase, the hourly 21ema has been at a 34-53 degree angle declining
The hourly chart is in positive position due to it being above the 200sma and trending bullish

Improving Market Cycles and StagesI need to get better at
1. Identifying what state the market is in
2. What number 1-5 in the cycle it is in
3. Avoiding numbers 1,3,5
4. Only trading in cycles 2 and 4
The market only goes between narrow states and wide states
My strategy is the 21ema and the 200sma
I use the 5 minute, the 15 minute and the 1 hour timeframe for Intra Day Trading
I tend to use 50 tick stops and 100 tick targets for a 2:1 most of the time
My biggest issue is not trading in the direction of the 21ema

Dow Jones Week 12 Day Trading Gameplan Hourly AnalysisLooking at the week ahead on the hourly chart, the first thing I notice is that the hourly 21ema is now trending down and declining. The hourly 200sma looks to remain flat and a cross is set to happen later in the week.
I am looking for a pullback into the declining 21ema, whether it stalls right at it or pops above it by a little bit.
I see two spots on the downside where stops are located. One at March 5th and 11th at 38,900 and the second at February 21st at 38,800. Logically if it will take out the first then the second is just right there as well.
The average true range of a weekly movement is between 850-1000 points on the Dow.
Since the 5 minute 200 is the same as the hourly 21, I will be looking for sells under both.
I expect the 5 minute 200 to be choppy and price will go back and forth between it. I will sell any move above it and buy if extended below it. I will use the 200sma on the 5 minute as the mean to revert back to.
On the 15 minute chart, price has been trending down off of a declining 15 minute 21ema and has created a cross on Friday. Any move up to the flat 200 or a peak above will get sold into. Price will have to slice through it to the upside by a large amount in order to become more bullish
In summary, I will be only looking for shorts and will sell into any pullback higher unless I see a strong bull move higher to slice through that 15 minute 200sma. Since price is in a negative state as indicated by below the declining 21 and under a declining 200, I will be giving the benefit of the doubt to a down trend and only look to sell.

YM - Volatile Week My philosophy is simple...
Fortify Michael J Huddlestone's concepts that I have studied to consistently predict where the market is more likely to go.
This includes;
- Market Structure
- Buyside/Sellside Liquidity
- Order Blocks
- Liquidity Voids
- Fair Value Gaps
- Optimal Trade Entry
- Premium/Discount Array
- SIBI/BISI
- Many More!
The strategies mentioned here are some of many that I use to implement into my analysis and over time, with consistency I aim to achieve a high degree of accuracy in the markets with the foresight and understanding to assess what went wrong when my bias is negated.
Credits;
- Michael Joe HUDDLESTONE
- Shawn Lee POWELL
- Toray KORTAN

Why i expect Dow Jones to drop with Powell todayTodays the interest rate decision.
Powell already signaled, that we will not cut rates too early (they already did that in 1970 and the inflation spiked then).
With lasts weeks Consumer Price Index Inflation data (0.1% higher then expected), FED will most likely NOT CUT the interest rate today.
Stocks will react on that by selling off (because interest rate stays high). I estimate the same picture as we had last time. A strong sell off over 2-3 hours. Then market settles and the bullish investors come back with buy opportunitys.
I will look for buy trades today if any opportunitys occur.

The 1 Hour Chart ETH is the same as the 15 Minute RTH ChartThe 1 hour time frame on the ETH chart is identical to the 15 minute chart on the RTH session chart.
I prefer the RTH session chart due to the cleanliness of the price action.
15 Minute RTH
1 Hour ETH

YM - Big Dog Leading The PackYM has been frontrunning the market, with all-time highs printing on the 23rd of Feb 24 and this Fridays close being a short term high @$39,008.
$38,399 is where my interest is drawn to with $38,323 being the intermediate EQ which I aim to target.
My philosophy is simple...
Fortify Michael J Huddlestone's concepts that I have studied to consistently predict where the market is more likely to go.
This includes;
- Market Structure
- Buyside/Sellside Liquidity
- Order Blocks
- Liquidity Voids
- Fair Value Gaps
- Optimal Trade Entry
- Premium/Discount Array
- SIBI/BISI
- Many More!
The strategies mentioned here are some of many that I use to implement into my analysis and over time, with consistency I aim to achieve a high degree of accuracy in the markets with the foresight and understanding to assess what went wrong when my bias is negated.
Credits;
- Michael Joe HUDDLESTONE
- Shawn Lee POWELL
- Toray KORTAN
