Timing the Next Move with 4 IndicesThroughout the entirety of last year, it was a period marked by bearishness, and I believe that many of us have forgotten about it. However, at the beginning of 2023, the market suddenly shifted to a bullish trend.
There are three reasons attributed to the bullish trend during the first and second quarters:
1) The onset of an AI rush.
2) The apparent taming of inflation.
3) The resolution of the bank run crisis in March, which seems to be under control for the time being.
In this study, we will examine how to time the next significant market move or identify a change in trend using these four indices.
Reference for trading:
Micro E-mini S&P500 & Options
Minimum fluctuation
0.25 index points = $1.25
Micro E-mini Nasdaq100 & Options
Minimum fluctuation
0.25 index points = $0.50
Micro E-mini Dow Jones
Minimum fluctuation
1.0 index points = $0.50
Micro E-mini Russell 2000
Minimum fluctuation
0.10 index points = $0.50
Disclaimer:
• What presented here is not a recommendation, please consult your licensed broker.
• Our mission is to create lateral thinking skills for every investor and trader, knowing when to take a calculated risk with market uncertainty and a bolder risk when opportunity arises.
CME Real-time Market Data help identify trading set-ups in real-time and express my market views. If you have futures in your trading portfolio, you can check out on CME Group data plans available that suit your trading needs www.tradingview.com
Micro E-mini Dow Jones Industrial Average Index Futures
No trades
Market insights

YM Good reasons to go up and to go downGood reasons to go up and to go down. Futures like gap fills, we shall see..

US30 (YM1!) Intraday trade - SHORTThe US PCE has released, and it is unchanged.
Personal income is also down.
What does this tell us? Inflation is slowing down, and we can also start to be confident of this new reality as the last few weeks of data have been on the downside for the US economy.
As people will have less money to spend, and credit conditions worsen, the US30 should see some outflows from investors.
Technically, US30 has entered a mid term historical rejection zone.
Below that, we a zone - highlighted in purple - which is essentially no mans land. No significant support has been built in this area, so price normal moves decisively to one side or the other.
Look to enter a BREAKOUT SHORT underneath the current 4HR candle.
DO NOT enter straight away. Wait for the rejection and THEN ENTER.

DOWN DOWShort Dow at current sell zone level 33350-33420. Look for further breakdown to the 1.27 fib level on a 30 min time frame
SL 34890
TP 33890

US30 (YM1!) Intraday trade - SHORTUS30 is now retesting the STRONG support zone it broke. This zone was formed over the past few days, so I am expecting a rejection.
Look to enter a BREAKOUT SHORT below the current 1HR candle.
Again, DO NOT FOMO into a position now. Allow the price to reject before jumping in.
Remember, aim to make good trades, protect your profits and then think about making a gain after that.

How to identify a trend move using AnchorsIn the video I discuss the concept of Anchors in trading and how I use them in my own trading.
Anchors play a major part in identifying the prime areas to trade and also in risk management when in a trade. I will discuss my prime setups and trading areas using anchors and multi-timeframe analysis.
** If you like the content then take a look at the profile to get more daily ideas and learning material **
** Comments and likes are greatly appreciated **


US30 (YM1!) Intraday trade - LONGThe recent news release was bad for the US dollar.
As stocks are inversely related to the dollar, we should see a push up.
Looking for a BREAKOUT TRADE above the neutral pivot aiming for R1.

US30 (YM1!) Midterm trade - LONGLooking for a break up out of the descending triangular pattern on the 1HR.
Jackson hole is this week and the FED will need to decide which way the market will go.
Historically, there is a rally towards the end of the year for stocks ( around the end of August ), before a drop in Christmas.
Enter with a smaller lot size to accommodate for the bigger stop size.

Dow Futures (YM_F) Looking for Corrective Rally SoonShort Term Elliott Wave view in Dow Futures (YM_F) suggests that cycle from 7.27.2023 high is mature and about to complete soon as 5 waves impulse. Down from 7.27.2023 high, wave ((i)) ended at 35076 and rally in wave ((ii)) ended at 35660. Index extended lower in wave ((iii)) as another impulse in lesser degree. Down from wave ((ii)), wave (i) ended at 35115 and rally in wave (ii) ended at 35456.
Index extended lower in wave (iii) towards 34328 and rally in wave (iv) ended at 34709. Final leg wave (v) ended at 34308 which completed wave ((iii)). Rally in wave ((iv)) ended at 34645 as a zigzag structure. Up from wave ((iii)), wave (a) ended at 34605, wave (b) ended at 34465, and wave (c) higher ended at 34645 which completed wave ((iv)). Down from wave ((iv)), wave (i) ended at 34307. Short term rally should fail in 3 or 7 swing against 34645 for further downside within wave ((v)). Once the 5 waves decline ends, it should complete wave A in larger degree. Then the Index should rally in wave B to correct decline from 7.27.2023 high in 3 or 7 swing before the decline resumes.

Dow 4hour = pick low size buy with SL in lowif news not come, we will see up trend soon to Fino 61%
if you have old buy, must put hedge selstop in low( break low= new downtrend)
if you have old sell,you must hedge them now and wait 3 week for next trendline break to down
good luck

#DowJones #US30 Action Areas For The Week AheadIn this update we review the recent price action in the emini DowJones futures contract and identify action areas for the week ahead and price objectives to target
•Past performance not indicative of future results

CBOT DJIA5 SEP23 (SHORT)My view and analysis for CBOT DJIA5 today is bearish and this is because the price constantly doing lower low and keep breaking the supports in low timeframe.

Another bullish flagI just jumped in here, DOW futures. Another bullish flag ready to break out to test the 3600 zone. You can buy calls too but would to wait until session opens.
Look how the price is pushing the flag resistance, I think is going to break at any moment.

#DowJones #US30 #Action Areas For The Week AheadIn the is update we review the recent price action in the emini DowJones action areas and price objectives for the week ahead
•Past performance not indicative of future results

The Great Depression of the 2000's?Nearly a century ago, financial markets around the globe experienced a cataclysmic drop, the infamous Great Depression. Today, as we stand on the precipice of economic uncertainty, I can't help but draw parallels between the cyclical patterns of yesteryears and our current economic landscape.
Despite rising interest rates, the Consumer Price Index (CPI) remains stubbornly high, ushering in an era of stagflation. The lavish use of the FDIC fund to bolster banks like SVB has only fanned the flames of inflation, and its repercussions are palpable among the masses.
But here's where the plot thickens: Fitch, in a move that sent ripples across the financial world, downgraded the U.S. sovereign rating from the coveted AAA to AA+. While the markets might have taken this in stride, the implications are far from trivial. This isn't just about numbers on a spreadsheet; it's about the very reputation of the U.S. on the global stage. The last time we saw such a downgrade, in 2011 by S&P, the aftershocks were felt far and wide.
The reasons cited by Fitch, notably the "deterioration" of the country's finances and the "erosion of governance," are not revelations but rather confirmations of what many have whispered in hushed tones. The political chasm that has been widening for years now seems to have finally caught the eye of rating agencies. Yet, amidst this turmoil, the U.S. dollar stands tall, a beacon of hope in turbulent waters, still regarded as the world's premier reserve currency.
However, the real concern lies not in the immediate aftermath but in the long-term ramifications. The downgrade, while not a death knell, is a stark reminder of the fiscal challenges the U.S. faces, from funding Social Security and Medicare to bridging its ever-widening political divides.
A potential trigger for a decline in the Dow could be everyday individuals feeling the pinch, retiring early, or tapping into their 401(k)s to navigate the rising costs of living. The advent of advanced technologies, like GPT, has only exacerbated the turnover rates for workers in their 50s and 60s. I foresee a trend where these workers might opt for early 401(k) withdrawals or early retirement, further straining the economy.
In this tempest of economic uncertainty, I predict the following for the Dow: Target 1: 34,000, Target 2: 31,500, Target 3: 21,300. As we navigate these uncharted waters, it's crucial to remember that while history often rhymes, it doesn't always repeat.
ECONOMICS:USCCPI FRED:DJIA TVC:DJI

DOW update 2= if low break,Dow will go down very low size = put sellstop in last low possible and wait for buy above green arrow(filo 61%)
I belive main trend going to 38000 so be careful from sell, ,,,if you have old sells,you must hedge them near green arrow
good luck,wish you pick profit

#DowJones #US30 Action Areas For The Week AheadIn this update we review the recent price action in the emini DowJones and identify potential action areas and price objectives for the week ahead
•Past performance not indicative of future results

Dow 4hour say = near Fino 61 pick buy Frist wait buy pinbar comes then buy
strongly advice don't pick sell ,Dow can go to 38000
good luck

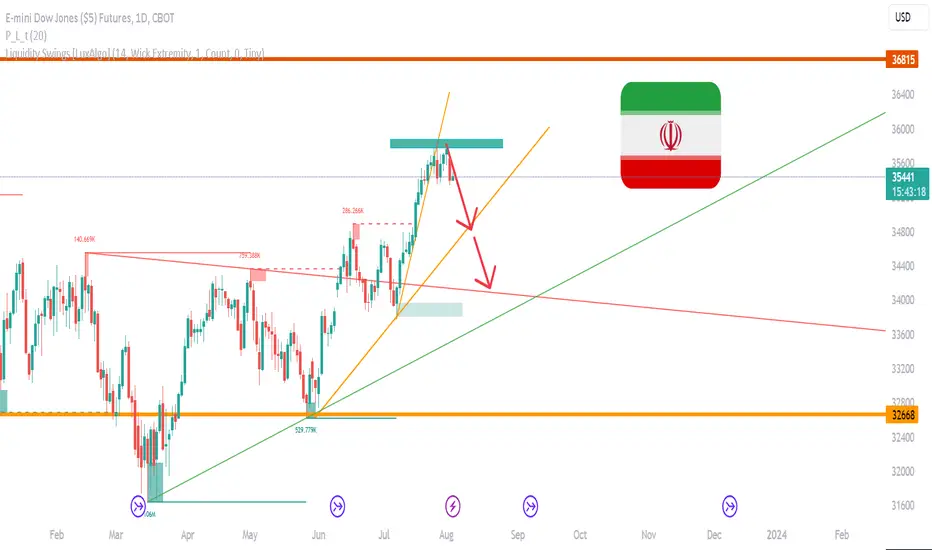
E-Mini Dow Jones SHORTThis is my analysis and prediction for the upcoming week ahead. The chart looked bearish on mid-term while still in a bullish mood in the bigger picture. The support zone will be tested and for now it is time to go short.


The start of the Dow Jones crashIt is very likely that the Dow Jones correction started from this position
#DowJones #US30 Action Areas For The Week AheadIn this update we review the recent price action in the emini Dow Jones and identify action areas for the week ahead and price objectives to target
•Past performance not indicative of future results
