Dow Jones Week 3 February Gameplan Bullish Pullback 44,500 Going into next week, I am looking for a consolidation/layering into the middle of the range and into 44,500. If price sets up, I will look for the Long back up.
In my opinion, I believe price to not return back under February's open, notated in orange. Price should stay above the middle of the range if it will break out bullish.
After the break bullish, I will then expect price to layer into 45,000 as support. But I won't get ahead of myself just yet. Need to wait until we get to that point.
Using the monthly chart as a visualization, this month should end on a strong note.
MYM1! trade ideas


High of Week 4 to 1 Trade Idea Friday DumpI am expecting price to pull back bullish into my resistance area of around 44,600. Price is still in its bearish move from the high of the range down to the low of the range. Currently, price has been chopping around the middle of the range this week.
This will be my last trade opportunity of the week. I want to see how price reacts into resistance. I will enter if opportunity presents. I will use a 75 tick stop and 300 tick target for a 4 to 1. I feel like the week will end up closing near the low.
The trade I took today ended up in a loss. I was expecting price to pullback and continue short today. Because it is in a range, anything could have happened. I gave it a shot and the trade failed.

Dow Jones (March 2025) - Leading The Stock Index PackAs of recently, YM have been seen stepping outside of the usual correlation ES and NQ would have as YM is presenting me with lower prices for the week than Nasdaq and ES indicating that further downside movement is possible this week.
Just like the rest of the market, there is a lot of indecision based on the tariffs Donald Trump is waiting to implement and we are seeing the splitting image of human psychology for YM. Investors and traders are currently unsure.

Dow Jones 3 Month Candle Bullish Close Near HighsLooking at the 3 month chart of Dow Jones, with a little under 2 months to go until the close of the current 3 month bar, I believe it will close near the highs. The last 3 month bar was a reverse hammer, a very bullish candle and a buy signal.
This current week's candle gave me a huge clue as to what will most likely happen next. It is creating a gap spacing between multiple candles to get engulfed by a huge bull candle.
On the Daily chart
The 8 Hour chart is flagging in a bullish consolidation building up right under the break of the highs for 46,000
Weekly Market Forecast: S&P, NAS & DOW Are Still Bullish!This forecast is for the week of Feb 10-14th.
The S&P500, the NASDAQ, and the DOW JONES are still bullish overall, despite last weeks NFP news that saw the markets move lower. Until there is a bearish break in market structure, it is buys all the way. Let the markets reach the buy zones and wait for the bullish market structure shift. That is the time to take valid buy setups.
Enjoy!
May profits be upon you.
Leave any questions or comments in the comment section.
I appreciate any feedback from my viewers!
Like and/or subscribe if you want more accurate analysis.
Thank you so much!
Disclaimer:
I do not provide personal investment advice and I am not a qualified licensed investment advisor.
All information found here, including any ideas, opinions, views, predictions, forecasts, commentaries, suggestions, expressed or implied herein, are for informational, entertainment or educational purposes only and should not be construed as personal investment advice. While the information provided is believed to be accurate, it may include errors or inaccuracies.
I will not and cannot be held liable for any actions you take as a result of anything you read here.
Conduct your own due diligence, or consult a licensed financial advisor or broker before making any and all investment decisions. Any investments, trades, speculations, or decisions made on the basis of any information found on this channel, expressed or implied herein, are committed at your own risk, financial or otherwise.

Trade Management Strategy Testing Dow JonesI will be trying out a new holding style for my trades going forward based on my journal and statistics. Instead of having a fixed target, I will instead hold my trades all the way until 04:00pm market close.
Pros:
Letting trades run. I don't know how far a trade will go. By not having a strict target, I can lock in those big running days.
Not stressing over if it will hit target. By not having a strict target, I can just let price do what it is going to do and close my day trades at 04:00pm. I don't have to worry about if it is only 10 ticks away from my target.
Allows me more freedom to use my time elsewhere. By not having a strict target, I know all my day trades will be closed by 04:00pm. I will set an alarm 5 minutes before 4 to close any open positions. I can then use my time more productively instead of being at the screen.
Cons:
Giving back profits. I know by not having a strict target that I can be up a certain percent and by the end of day close, any/all profits can be gone and or stopped out.
Can have a lot of small wins/losses and Breakevens mixed with the occasional stop out and giant win. Since I have no target, I have no control over how much profit I may make in a given day. Someone with a fixed target knows they are getting out at 2:1 for example.
Below is an exact trade I have taken using strict target of 200 ticks.
Using End of Day Hold the trade would look like this
200 ticks vs 553 ticks
This is just one example, and my journal shows countless more just like this.
If anybody has any thoughts or experience with this holding style, I would love to hear feedback.

Dow Jones 50% Crash In 2027???This post is purely speculation, and I will admit I have no idea what is to come. Just was doing some research and study and I happened to see a striking number of similarities between 2007 and supposed 2027.
2007
2027
Please let me know your opinions. Am I smoking something here? Are they really planning on dumping after 48,000?

Dow Jones Weekly Chart Two Legged Pullback In 2025 Open SupportI am seeing a two-legged pullback forming on the weekly chart with a possible higher low forming at the 2025 open. To me, it is looking like price is rolling over from 45,000. Of course, what I would need to see is an engulfment candle next week to confirm. Once and IF this happens, I will be looking for price to slow down and layer into the 2025 open for the bullish bounce.

Dow Jones February NFP Going In BearishThursday on the Daily chart flashed a sell signal for a rejection off of 45,000. I am going in Friday with a bearish bias. Of course, I have no idea what will happen and could always be wrong. To me, this makes the most sense. A sell off to close the gap.
From 45,000 down to 44,300 is a 700 tick move, not unreasonable for a NFP day.
Notable profit targets:
Thursday's Low: 44,658
Weekly Open: 44,570
Wednesday's Low: 44,463
Tuesday's Double Bottom Low: 44,350
Monday's Unmitigated Wick: 44,310

Bullish Pullback Into SupportAfter Yesterday's fumble, on to a new day. I will be looking for a pullback into support marked by the green lines. I was expecting price to retrace a bit more before it bounced but it seems the market decided to bounce yesterday at the weekly open. I can't argue with the market; I can only react to what it does.
I am only interested in finding a buy trade inside of my support area and the next target will be a break of the highs.
720-820 area for support
Next resistance is honestly not here. After the break of the prior highs, we are back into all-time highs and 46,000 is a target.
Yesterday, I decided to try for a short trade back down into support. The trade went 275 ticks for me before rolling over. I am ok with that because my job is to just execute the trade and manage my risk. What the market does after my entry is out of my hands. The market decided that support was at 44,475 and bounced.
Scenario 1:
Pullback into support
Scenario 2:
Price just continues higher and breaks the high from here
Scenario 3:
Price continues, stopping at the highs, pulls back to 45,000 area for support and breaks the highs

Dow Jones Bullish Scenarios for 2/6Two Ideal Morning Scenarios:
1️⃣ Price dumps to the January FOMC level , then forms a W concept, launching it past 44,400+.
2️⃣ Price drops to the 44,000 support zone before reversing for a pump beyond 44,400+.
If we open in these zones, it sets up a golden buying opportunity for all of us.
Let’s lock in!

Dow Jones Range Forming Between 44,000 and 45,000Outlined below, I have a range forming from the Monday Initial balance. The three price levels to watch are:
the weekly open (44,566)
50% of the range (44,393)
the bottom 25% of the range (44,154)
And of course, the high and low of this range. Where does price intend to go first?
I am looking for the weekly open to turn into resistance
I am looking for the low formed at the 50% of the range to be a target to get hit
I am looking for the bottom 25% of the range to act as a major support buy
Currently, in this exact moment, price is in the top 75% of the range and to me, this means No buys and in selling territory. Tuesday opened with a gap up and immediately sold down to the 50% of the range. It then did a creeping trend, grinding higher in a pullback back up into the top 75%. Because of the creeping trend, the low at the 50% and price being in the top 75%, I will find a shorting opportunity and target that low at 44,353

Head and shoulder topLooks like a H&S top playing out. If confirmed, would be the second peak in a double top.

Dow Jones Weekly Template Gameplan February Week 1Now that I have seen Sunday opened and gapped down, I am more inclined to see a bounce off of 44,000 for the gap fill back up to 45,000. I am expecting shorts to get trapped down low right into the middle of the range for the trap and shift.
Either Monday or Tuesday to form the low. This is of course the market doesn't blow right through 44,000 and head down to 43,000 first. I have no clue, just opinions. I will be trading what I see form in front of me.

DowJones Trade ideaAfter a selloff last Friday and today a huge gap at the open, my bias will be based on the price action. Since the price is inside the consolidation phase, I will be waiting for a break on either side to plan a trade, as marked up in the chart.

Dow Jones (March 2025) - End of January AnalysisSimilar to Nasdaq and S&P, although we have closed bullish for the month, Donald Trump has made an announcement that tariffs will be placed in Mexico, Canada and China at a rate of 25% & 10%, which the market did not seem to like on the Friday.
Intraday timeframes tell a different story to what the macro market structure is dictating.
Short term, we could be in for a bearish retracement, rooting out all the stubborn traders who have a medium to long term trade on whilst trailing their stop.
Very interested this month with how YM, NQ and ES delivers.

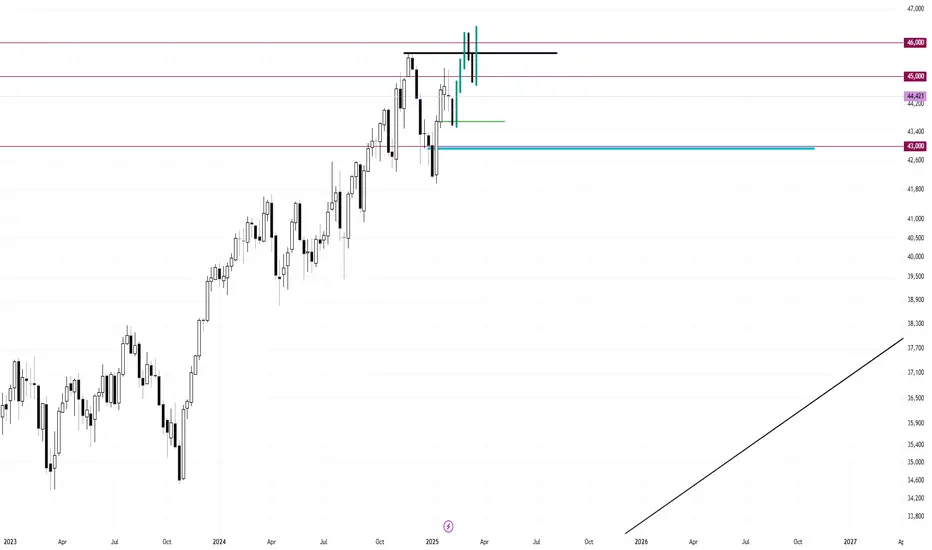
Dow Jones Range Structure 42,000-46,000 Since September 2024, price has been in a 4000 tick range with 44,000 being in the middle.
Currently, price just bounced off of 45,000.
Support is down in the 42,000 range
Resistance is in the 45,000-46,000 range
Key levels I am looking for is what price will do in the middle. Will it bounce or just go right through? I am also looking at the 2025 opening price and how price will bounce off of it.

Dow Jones February 2025 Monthly GameplanI am looking for a retrace back down to 2025's open price of 42,934 as notated in cyan blue line. After which, I am then looking for the bullish continuation to take out the highs and land around 46,250 zone. The average bullish monthly candle is 2500-3200 ticks using ATR. If price retraces to the yearly open and rallies from there with 3200 ticks, it will reach 46,250. That is my thought process.
Using the 2 Hour, price has been consolidating around 45,000 before rejecting on Friday.
Everything lines up to the tick. The first move higher and the subsequent measured move to the 2nd range expansion is 3200 ticks from high to low. The low from CPI is ripe for the taking.
Of course, this is in preparation in what I believe to be a 20% drop from 48,000 down to 38,000. This trend is far away from the yearly trendline and a pullback to 38,000 would be PRIME buying.

Dow Jones (March 2025) - Bullish Price DeliveryExplosions will hit the market very soon.
The question is....
Will you get hit?

Dow Jones Day Trading Idea ( Breakout/ Pullback ) 45,000 AreaNow that price broke out of 45,000, I am looking for the pullback into 45,000 area/open price area for the breakout/pullback.
The bias today is obviously bullish and can possibly hold until the close. Target area of 45,300

Dow Jones (March 2025) - Trump Has Dow Jones In A Headlock!Happy new year traders!
This is a perfect time to do a review on the Dow Jones continuous contract and YMH (March 2025) contract as it's the 1st month where you see the beginnings of the 6-Month candle form, which can be very powerful for gauging a bias.
With S&P 500 & Nasdaq frontrunning Dow Jones, a close eye must be kept on YM as it might eb the first symbol out of the three stock indexes that decides to capitulate. If that occurs, there's a high chance the others will follow suite.

Dow Jones Thursday Pullback Continuation Day TradeI am looking for a High of Day to be put in place. Then a sell off into the gap support for a pullback. I don't anticipate price to break the low of Wednesday's peak formation low after CPI.
I am looking for NY to open lower before the bullish reversal at said level. I am then expecting price to not only take out the high of day but the range high as well (43,775). This will give Dow a 0.75% gain on the day.
