When Indexes Disagree: Evidence-Based Clues Heading Into 2026Market Context: Why Futures-Based Index Analysis Matters
When equity markets approach historical extremes, surface-level price action often hides important structural information. This is especially true when analyzing cash indices alone. Futures markets, by contrast, provide continuous pricing ac
Dow Jones Futures, E-mini
No trades
About E-mini Dow Jones ($5) Futures
E-mini Dow Jones ($5) futures are derivative contracts with the Dow Jones Industrial Average (DJIA) Index as an underlying asset. These mini futures are electronically traded and give investors exposure to the US stock market through 30 US blue-chip companies, but they represent only a portion ($5) of standard Dow Jones futures, which makes them more accessible. Since these are still futures, traders use them to hedge their stock portfolios against risks that are inevitable in markets.
Related futures
YM | Week 1 | 1hr chartT.A explained -
BackSide (BS)
FrontSide (FS)
Inverse BS (Inv.BS)
Inverse FS (Inv.FS)
BS & FS levels are expected support when dashed lines, tested when dotted and resistance when solid lines.
The inverse is true for the Inv. BS Inv. FS levels, they are resistance as dashed lines, tested as dotted

yearly chart replay'sStarting on YM, I add a couple levels and talk about the chart breifly then I look at IYLD MorningStar ETF yearly chart replay, RBLX yearly chart replay, RIO, & RMCF yearly chart replay's
There are 4 candles which create 6 level which illustrate market structure. I don't even use all 6 at a time.

YM | Week 52 | 1hr chartT.A explained -
BackSide (BS)
FrontSide (FS)
Inverse BS (Inv.BS)
Inverse FS (Inv.FS)
BS & FS levels are expected support when dashed lines, tested when dotted and resistance when solid lines.
The inverse is true for the Inv. BS Inv. FS levels, they are resistance as dashed lines, tested as dotted

us 30 chart analysis dow march 26 futures analysis.sorry guys I realize I have to buy another microphone cant hearme but you can see the analysis

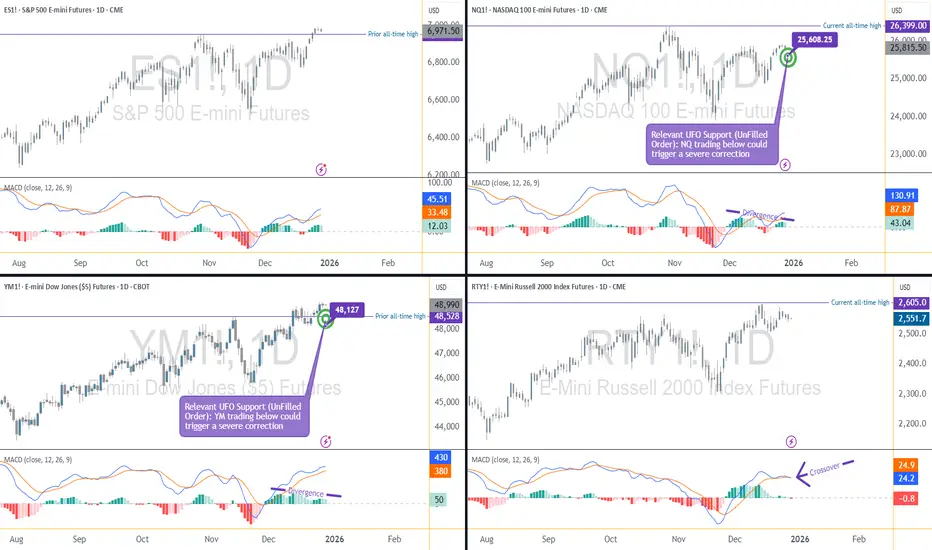
YM at All-Time Highs: Key Levels for Continuation or RotationUnderstanding YM and the Current Market Environment
The Dow Jones Industrial Average futures contract, commonly referred to as YM, represents a price weighted index composed of 30 large, established U.S. companies across industrials, financials, healthcare, and consumer sectors. Unlike the S&P 500

take profit level hit tp dow futures trade winnerquick dow futures trade, from previous Asian and daily range

being patient one a small us30 short idea for 50 pips50 Pips short idea uodate. the 1hr closing in the london session gave a nice push outside of previous daily ranges and previous asain range.


Asian session Trade for 70 Pipsdow futures trade. WinnerUS 30, dow futures for a 70 Pip Trade, scale in for Take Profit hit! Long trade

See all ideas
Summarizing what the indicators are suggesting.
Neutral
SellBuy
Strong sellStrong buy
Strong sellSellNeutralBuyStrong buy
Neutral
SellBuy
Strong sellStrong buy
Strong sellSellNeutralBuyStrong buy
Neutral
SellBuy
Strong sellStrong buy
Strong sellSellNeutralBuyStrong buy
A representation of what an asset is worth today and what the market thinks it will be worth in the future.
Displays a symbol's price movements over previous years to identify recurring trends.
Frequently Asked Questions
The current price of E-mini Dow Jones ($5) Futures is 48,336 USD — it has fallen −0.65% in the past 24 hours. Watch E-mini Dow Jones ($5) Futures price in more detail on the chart.
The volume of E-mini Dow Jones ($5) Futures is 46.20 K. Track more important stats on the E-mini Dow Jones ($5) Futures chart.
Open interest is the number of contracts held by traders in active positions — they're not closed or expired. For E-mini Dow Jones ($5) Futures this number is 63.21 K. You can use it to track a prevailing market trend and adjust your own strategy: declining open interest for E-mini Dow Jones ($5) Futures shows that traders are closing their positions, which means a weakening trend.
Buying or selling futures contracts depends on many factors: season, underlying commodity, your own trading strategy. So mostly it's up to you, but if you look for some certain calculations to take into account, you can study technical analysis for E-mini Dow Jones ($5) Futures. Today its technical rating is neutral, but remember that market conditions change all the time, so it's always crucial to do your own research. See more of E-mini Dow Jones ($5) Futures technicals for a more comprehensive analysis.