Trade ideas

CELR - Target $0,07 - Triple bottom break outCELR looks great on the weekly timeframe. Price has bottomed out and can increase the comming weeks to $0,07.

CELRUSDTCELR ~ 1W
#CELR So far this support block has been able to keep prices from dropping lower. If you have Conviction on this coin, It's not bad to start buying from here. at least for 20%++ profit

CELRUSDT FOR BUY.Price was previously bearish, price broke out of the trendline and resistance zone which signals a change of trend. Price broke out and retested the resistance zone.

#CELR/USDT#CELR
The price is moving in a descending channel on the 1-hour frame and is sticking to it well
We have a bounce from the lower limit of the descending channel and we are now touching this support at a price of 0.01231
We have a downtrend on the RSI indicator that is about to be broken, which supports the rise
We have a trend to stabilize above the moving average 100
Entry price 0.01263
First target 0.01377
Second target 0.01474
Third target 0.01587

CELR BULLISHCELR has currently broken the resistance it could not break for 3 months. When it tests this level, the targets will be as in the chart.

CELRUSDT Elliott Wave PredictionThought I would post this because I think the chart is interesting. I am expecting continued upside for some time based on the possible wave count and the most interesting thing about the chart is the massively overshooting B wave off wave 1. This phenomenon is all over the alt market. It shook a lot of people out and it will also mess up a lot of traders' targets if they do not interpret it correctly. I hope this is helpful!

#CELR/USDT#CELR
The price is moving in a descending channel on the 12-hour frame and is sticking to it to a large extent and it was broken upwards
We have a bounce from the lower limit of the channel at a price of 0.01000
We have an upward trend on the RSI indicator, which supports the rise
We have a trend to stabilize above the moving average 100
Entry price 0.0110
First target 0.01219
Second target 0.01380
Third target 0.01520

#CELR/USDT#CELR
The price is moving within a descending channel pattern on the 1-hour frame and is expected to rise after it has been largely committed to it
We have a downtrend on the RSI indicator that is expected to break upwards and we have a trend to stabilize above it
We have a major support level in green at a price of 0.01250
We have a trend to stabilize above the moving average 100
Entry price 0.01270
First target 0.01323
Second target 0.01370
Third target 0.01430

CELRUSDTCELR ~ 1W
#CELR So far this support block has been able to keep prices from dropping lower. If you have Conviction on this coin, It's not bad to start buying from here. at least for 20%++ profit

Alikze »» CELR | Triple Bottom🔍 Technical analysis: Triple Bottom
- In the weekly time frame, a triple bottom has been formed at Fibo 0.78.
- According to the return candle in the mentioned area, we expect at least this motivational wave to continue its growth until the neckline.
- This climb can have at least 50 to 60 percent profit yield.
💎 Also, if the 0.78 area is broken, the bullish scenario will be invalidated.
»»»«««»»»«««»»»«««
Please support this idea with a LIKE and COMMENT if you find it useful and Click "Follow" on our profile if you'd like these trade ideas delivered straight to your email in the future.
Thanks for your continued support.
Best Regards,❤️
Alikze.
»»»«««»»»«««»»»«««

Celer networkCeler is a blockchain interoperability protocol enabling a one-click user experience accessing tokens, DeFi, GameFi, NFTs, governance, and more across multiple chains. Developers can build inter-chain-native Dapps using the Celer Inter-chain Messaging Framework to gain access to efficient liquidity utilization, coherent application logic, and shared states. Users of Celer-enabled dApps will enjoy the benefits of a diverse multi-blockchain ecosystem with the simplicity of a single-transaction UX, all from a single chain.
Celer network its a buy, buy, buy, for me !

CELRUSDT.PCELRUSDT.P is in bearish trend.
Potentially printing LH and LL.
Sellers are strongly active.
We wait for the breakout of last LL for further confirmation.


CELR/USDT - Buy, Buy, Buy! Quite oversold at the moment, CELR/USDT looking like it has found its bottom and is getting geared up for a run up. I believe it is only a matter of time before we see Celer retest previous multiyear support, obviously this depends on the greater market as a whole.
A rising tide lifts all boats :)

CELR mid-term analysisThe symbol CELR is in a long-term bearish trend.
CELR's big structure is completely bearish.
It is expected to reach the demand range in the medium term and then move upwards.
We are looking for buy/long positions in the demand range.
Closing a weekly candle below the demand range will violate the analysis.
Note that the financial market is risky, so:
Do not enter a position without setting a stop and capital management and confirmation and trigger.
When we reach the first TP, save some profit and try to move the stop continuously in the direction of your profit.
If you have any comments please post them, comments will help us improve our performance
Thanks

Important Price for CELR0.1538 seems an important price for me. If CELR can break it upward accompanying a reasonable volume, that can be a strong support line for a bull run. The 14 day moving average is going to cross the 52 day curve which can make a buy signal similar to that in first of 2023.

#CELR/USDT breaks the Diagonal Trendline in 1-Hour TF!#CELR/USDT breaks the Diagonal Trendline in 1-Hour TF!
$CELR rejected from PML $0.01507 resistance level. we can short it after the PDL support breakdown.

CELR Technical Analysis in Two-Day TimeframeHello everyone, I’m Cryptorphic.
For the past seven years, I’ve been sharing insightful charts and analysis.
Follow me for:
~ Unbiased analyses on trending altcoins.
~ Identifying altcoins with 10x-50x potential.
~ Futures trade setups.
~ Daily updates on Bitcoin and Ethereum.
~ High time frame (HTF) market bottom and top calls.
~ Short-term market movements.
~ Charts supported by critical fundamentals.
Now, let’s dive into this chart analysis:
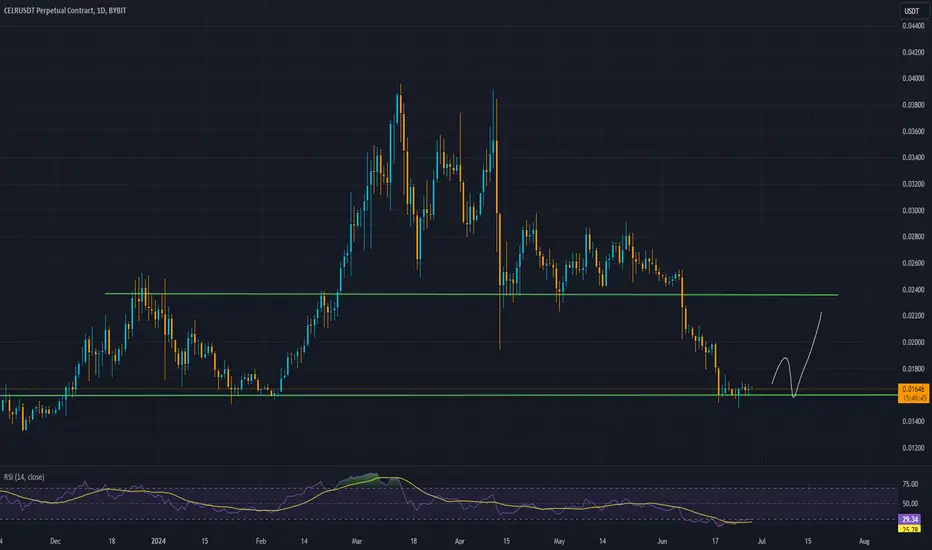
#CELRUSDT is at a crucial juncture with the price testing a strong support zone within an ascending channel.
Strong Support Zone: A strong support zone is highlighted in green around the $0.014 - $0.016 range.
RSI Indicator: The RSI is currently below the 50 level, trying to reverse the momentum from the oversold to the overbought zone.
Best Entry: $0.0133 to $0.0145.
Targets:
T1- $0.0241
T2- $0.0306
T3- $0.0351
T4- $0.0414
Invalidation Point: Breakdown and close below $0.0133.
DYOR. NFA.
Please hit the like button to support my content and share your thoughts in the comment section. Feel free to request any chart analysis you’d like to see!
Thank you!
#CELR

CELR PlanCELR shows strong potential if you follow the price action.
Keep in mind that everything works well in the absence of market manipulation.
Always manage your risk effectively.
#CELER/USDT#CELER
The price is moving in a bearish channel on a 4-hour frame and is holding it strongly and is about to break it upward
We have a bounce from the green support area at 0.01750
We have a tendency to stabilize above the Moving Average 100
We have a downtrend on the RSI indicator that is about to break higher and supports the rise
Entry price is 0.01800
The first target is 0.02084
The second goal is 0.02293
The third goal is 0.02523

CELRUSDT.P 15m Short ScalpCELRUSDT.P 15m Short Scalp after bearish pattern.
Always set up stoploss for your trade.
