Celrusdt DailyHi guys, hope you well
Really nice coin sharp moving ,
SecondChanceCrypto
⏰25/April/23
⛔️(DYOR)
Trade ideas

CELR ANALYSIS (4H)Hi, dear traders. how are you ? Today we have a viewpoint to BUY/LONG the CELR symbol.
For risk management, please don't forget stop loss and capital management
When we reach the first target, save some profit and then change the stop to entry
Comment if you have any questions
Thank You

celr - ANOTHER SHORT LONGtHE PRICE IS BREAKING OUT ON THE ONE HR TF.
the trade setup is in the figure... let's see if this plays out too???

late short celerceler is in a flag formation a nd isa still respecting the boundfries 5% more to the downside then long

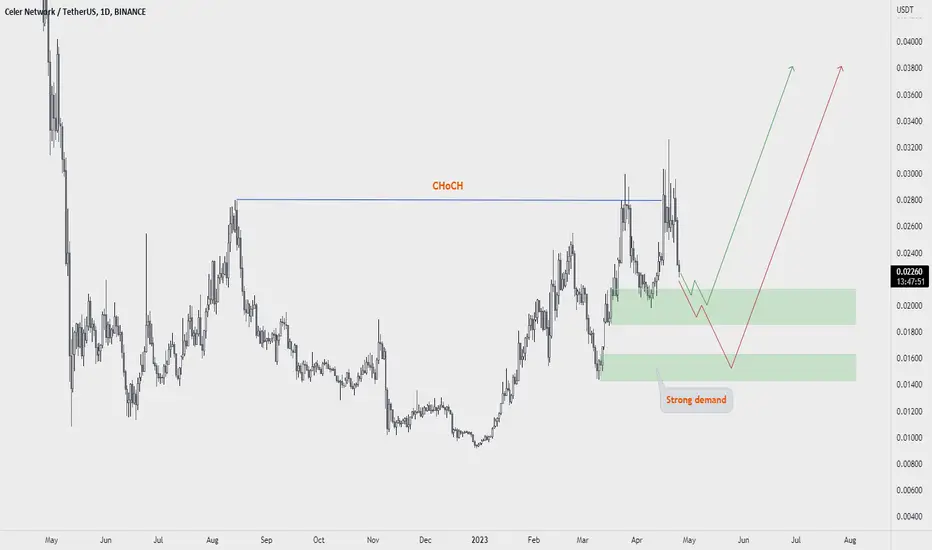
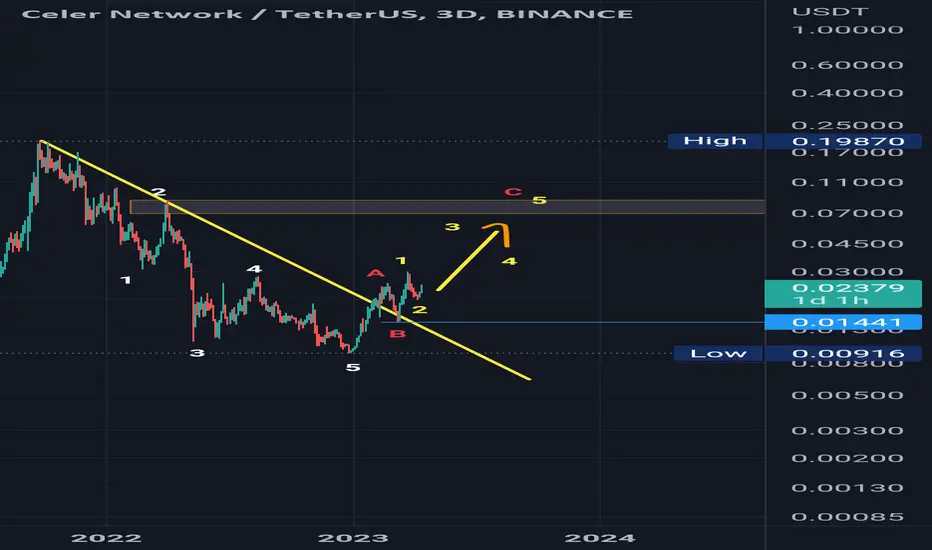
celrusdtIt is possible that an impulse with five waves is expected to rise, and wave 1 and wave 2 have been completed, and we are waiting for three more waves to go to the shaded area.
Note: The analysis fails if the price closes below an area 0.0144 usdt
CELRUSDTHello dear traders,
*Mars Signals Team wishes you high profits*
This is a one-day-time frame analysis for CELRUSDT
R1 on the top of this chart is our resistance area that demonstrates the disability of the price to rise. S1 used to be a resistance line. And we have S2 and S3 that are two support areas with their support of price at different points even since the past. Clearly, the price was supported at S3 after its rejection at S1 and its rise resumed up to R1 line. But after not being capable of more rise, it had a failure in break and faced another increase which we notice it over S1. At the moment, we see the price had a neutral trend after being supported at S1 and now it is fluctuating at this point. It is predicted to resume its decline down to S1 and by having more fixation and support, a rise is expected for the price to higher amounts. Also, when the support at S1 is lost, more fall is there for the price toward S2 area or lower than that. We recommend you to check every detail and information before putting your trade orders and then wait for a proper time to have your next action. In case you are looking for wise trades and less risky ones, our suggestion will be following our regular updates all the time.
Warning: This is just a suggestion and we do not guarantee profits. We advise you to analyze the chart before opening any positions.
Have a nice time

Celr/USDT long setupCelr broke its trading range based on weekly chart,
I entered this position based on retest of trend line and its pull back.
Please note that its BTC pair is also testing a strong resistance, which makes me even more bullish
Expecting a big move from here. However I will set my entry 2 at 0.1675
My target is based on measure move of TR
Lets see


CELR/USDT - NEXT MOVE "just hold it -
after visiting the 61.80 % fibo and a hard support level, 0.03448 will be the next target of celrusdt just hold it."

#CELR/USDT - Long - Potential 11.93%Direction: Long
Market: Spot
Risk: 0.25% - 1%
#USDT_CELR
Exchange: BINANCE
Timeframe: 360
TP1: 0.02476
Entry: 0.02229
STOP: 0.01982
Entry Conditions:
| Falling wedge breakout
| All MA's broken

CLERUSDT (1H) - Bullish reversalHi Traders
CLERUSDT (1H Timeframe)
Waiting for the upward break of 0.0225 resistance level, which will complete a bullish trend reversal pattern to go LONG. Only the downward break of 0.0212 would cancel the bullish scenario.
Trade details
Entry: 0.0225
Stop loss: 0.0212
Take profit 1: 0.0232
Take profit 2: 0.0245
Score: 7
Strategy: Bullish reversal

CELRUSDT 2H HR MTCELR
The downtrend is broken
The area of 0.618 corrected the wave
PRZ rejected the return
The beginning of the double ascending wave

celrusdtThis is my idea and not a financial advice.
I wait until one of the two scenarios happens. In the first scenario, the price corrects to the first support, and I buy for the long term in the weekly time frame, and in the second scenario, I wait for it to break its resistance and I buy in the price correction.

CELERUSDT Time to shortthis huge bullish momentum is ending soon.I expect the price to react to the trendline and then break .Can the next support hold the price? We don't know, we have to see what happens

CELRUSDTDisclaimer
High Risk Investment
Trading cryptocurrencies and Forex carries a high level of risk, and may not be suitable for all investors. Before deciding to trade cryptocurrency you should carefully consider your investment objectives, level of experience, and risk appetite. The possibility exists that you could sustain a loss of some or all of your initial investment and therefore you should not invest money that you cannot afford to lose. You should be aware of all the risks associated with cryptocurrency and Forex trading, and seek advice from an independent financial advisor. Since Any opinions, news, research, analyses, prices, or other information contained on this website is provided as general market commentary, and does not constitute investment advice. The Bibres will not accept liability for any loss or damage, including without limitation to, any loss of profit, which may arise directly or indirectly from use of or reliance on such information. All opinions expressed are owned by the respective writer and should never be considered as advice in any form.
A qualified professional should be consulted before making any financial decisions.
-----------------------------------

#CELRUSDT #LQR #TOBTC #LaqiraProtocol If break trend and confirmation until the support can open the trade
, the important support and resistance in the chart are specified in the levels after confirmation you can open the trade
this analysis is not a buy or sell offer

Need to see if it can rise above 0.03471 to end the sidewaysHello?
Traders, welcome.
If you "Follow", you can always get new information quickly.
Please also click "Boost".
Have a good day.
-------------------------------------
(CELRUSDT chart)
(1W chart)
It is the convergence of the HA-Low and HA-HIgh indicators.
Therefore, the key is whether it can rise with support around 0.02109.
Even if it does not rise above the M-Signal of the 1M chart, it is expected to rise soon if it moves sideways because the Bollinger Bands are contracting.
(1D chart)
If it rises above 0.03471, it is expected to show a full-fledged uptrend.
thus,
1st: 0.02109
2nd: 0.01452-0.01660
You need to make sure that it is supported near the 1st and 2nd order and can rise more than 0.02641.
-------------------------------------------------- -------------------------------------------
** All descriptions are for reference only and do not guarantee profit or loss in investment.
** Even if you know other people's know-how, it takes a considerable period of time to make it your own.
** This is a chart created with my know-how.
---------------------------------

CELRUSDTHello Crypto Lovers,
Mars Signals team wishes you high profits.
This is a one-day-time frame analysis for CELRUSDT
There is R1 on the top of the chart which is a long-term resistance line and represents the unsuccessful triumphs of the price to rise at several points. S1 used to be a resistance area. And as you observe, S2 and S3 are our support areas with the support of price even since the past. At the present, we see the fluctuation of price over S1. Our expectation would include more decline for the price to reach S1. Here if the price is able to be supported and break S1 upward, more rise is there for it to higher amounts such as R1 (which is a proper point for saving your profits). In case the price loses the support t S1 and through providing us some falling signs, more decline would take place to lower amounts. By the time the price touches S1 and is supported there well, we suggest you to put your purchase orders there. It is crucial to consider the market situation in lower time frames and then decide what to do exactly; based on the multiple pieces of information which you would obtain from our analyses and updates.
Warning: This is just a suggestion and we do not guarantee profits. We advise you to analyze the chart before opening any positions.
Wish you luck

Quick Trade Setup for CELRHere's a quick look at the CELR 4 hr. chart. As we can see, the price has formed a bigger cup & handle formation, which is a bullish price pattern.
It all depends on BTC. BTC is close to a more significant resistance zone (28k zone), and one should be careful when trading!
-------------------------------------------
The idea is: Buy when the price breaks above 0.02121$ and take profits at the levels shown in the chart.
Targets:
1. 0.0215$
2. 0.022$
3. 0.023$
-------------------------------------------
If you like the content, then make sure to comment and like the post :D
Follow me for daily profitable trading setups.
BTC dictates the market. If BTC falls, then Alts will drop as well. Trade safe!

The CUP and HANDLE chart pattern in CELR#CELR
A reliable and volatile currency. According to a reliable chart pattern called cup and handle, a very good position for a profit of about 50-70%. I set two loss limits. One is the first inverse fractal before the entry point and the other is based on ATR 2*14


CELR : INCREASE VIEWCELR is one of the coins at this moment that can be important for the next trend, we will follow to see if it's able to confirm the coming time.
In the last days on altcoins, there is a hard trend to find a building coin. Will clear be the next one? this is exactly what we are going to follow.
