CADCHF: Ready For Correction?CADCHF: Ready For Correction?
yesterday after the Swiss CPI data the price moved down across many XXXCHF pairs proving once
again that the CHF is not giving up easily.
Today ahead of the BOC Interst rate decision the price stopped and is showing for a possible correction.
it is risky as we are ahead of a big event and the price can move in many ways during these events.
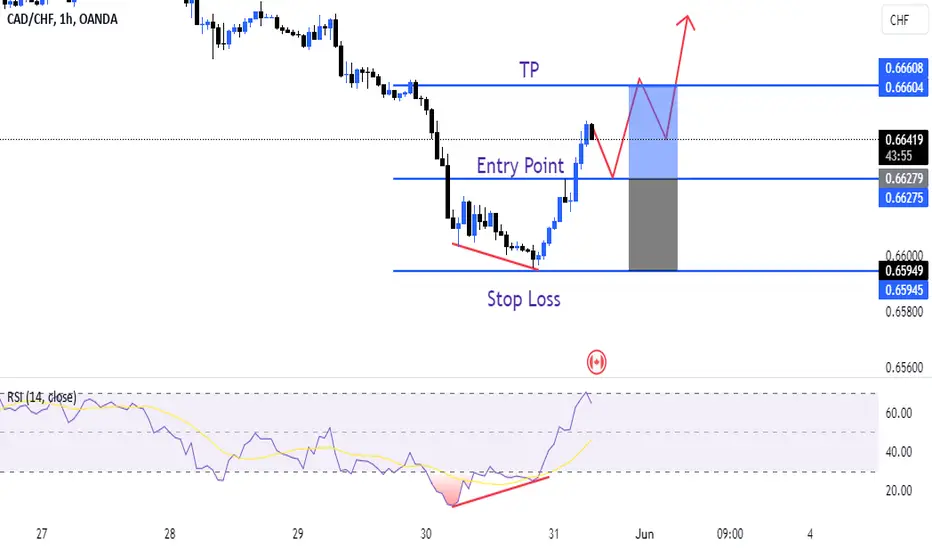
However, we can see a bullish correction from a technical point of view combined with some Fundamental Analysis!
You may find more details in the chart!
Thank you and Good Luck!
❤️PS: Please support with a like or comment if you find this analysis useful for your trading day❤️
CHFCAD trade ideas

Fib Strategy ExplainedThis is merely a video demonstrating how I was able to predict the drop in CADCHF from last week and enter at the appropriate times and locations. It also describes how I use the Fib and Fib retracement tool to determine my take-profit and re-entry levels.
We appreciate any and all criticism.
Regards

CAD CHF - Short Set upThe chart is in clear downtrend. On 1H TF looks like a bear flag. Entry, Stoploss and TP's mentioned. Good Luck
Entry 0.64947
Stoploss 0.65319
Tp1 0.64574
Tp2 0.64207
#Trading #Technical #Crypto #Stocks #commodities

CHFCAD Trend Continuation Entry CHFCAD Trend Continuation Entry looks like it's want to continue to upside


CADCHF - Bullish Crab PatternAn almost perfect CADCHF bullish crab harmonic pattern is formed, the bullish divergence is a confluence of its bullish movement. This is a wait-and-watch scenario, the validation of this setup initiates after it tests the D point and breaks the 0.618 Fib level, in this case, a buy-stop setup.

CADCHFWe can attempt to buy CADCHF as it break LH , trendline resistance , also there is bullish divergence indicate that it moves upward.
SL , TP mention in chart.

CADCHF - H1 - 04.06.24 - 07:05 GMT+2Entry:
- Price broke through sideways range with strong move toward downside.
- Pullback is not really ideal, it is best to see a 40-50% pullback.
- Setup BB with pre-breakout tension, although it is not really ideal too, but the strong move to the downside give us favorable condition.

CADCHF BULLISH BUTTERFLY MONTHLY PATTERNTarget one - at .382 to .868
1 to 7 risk to reward
stops just below the previous low
Good luck traders

BULLISH MARKET STRUCTURE 4 CADCHFCADCHF is driven by bullish harmonic price patterns which have
been occurring for quite some time now
Bouncing between Supply and Demand areas
Price is currently playing around our demand area and this
could lead to a bullish move soon, supported by the
Bullish harmonic price pattern structure
which also formed on our demand areas
Be vigilant for stop hunts !!!

DeGRAM | CADCHF sliding towards the channel boundaryCADCHF is moving near the lower boundary of the descending channel, to which the price has been sliding for a long time.
The chart started to retest the channel boundary, support level and trend line.
We expect a rebound.
-------------------
Share your opinion in the comments and support the idea with like. Thanks for your support!

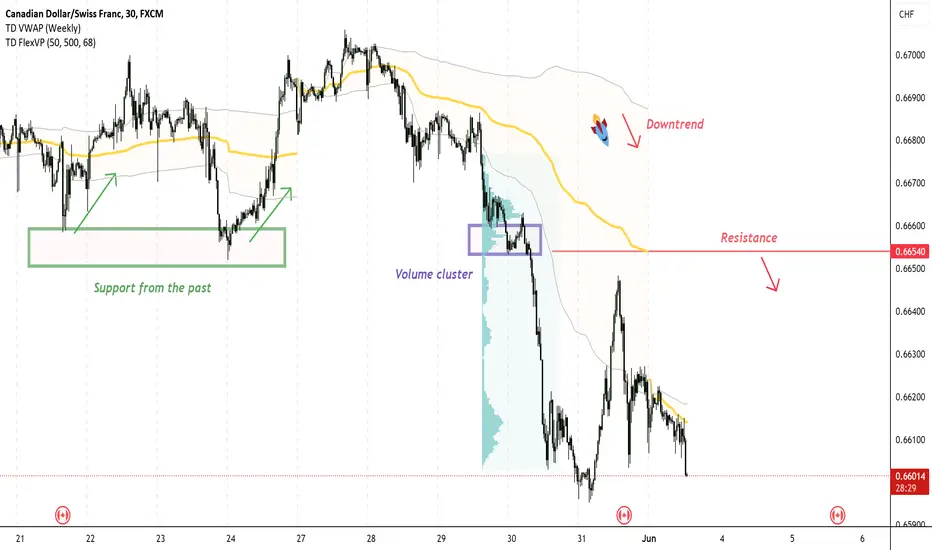
CAD/CHF Day Trading analysis On CAD/CHF , it's nice to see a strong sell-off from the price of 0.66540. It's also encouraging to observe a strong volume area where a lot of contracts are accumulated.
I believe that sellers from this area will defend their short positions. When the price returns to this area, strong sellers will push the market down again.
The downtrend combined with the strong volume area along with the strong S/R area from the past are my main reasons for this short trade.
Happy trading,
Dale
CAD/CHF may fall 25 - 32 pips0.6620 is our pivot point.
Our preference
The downside prevails as long as 0.6620 is resistance.
Alternative scenario
Above 0.6620, look for 0.6632 and 0.6639.
Comment
The RSI is below its neutrality area at 50. The MACD is negative and below its signal line. The configuration is negative. Moreover, the price stands below its 20 and 50 period moving average (respectively at 0.6614 and 0.6621).
Supports and resistances
0.6639 **
0.6632 *
0.6620 **
0.6615
0.6609 last
0.6584
0.6577 **
0.6570 *
0.6563 **
Number of asterisks represents the strength of support and resistance levels.

CADCHF IDEAThis is just simple trading idea draw into chart using labels and lines. Please use it as educational purpose and you are free to modify any

CADCHF: Forecast & Technical Analysis
The charts are full of distraction, disturbance and are a graveyard of fear and greed which shall not cloud our judgement on the current state of affairs in the CADCHF pair price action which suggests a high likelihood of a coming move up.
❤️ Please, support our work with like & comment! ❤️

CADCHF IS IN BULLISH TRENDCADCHF is in bullish trend because bullish divergence printing on 1H & 4H time frame buy at retracement of fib level 0.38 or 0.50 complete trade plane is mentioned in chart


CADCHF Is Going Up! Buy!
Take a look at our analysis for CADCHF.
Time Frame: 1D
Current Trend: Bullish
Sentiment: Oversold (based on 7-period RSI)
Forecast: Bullish
The market is approaching a key horizontal level 0.664.
Considering the today's price action, probabilities will be high to see a movement to 0.669.
P.S
Please, note that an oversold/overbought condition can last for a long time, and therefore being oversold/overbought doesn't mean a price rally will come soon, or at all.
Like and subscribe and comment my ideas if you enjoy them!

CADCHF - Ready For The Next Impulse 📉Hello TradingView Family / Fellow Traders. This is Richard, also known as theSignalyst.
📈 CADCHF has been overall bearish, trading within the falling channel in red.
At present, CADCHF is hovering around the upper bound of the channel acting as a non-horizontal resistance.
Moreover, it is retesting the upper bound of the short-term symmetrical triangle marked in orange.
🏹 Thus, the highlighted red circle is a strong area to look for sell setups as it is the intersection of the upper orange and red trendlines.
📚 As per my trading style:
As #CADCHF is around the circle zone, I will be looking for bearish reversal setups (like a double top pattern, trendline break , and so on...)
📚 Always follow your trading plan regarding entry, risk management, and trade management.
Good luck!
All Strategies Are Good; If Managed Properly!
~Rich

CADCHF short idea CAD/CHF currency pair is exhibiting significant bearish potential, driven by anticipated actions from the Bank of Canada (BOC) and the overall bearish trend of the US dollar, which indirectly impacts the Canadian dollar.
Fundamental Analysis :
Bank of Canada's Monetary Policy: The BOC is widely expected to lower interest rates in the near future. A rate cut would weaken the Canadian dollar as investors seek higher yields in other currencies. The dovish stance of the BOC is a key bearish factor for the CAD/CHF pair.
US Dollar's Bearish Outlook: The overall bearish sentiment towards the US dollar also indirectly impacts the Canadian dollar due to the close economic ties between the US and Canada. As the US dollar weakens, it often leads to a spillover effect, dragging down the Canadian dollar further against other currencies, including the Swiss franc.
Technical Analysis :
Technically, the CAD/CHF pair has recently shown signs of downward pressure, breaking below key support levels. Momentum indicators like the Relative Strength Index (RSI) and Moving Average Convergence Divergence (MACD) suggest a continuation of the bearish trend, reinforcing the downside potential.
Conclusion :
Given the Bank of Canada's likely rate cuts and the overall bearish trend of the US dollar, the CAD/CHF pair is poised for further depreciation. Traders should consider this an opportune moment to explore short positions, anticipating continued weakness in the Canadian dollar against the Swiss franc.

CADCHF - In a range !!Hello traders!
‼️ This is my perspective on CADCHF.
Technical analysis: Here we are still in a range and price rejected one more time from resistance zone + institutional big figure 0.67000, so I expect bearish continuation to support zone.
Like, comment and subscribe to be in touch with my content!
