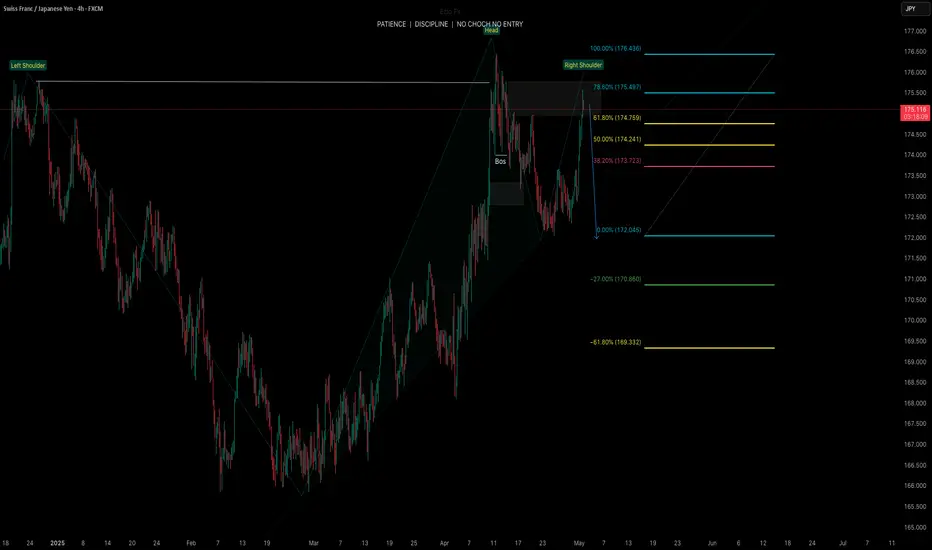
Nice Idea on a chartI look for 3pin head and shoulders on a chart,
Optimism about a de-escalation in the global trade conflict helped the US Dollar (USD) despite disappointing data releases. US President Donald Trump reported undergoing trade talks with South Korea, Japan and India. He also claimed that there’s a “very good” chance of clinching a deal with China, yet added that any pact with Beijing has to be in US terms. At the same time, a Beijing-backed outlet said on Thursday that United States officials have contacted their Chinese counterparts for talks. Tensions between China and the US persist, but optimism led Thursday’s price action.
CHFJPY trade ideas
CHFJPY BUY TRADE PLAN🔥 CHF/JPY TRADE PLAN 🔥
📅 Date: April 28, 2025
🔖 Plan Type: Intra-Day – Trend Continuation
Trade Plan Overview
Type Direction Confidence R:R Status
Intra-Day Buy ⭐⭐⭐⭐ 81% 3.1:1 Awaiting Tap
Guidance: Prioritize the Primary Buy Zone entry. Strong continuation bias supported by H4 structure, sentiment alignment, and volume breakout retest.
Total allowed risk: 0.5% of account.
Primary Trade Plan: Trend Continuation – Buy
📈 Market Bias & Trade Type
Bias: Bullish
Trade Type: Trend Continuation
🔰 Confidence Level
⭐⭐⭐⭐ (81%)
Reason: H4 bullish OB + Retest of Breakout Level + H1 bullish structure + Sentiment Score: +7/10
OB: 35%
Structure: 30%
Volume: 16%
📌 Status
Awaiting Tap
📍 Entry Zones
🟩 Primary Buy Zone: 172.90 – 173.10 (H4 OB, demand retest)
🟧 Secondary Buy Zone: 172.50 – 172.70 (breakout retest zone)
❗ Stop Loss
172.10 (Below H4 OB, +1.5x ATR buffer, ~80 pips risk)
🎯 Take Profit Targets
🥇 TP1: 174.80 (~170 pips | 2.1R)
🥈 TP2: 175.90 (~280 pips | 3.5R)
🥉 TP3: 176.80 (~390 pips | 5.0R) (Swing)
📏 Risk:Reward
2.1:1 (TP1)
3.5:1 (TP2)
5.0:1 (TP3)
🧠 Management Strategy
Risk 0.5% of $
SL to Breakeven after TP1
Take 50% at TP1, 30% at TP2, trail 20% to TP3
Full Exit if H4 BOS (bearish)
Avoid holding through major CHF or JPY news.
⚠️ Confirmation Criteria
H1 bullish engulfing or strong wick rejection in zone
Volume spike on H1/M30
Best entry during London Open – NY Open overlap.
⏳ Validity
Valid for 2 days (till April 30, 2025)
❌ Invalidation:
Full bearish BOS on H4 below 172.10
DXY/Yen strength surge due to sudden macro event
🌐 Fundamental & Sentiment Snapshot
COT: CHF Neutral / JPY Mildly Bearish
DXY: Mildly Bearish
Retail: 61% Short CHFJPY (contrarian bullish bias)
Cross-Pair Check: GBPJPY bullish, USDJPY bullish (confirming)
Macro: No major CHF/JPY high-impact news next 48H
Sentiment Score: +7/10
Historical: CHFJPY continuation setups post-retest have 70%+ success in last 6 months.
📋 Final Trade Summary
Elite bullish continuation setup. Structure, volume, sentiment all aligned. Tactical entries only at precision zones. Risk tight and managed per protocol.

CHFJPY My Opinion! SELL!
My dear friends,
CHFJPY looks like it will make a good move, and here are the details:
The market is trading on 174.67 pivot level.
Bias - Bearish
Technical Indicators: Supper Trend generates a clear short signal while Pivot Point HL is currently determining the overall Bearish trend of the market.
Goal - 173.76
About Used Indicators:
Pivot points are a great way to identify areas of support and resistance, but they work best when combined with other kinds of technical analysis
Disclosure: I am part of Trade Nation's Influencer program and receive a monthly fee for using their TradingView charts in my analysis.
———————————
WISH YOU ALL LUCK

first buyIn the first step, we enter a buy order and stay with the trade until the marked green area.
Continue and the next step in the analysis below...

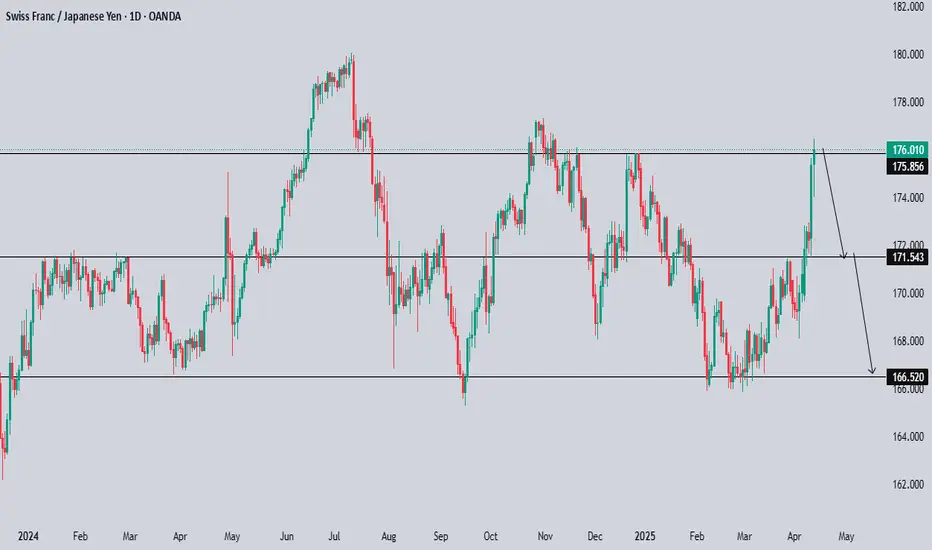
is CHFJPY going to hit the highest level for the second time??having a look at the chart, the price broke the bearish trendline strongly and then made a retracement, and now it is above the marked trendline it seems that the price will hit the "180" level for the second time


CHFJPY...LONGOANDA:CHFJPY
Price is testing a level that has proven significant in the past. Will it hold or break this time? The market always tells a story — we just have to listen.
A confirmed breakout and retest of this level could shift the bias and offer a new opportunity.

Lingrid | CHFJPY shorting OPPORTUNITY from KEY levelAfter a long consolidation, CHFJPY made a sharp breakout toward 175.00, retesting a key resistance zone. This level also aligns with the upper boundary of a previous trend channel. If price fails to hold above it, a pullback toward 173.70 is expected before any further continuation. As of now, this rally looks like a test rather than a confirmed breakout.
📈 Key Levels
Sell zone: 174.90 – 175.00
Sell trigger: rejection from resistance
Target: 173.70
Buy trigger: clean breakout above 175.00 with retest
💡 Risks
Quick rejection from 175 may trigger a deeper correction.
JPY strength can accelerate downside movement.
Watch for false breakouts above resistance — confirmation is crucial.
Traders, if you liked this idea or if you have your own opinion about it, write in the comments. I will be glad 👩💻

CHFJPY Technical and Order Flow AnalysisOur analysis is based on multi-timeframe top-down analysis & fundamental analysis.
Based on our view the price will fall to the monthly level.
DISCLAIMER: This analysis can change anytime without notice and is only for assisting traders in making independent investment decisions. Please note that this is a prediction, and I have no reason to act on it, and neither should you.
Please support our analysis with a like or comment!
JPYCHF is going to boom....uphere we should have to look at the week chart , there we get an opportunity to get billions of dollars.... very easily..... hurrrrryyyy

CHF/JPY For Bearish as pull-backwait for pull-back near by entry point and then go short
general trend is up trend
current phase is pull-back until target 2
have fun :)

CHF / JPY After the uptrend line is breached, we will wait for a close below the orange volume area for sell

Forget Candlestick Patterns -Who is in control BUYERS or SELLERSAll the information you need to find a high probability trade are in front of you on the charts so build your trading decisions on 'the facts' of the chart NOT what you think or what you want to happen or even what you heard will happen. If you have enough facts telling you to trade in a certain direction and therefore enough confluence to take a trade, then this is how you will gain consistency in you trading and build confidence. Check out my trade idea!!
www.tradingview.com

CHF_JPY GROWTH AHEAD|LONG|
✅CHF_JPY made a retest
Of the horizontal support
Around 172.500 and we are
Already seeing a powerful
Rebound so we are bullish
Biased and we will be
Expecting a further move up
LONG🚀
✅Like and subscribe to never miss a new idea!✅
Disclosure: I am part of Trade Nation's Influencer program and receive a monthly fee for using their TradingView charts in my analysis.

CHFJPY – Wave 5 SetupCHFJPY is preparing to complete Wave 4 and is showing early signs of starting Wave 5 next week.
This could be a strong bullish wave, offering a great opportunity to buy and ride the trend

CHFJPY – Daily Timeframe (D1) Technical & Fundamental AnalysisCHFJPY – Daily Timeframe (D1) Technical & Fundamental Analysis
On the daily timeframe, CHFJPY is currently in a consolidation phase, creating uncertainty in the market following a strong uptrend over the past few weeks. During this period of consolidation, we have identified several key levels that could potentially influence the market direction in the coming days.
The major key support level is at 166.600, which serves as a crucial area of interest. If price breaks below this level, it could signal a potential shift in market direction and trigger further downside movement.
Within the consolidation range, we also identified minor key levels near the current price:
171.200 – considered our minor key support
172.700 – considered our minor key resistance
Our strategy focuses on the current liquidity zone. Since price is moving within this range, we are waiting for a clear formation of liquidity. If this occurs, we anticipate a breakout above the resistance level and will place a Buy Stop entry at 172.870, with:
Stop Loss (SL) at 171.430, below the liquidity zone
Take Profit (TP) at 176.460, targeting the next minor resistance level
Fundamental Insights:
Fundamentals Supporting the Swiss Franc (CHF):
Strong Economic Data: If Switzerland releases stronger-than-expected economic growth, higher inflation figures, or positive employment data, this could increase investor confidence in the Swiss Franc and drive its value higher against the Yen.
Safe-Haven Demand: The Swiss Franc is widely recognized as a safe-haven currency. During periods of global uncertainty or financial market volatility, investors typically seek the CHF for stability. Increased global risk sentiment could push CHF higher versus JPY.
Fundamentals Pressuring the Japanese Yen (JPY):
Low Interest Rates & Dovish Monetary Policy: The Japanese Yen continues to face pressure due to Japan’s long-standing ultra-loose monetary policy, including low or negative interest rates and the Bank of Japan’s ongoing asset purchase program. Without significant policy tightening, the Yen is likely to remain weak.
Economic Headwinds: Any signs of slowing economic growth in Japan—such as disappointing GDP data, rising unemployment, or persistently low inflation—could further weaken the JPY, enhancing the bullish case for CHFJPY.
📌 Disclaimer:
This is not financial advice. As always, wait for proper confirmation before executing trades. Manage your risk wisely and trade what you see, not what you feel.

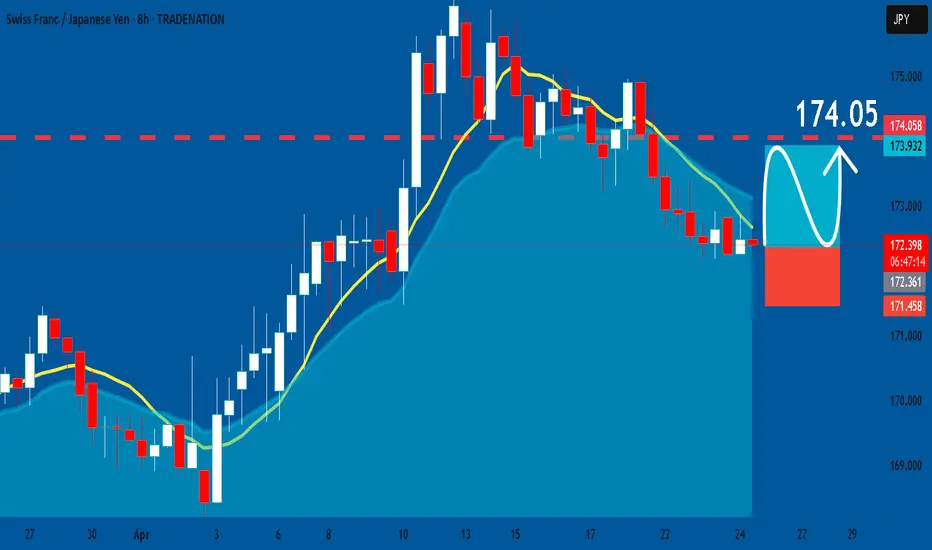
CHFJPY: Long Trade with Entry/SL/TP
CHFJPY
- Classic bullish pattern
- Our team expects retracement
SUGGESTED TRADE:
Swing Trade
Buy CHFJPY
Entry - 172.36
Stop - 171.45
Take - 174.05
Our Risk - 1%
Start protection of your profits from lower levels
Disclosure: I am part of Trade Nation's Influencer program and receive a monthly fee for using their TradingView charts in my analysis.
❤️ Please, support our work with like & comment! ❤️
CHF/JPY For Bearishyou can go short now
general trend is up trend
current phase is pull-back
have fun :)

CHFJPY sequence going downCHFJPY sequence maybe going down, take care
there is big and small sequences
are they clear ?

CHF/JPY For Bullish as Pull-backyou can go long now
general trend is down trend
current phase is pull-back
your confirmation will be price break the red level and go up so it will be reach to target 1 , 2
have fun :)

CHFJPYRejection from major weekly resistance. Now price is at H4 resistance that was broken, if it goes below and gives a retest with bearish signals then its possible to go lower till 169.000

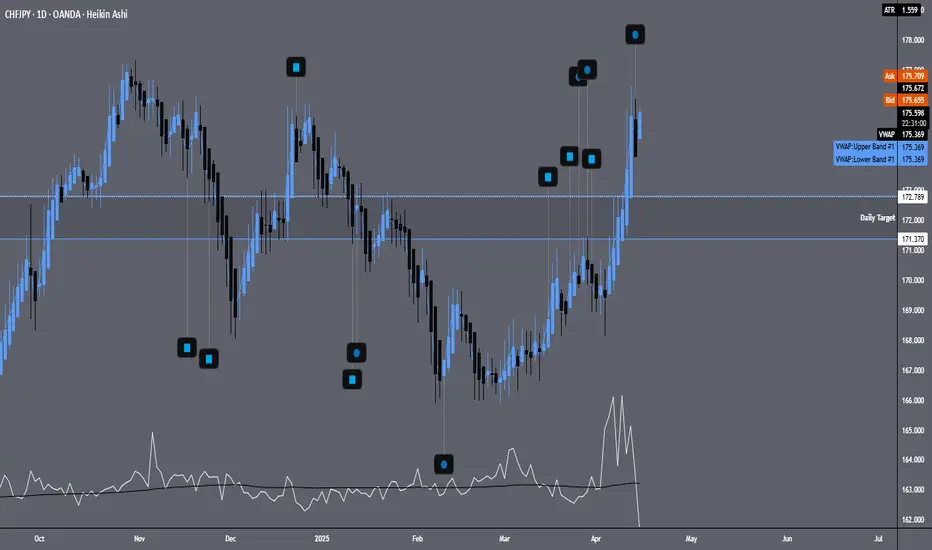
CHFJPYAt the current price level, we are near a resistance zone dating back to December/January (2024/2025) and October/November 2024. Price has been increasing from the recent support zone from February 2025. Volume looks like its gassing down on this move up. Let's see if we can retes the daily target zone before price makes a decision on how it wants to trend short term.
CHF/JPY Daily AnalysisPrice is moving in a daily uptrend.
The moving averages are in a bullish order and price has pulled back amongst them.
If price breaks out above the counter trend line, then this may be another impulse of buying in line with the daily trend.
This is an idea of what may happen next. Always trade with a robust and profitable strategy.
