CHFJPY trade ideas

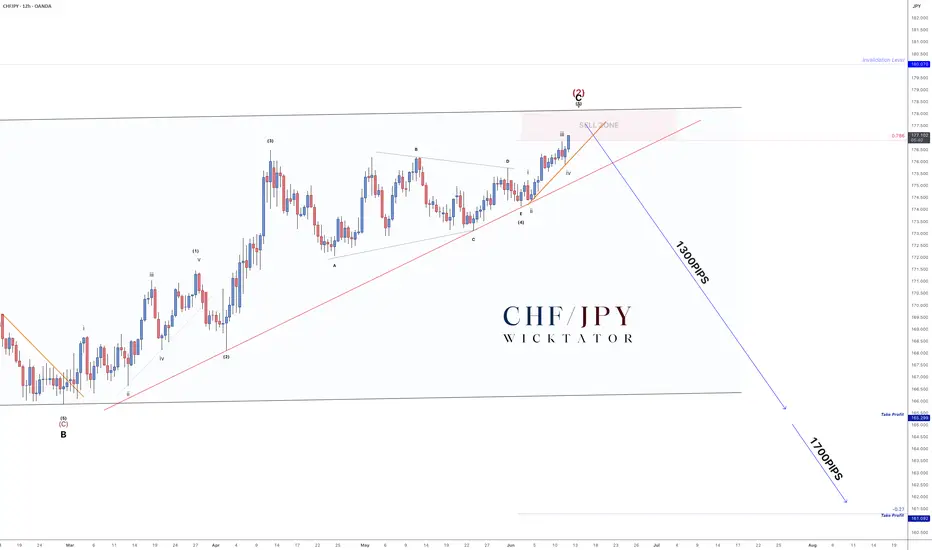
CHFJPY - How To Enter This MASSIVE 1700pip Swing Trade!As promised - here’s the lower timeframe breakdown after hitting 100+ likes.
We’re in wave 5, currently moving cleanly into the swing zone. Since wave 5 typically forms 5 subwaves, all we needed was to connect points 2 and 4 to draw our entry trendline.
Trade Idea:
- Entry on break of the orange trendline
- Stops above recent highs after entry
- Aggressive option: Enter inside the sell zone with stops above invalidation
Targets:
- TP1: 165.00 (≈1300 pips)
- TP2: 161.50 (≈1700 pips)
- Optional: Leave a runner for the longer swing move
Scroll down for the full 4H breakdown.
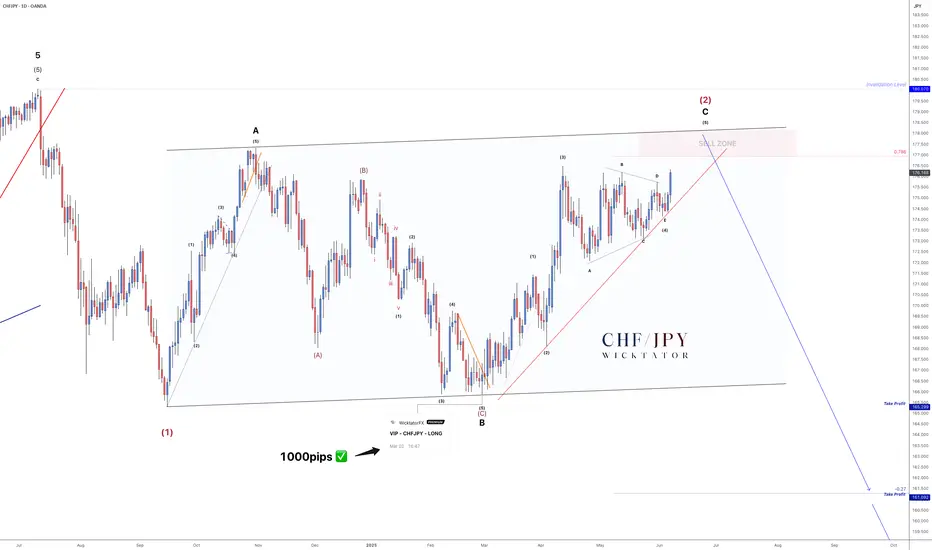
CHFJPY - 1700 Pip Reversal Incoming!The last time we looked at CHFJPY was back in October 2024, where we forecasted a large ABC correction. Fast forward to now - that correction is nearly complete!
We're currently in the 5th subwave of wave C, and everything points toward a massive drop setting up. We expect a move of at least 1500 pips.
On the Daily timeframe, structure is clear:
- Clean 5-3-5 ABC correction
- Price is approaching a key sell zone
- A clear entry trendline is in place — couldn’t ask for a cleaner setup
Trade Idea:
- Watch for rejection within the sell zone
- Aggressive entry: Inside sell zone with stops above invalidation
- Conservative entry: On break of trendline, stops above the break candle
Targets:
TP1: 165.00 (≈1300 pips)
TP2: 161.50 (≈1700 pips)
Optional: Leave a runner for a long-term swing
Let me know what you think in the comments.
See below for our last VIP setup for CHFJPY which played out perfectly. 1000pips secured!
Good luck and as always, trade safe!
CHFJPY I Technical & Fundamental Forecast Welcome back! Let me know your thoughts in the comments!
** CHFJPY Analysis - Listen to video!
We recommend that you keep this pair on your watchlist and enter when the entry criteria of your strategy is met.
Please support this idea with a LIKE and COMMENT if you find it useful and Click "Follow" on our profile if you'd like these trade ideas delivered straight to your email in the future.
Thanks for your continued support!Welcome back! Let me know your thoughts in the comments!

CHFJPY What Next? SELL!
My dear subscribers,
This is my opinion on the CHFJPY next move:
The instrument tests an important psychological level 176.83
Bias - Bearish
Technical Indicators: Supper Trend gives a precise Bearish signal, while Pivot Point HL predicts price changes and potential reversals in the market.
Target - 175.72
My Stop Loss - 177.39
About Used Indicators:
On the subsequent day, trading above the pivot point is thought to indicate ongoing bullish sentiment, while trading below the pivot point indicates bearish sentiment.
Disclosure: I am part of Trade Nation's Influencer program and receive a monthly fee for using their TradingView charts in my analysis.
———————————
WISH YOU ALL LUCK

Long CHFJPYCHFJPY is primed for a breakout... Big move expected. Stops below 175 or 172 depending on type of pull back. Target at 189-190


CHFJPY: Strong Bullish PatternIn line with the current trend, 📈CHFJPY is experiencing a robust bullish momentum.
The next buy signal will come from a bullish breakout of the ascending triangle pattern's neckline on the 4H chart.
A close of a 4H candle above 176.30 will confirm this breakout, with the next target set at 176.60.

From Cup and Handle to W Formation for CHF/JPY but target 186.04Initially, we saw a Cup and Handle form on CHF/JPY.
The price however, never broke above the Brim level, and instead formed a W Formation.
So now that we have a W Formation, it kind of changes the analysis but only in the breakout pattern form.
So now we will wait for the price to break above the Neckline of the CHF/JPY.
The rest of the analysis remains the same.
Price>20 and 200
Target 186.04
Disclosure: I am part of Trade Nation's Influencer program and receive a monthly fee for using their TradingView charts in my analysis.

CHF_JPY WILL FALL|SHORT|
✅CHF_JPY price went up sharply
But a strong resistance level was hit around 176.330
Thus, as a pullback is already happening
And a move down towards the target of 175.799 shall follow
SHORT🔥
✅Like and subscribe to never miss a new idea!✅
Disclosure: I am part of Trade Nation's Influencer program and receive a monthly fee for using their TradingView charts in my analysis.

CHF/JPY BEARS ARE STRONG HERE|SHORT
Hello, Friends!
Previous week’s green candle means that for us the CHF/JPY pair is in the uptrend. And the current movement leg was also up but the resistance line will be hit soon and upper BB band proximity will signal an overbought condition so we will go for a counter-trend short trade with the target being at 175.422.
Disclosure: I am part of Trade Nation's Influencer program and receive a monthly fee for using their TradingView charts in my analysis.
✅LIKE AND COMMENT MY IDEAS✅

CHF-JPY Correction Ahead! Sell!
Hello,Traders!
CHF-JPY will soon hit a
Horizontal resistance
Of 176.500 and as the
Pair is overbought we
Will be expecting a bearish
Correction next week
Sell!
Comment and subscribe to help us grow!
Check out other forecasts below too!
Disclosure: I am part of Trade Nation's Influencer program and receive a monthly fee for using their TradingView charts in my analysis.

CHFJPY Will Go Lower From Resistance! Sell!
Please, check our technical outlook for CHFJPY.
Time Frame: 3h
Current Trend: Bearish
Sentiment: Overbought (based on 7-period RSI)
Forecast: Bearish
The market is approaching a key horizontal level 176.079.
Considering the today's price action, probabilities will be high to see a movement to 175.442.
P.S
Please, note that an oversold/overbought condition can last for a long time, and therefore being oversold/overbought doesn't mean a price rally will come soon, or at all.
Disclosure: I am part of Trade Nation's Influencer program and receive a monthly fee for using their TradingView charts in my analysis.
Like and subscribe and comment my ideas if you enjoy them!

Selling Opportunity, CHFJPY H1The price has just broken through an important area, but it seems to be a false breakout.
We have 3 FVGs (price imbalance gaps) — these act as a magnet for liquidity, meaning the price tends to return to them to “fill” them.
RSI is above 70 → clear overbought → high risk of correction or reversal.

CHFJPY - BULLISH MOVE !Hello Traders !
The CHFJPY price formed a descending triangle pattern.
At the moment, The resistance line is broken !
So, I expect a bullish move🚀
________________
TARGET: 176.145🎯

CHFJPY Massive Short! SELL!
My dear subscribers,
CHFJPY looks like it will make a good move, and here are the details:
The market is trading on 175.45 pivot level.
Bias - Bearish
My Stop Loss - 175.86
Technical Indicators: Both Super Trend & Pivot HL indicate a highly probable Bearish continuation.
Target - 174.76
About Used Indicators:
The average true range (ATR) plays an important role in 'Supertrend' as the indicator uses ATR to calculate its value. The ATR indicator signals the degree of price volatility.
Disclosure: I am part of Trade Nation's Influencer program and receive a monthly fee for using their TradingView charts in my analysis.
———————————
WISH YOU ALL LUCK

CHFJPY, MARKET ANALYSIS AND PRICE PREDICTIONCHFJPY, has finished consolidating at the institutional renegotiation zone. decision was already taken in favor of the Bulls. price is already on as clear trend to the renegotiation resistance to sweep the Buy side liquidity .
first liquidity grabbed occurred at first entry position,. And liquidity has been grabbed again at second entry position. An institutional Buy order has been activated again. Join the Big boys and soar to 176.167. Entry is now.
Entry , stop loss and take profits are clearly marked out on this chat.
GOOD LUCK GUYS!
DICLAIMER
This analysis might fail due to market uncertainties. Take full responsibility of your capital and manage your risk properly !

Analysis: CHFJPY Trough Formation & Buy SetupIf we examine the trough (low) formation, we can clearly observe that three distinct levels of rise have already formed. These levels are especially visible on the H1 timeframe, indicating that a market cycle has completed.

Is This the Optimal Entry After a PDL Sweep and FVG Retest?A clean structural development on CHFJPY (1H TF)
After sweeping the Previous Day’s Low (PDL), price created a bullish Break of Structure (BOS) to the upside , shifting short-term sentiment. This BOS was followed by a precise retest into a Fair Value Gap (FVG), suggesting possible continuation as liquidity shifts from weak hands to strong.
🧠 Educational Notes :
CRT Sweep Logic: Market often sweeps the previous day's high or low before making its true move. In this case, a clean PDL sweep was followed by a strong bullish reaction.
Break of Structure (BOS): Confirmed bullish intent after the sweep, validating a shift in order flow.
FVG Retest: Institutional pricing inefficiency filled — a classic SMC continuation behavior.
Entry Thesis: Based on reaction from FVG + BOS confirmation, with invalidation below the swept low and TP near the previous swing high.
This setup is not financial advice, but a clear visual case study for traders applying SMC + CRT logic.

CHFJPY On The Rise! BUY!
My dear friends,
CHFJPY looks like it will make a good move, and here are the details:
The market is trading on 174.39 pivot level.
Bias - Bullish
Technical Indicators: Supper Trend generates a clear long signal while Pivot Point HL is currently determining the overall Bullish trend of the market.
Goal - 174.60
About Used Indicators:
Pivot points are a great way to identify areas of support and resistance, but they work best when combined with other kinds of technical analysis
Disclosure: I am part of Trade Nation's Influencer program and receive a monthly fee for using their TradingView charts in my analysis.
———————————
WISH YOU ALL LUCK

chfjpy sell ideaFrom a RR perspective this is worth a look as I think there is potential for more downside. 1st target would be, 173.
If stop point gets taken , will be looking for another sell as BOJ and Swiss interest rates due in the next fortnight

CHFJPY - NEW BREAKDOWN !Hello Traders !
The CHJPY failed to create a new higher high.
Currently, The higher low is broken (change of character).
So, I expect a bearish move📉
________________
TARGET: 173.280🎯

CHFJPY BUYBy utilizing Fibonacci retracement levels, historical patterns, , we can formulate a hypothesis that the market might follow a similar trajectory if bullish sentiment prevails.
