NZDCHF – Bullish Breakout Sets Stage for ReversalNZDCHF has broken decisively out of a long-term descending channel, signaling a potential trend reversal. Price action confirmed multiple bullish flags within the falling structure, followed by a clean breakout and higher low retest, supporting a bullish continuation bias.
Currently, the pair is stabilizing just above prior resistance turned support around 0.4760–0.4780, forming a potential launchpad for the next leg higher.
Upside Targets:
TP1: 0.48336
TP2: 0.48844
TP3: 0.49319
Invalidation Zone:
A drop below 0.4720 would invalidate the breakout structure and expose the downside.
Fundamental Drivers:
🇳🇿 NZD Strength: RBNZ remains relatively hawkish compared to other central banks, and the Kiwi may gain from improving risk sentiment and easing global recession fears.
🇨🇭 CHF Weakness: Swiss Franc is under mild pressure as safe-haven flows weaken amid improving tone on US-China-EU trade headlines and fading ECB rate cut bets.
🗓️ Macro Flow: Upcoming risk events (Fed comments, trade updates, and NZ economic prints) could inject momentum into the pair, especially if risk appetite improves.
Bias: ✅ Bullish (Buy)
Confidence: ★★★★☆
Watch for: Clean hold above 0.4770 zone + bullish momentum continuation.
CHFNZD trade ideas

NZDCHF - Follow the Bears!Hello TradingView Family / Fellow Traders. This is Richard, also known as theSignalyst.
📈NZDCHF has been overall bearish , trading within the falling orange channel and it is currently retesting the upper bound of the channel.
Moreover, it is rejecting a structure marked in blue.
📚 As per my trading style:
As #NZDCHF is around the red circle zone, I will be looking for trend-following sell setups on lower timeframes. (like a double top pattern, trendline break , and so on...)
📚 Always follow your trading plan regarding entry, risk management, and trade management.
Good luck!
All Strategies Are Good; If Managed Properly!
~Rich
Disclosure: I am part of Trade Nation's Influencer program and receive a monthly fee for using their TradingView charts in my analysis.

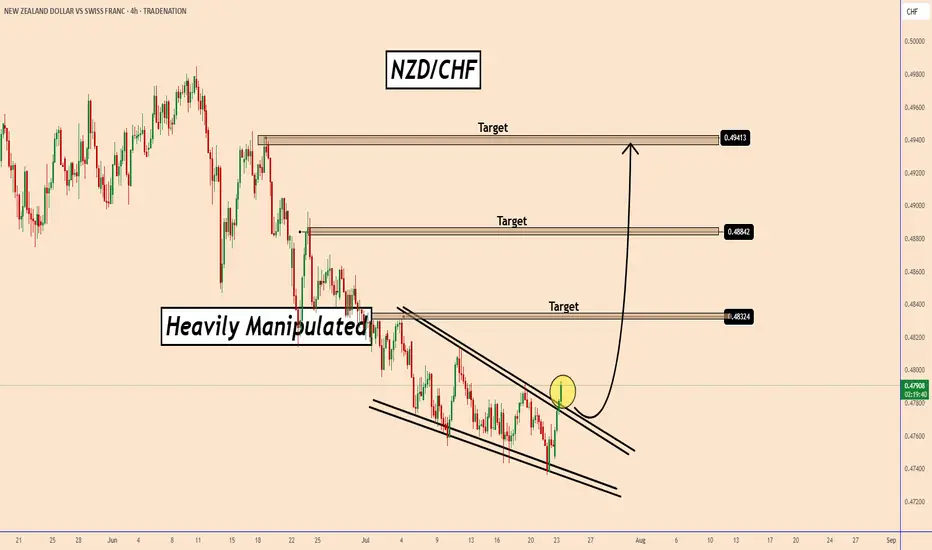
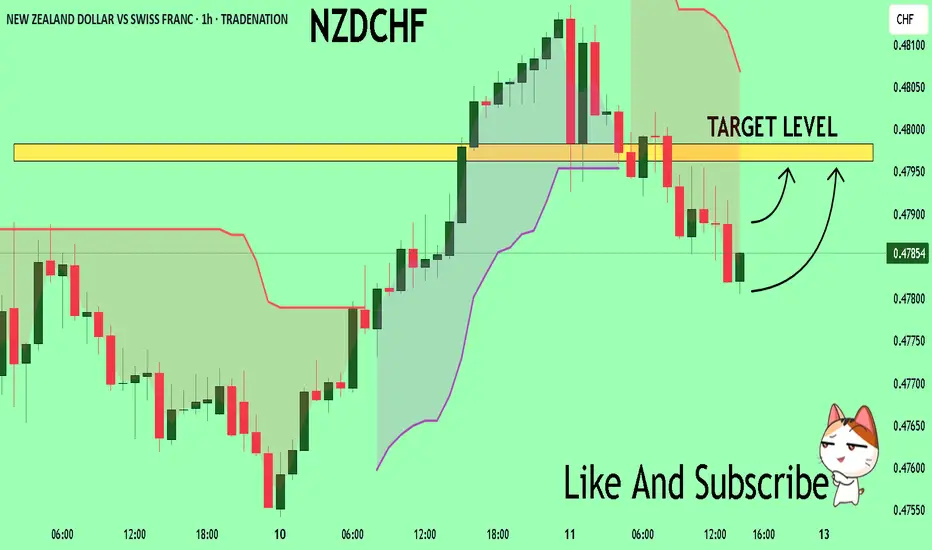
NZDCHF: A Clear Bullish Wedge PatternNZDCHF: A Clear Bullish Wedge Pattern
Today, NZDCHF broke out from a bullish Wedge pattern.
NZD looks strong today and breakout also looks strong.
If all goes well, NZDCHF should rise as shown in the chart.
It remains heavily manipulated because the SNB has been intervening over the past two weeks, making the CHF even stronger for no reason.
Can SNB invalidate this pattern? Yes, it is possible.
However, this time it is likely to rise again. So, let's see.
You may find more details in the chart!
Thank you and Good Luck!
PS: Please support with a like or comment if you find this analysis useful for your trading day
Disclosure: I am part of Trade Nation's Influencer program and receive a monthly fee for using their TradingView charts in my analysis.
NZDCHF I Daily CLS I Model 1 I Pullback entryYo Market Warriors ⚔️
Fresh Crypto Analysis— if you’ve been riding with me, you already know:
🎯My system is 100% mechanical. No emotions. No trend lines. No subjective guessing. Working all timeframes. Just precision, structure, and sniper entries.
🧠 What’s CLS?
It’s the real smart money. The invisible hand behind $7T/day — banks, algos, central players.
📍Model 1:
HTF bias based on the daily and weekly candles closes,
Wait for CLS candle to be created and manipulated. Switch to correct LTF and spot CIOD. Enter and target 50% of the CLS candle.
For high probability include Dealing Ranges, Weekly Profiles and CLS Timing.
Analysis done on the Tradenation Charts
Disclosure: I am part of Trade Nation's Influencer program and receive a monthly fee for using their TradingView charts in my analysis.
Trading is like a sport. If you consistently practice you can learn it.
“Adapt what is useful. Reject whats useless and add whats is specifically yours.”
David Perk aka Dave FX Hunter
💬 Comment any Coin I ll give you my quick view

BUY LIMIT FOR NZDCHF Title: NZDCHF - Potential Long Opportunity - 30-Minute
Description: "NZDCHF on the 30-minute timeframe is currently exhibiting choppy price action. The recent selling pressure is likely influenced by the CHF's safe-haven status. However, I am anticipating a potential bullish move.
Entry: I will consider entering a long position if the price breaks above a key resistance level at . Stop-Loss: Place a stop-loss order below the recent swing low at . Take-Profit: Target a take-profit level at , considering the next resistance level. Rationale: Despite the short-term selling pressure, the potential for a bullish reversal exists. The CHF's safe-haven status may be temporarily overshadowing the underlying strength of the NZD. A break above the resistance level would confirm the bullish bias
NZDCHF → Pre-breakdown consolidation on a downtrendFX:NZDCHF is forming a pre-breakout consolidation amid a downtrend. Focus on support at 0.4759. Global and local trends are down...
On July 10-11, the currency pair attempted to break out of the trend. In the chart, it looks like a resistance breakout, but technically it was a short squeeze aimed at accumulating liquidity before the fall. We can see that the price quickly returned back and the market is testing the low from which the trap formation began. The risk zone for the market is 0.4759 - 0.475. In simple terms, this is a bull trap against the backdrop of a downtrend. The NZD has passed through the risk zone. At this time, the currency pair is forming a pre-breakout consolidation relative to the support level of 0.4759 with the aim of continuing its decline.
Support levels: 0.4759, 0.4753
Resistance levels: 0.477, 0.4782
A breakout of the 0.4759 level and consolidation in the sell zone could trigger a continuation of the decline within the main and local trends.
Best regards, R. Linda!

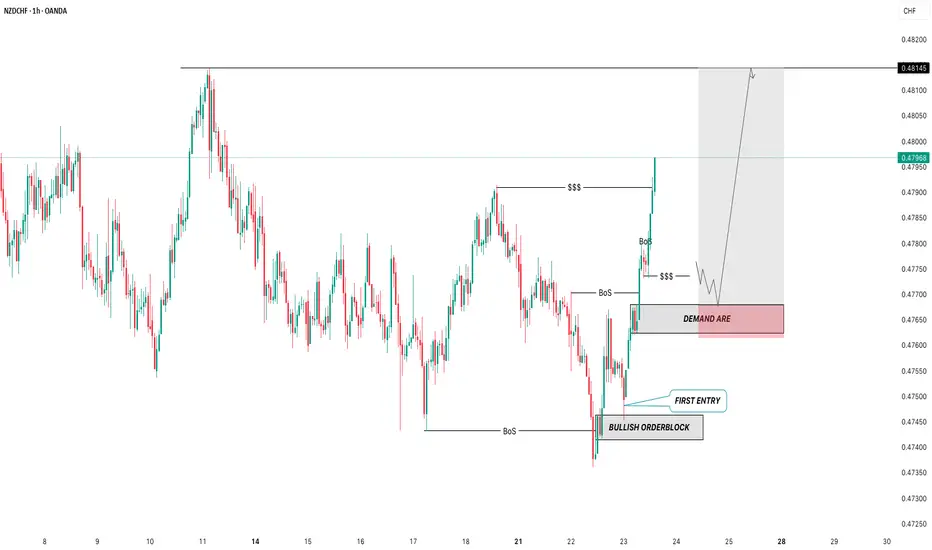
NZDCHF BUYSPrice was in a long downtrend, but sellers eventually lost strength. After a sharp selloff, the market began moving sideways — showing signs that larger players were quietly building positions while keeping price in a range.
Price then dipped below the range and quickly reversed, followed by strong buying that broke previous highs and shifted the overall structure from bearish to bullish. If that same buying pressure returns, we could see a continuation of the upward move as momentum builds.
Entry: 0.47629
Take Profit: 0.48139
Stop Loss: 0.47490

NZD-CHF Local Bearish Bias! Sell!
Hello,Traders!
NZD-CHF made a retest of
The horizontal resistance
of 0.4810 so we are locally
Bearish biased and we
Will be expecting a
Further bearish move down
Sell!
Comment and subscribe to help us grow!
Check out other forecasts below too!
Disclosure: I am part of Trade Nation's Influencer program and receive a monthly fee for using their TradingView charts in my analysis.

NZDCHF is in the Bearish Side due to Bearish TrendHello Traders
In This Chart NZDCHF HOURLY Forex Forecast By FOREX PLANET
today NZDCHF analysis 👆
🟢This Chart includes_ (NZDCHF market update)
🟢What is The Next Opportunity on NZDCHF Market
🟢how to Enter to the Valid Entry With Assurance Profit
This CHART is For Trader's that Want to Improve Their Technical Analysis Skills and Their Trading By Understanding How To Analyze The Market Using Multiple Timeframes and Understanding The Bigger Picture on the Chart

Is this movement happening in the CADCHF currency?
Hi dears
The currency seems to be in a downward trend. This currency is useful for those looking for a long-term trade.
If you like my analysis, just follow me 😄
SELL NZDCHF now for a 4h time frame bearish trend continuationSELL NZDCHF now for a 4h time frame bearish trend continuation
SELL NZDCHF now for a four hour time frame bearish trend continuation..........
STOP LOSS: 0.4788
This sell trade setup is based on hidden bearish divergence trend continuation trading pattern...
Always remember, the trend is your friend, so whenever you can get a signal that the trend will continue, then good for you to be part of it
TAKE PROFIT : take profit will be when the trend comes to an end, feel from to send me a direct DM if you have any question about take profit or anything.
Remember to risk only what you are comfortable with….....trading with the trend, patient and good risk management is the key to success here

NZDCHF: Will Keep Falling! Here is Why:
The recent price action on the NZDCHF pair was keeping me on the fence, however, my bias is slowly but surely changing into the bearish one and I think we will see the price go down.
Disclosure: I am part of Trade Nation's Influencer program and receive a monthly fee for using their TradingView charts in my analysis.
❤️ Please, support our work with like & comment! ❤️


NZD_CHF RISKY LONG|
✅NZD_CHF has retested a key support level of 0.4760
And as the pair is already making a bullish rebound
A move up to retest the supply level above at 0.4776 is likely
LONG🚀
✅Like and subscribe to never miss a new idea!✅
Disclosure: I am part of Trade Nation's Influencer program and receive a monthly fee for using their TradingView charts in my analysis.


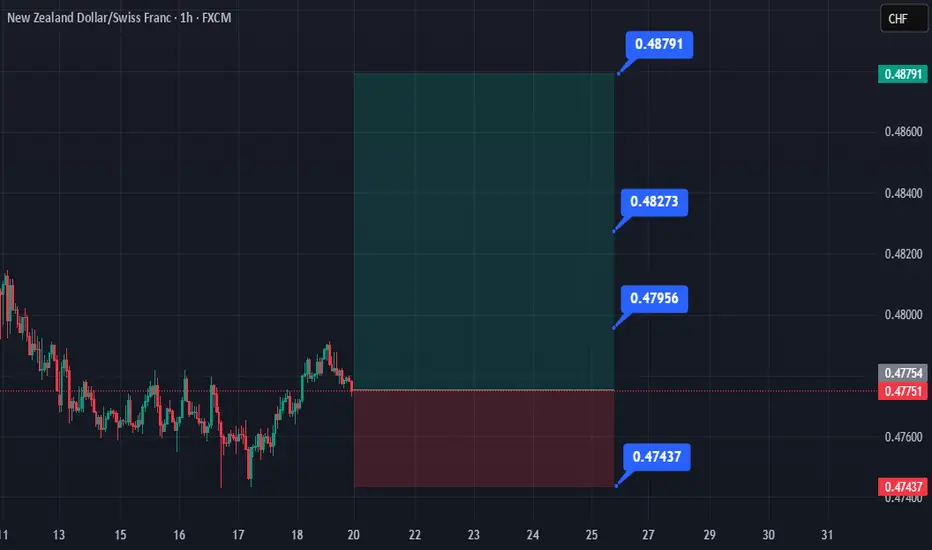
Bullish TradeI'm looking at taking this trade. I love buying so this looks appealing to my eye...
Entry - 0.47754
T.P 1 - 0.47956
T.P 2 - 0.48273
T.P 3 - 0.48791
S.L - 0.47437
#MrBullish
NZDCHF Shows Signs of Weakening Selling Pressure NZDCHF Shows Signs of Weakening Selling Pressure – Potential Reversal Ahead
The NZDCHF pair is exhibiting interesting price action as selling pressure appears to be losing momentum. The latest swing low was formed with strong bearish energy, but the subsequent decline has shown noticeably weaker downside momentum. This divergence suggests that sellers may be exhausting their control, creating an opportunity for buyers to step in.
Key Market Observations:
1. Decline in Bearish Momentum: While the secondary trend remains downward, the weakening selling pressure indicates potential buyer interest at current levels.
2. Possible Trend Reversal: If buyers regain strength, NZDCHF could see a short-term recovery, targeting 0.48800 and 0.49950 in upcoming sessions.
3. Critical Support Level: On the downside, 0.46700 remains a key support zone. A strong bounce from this level could confirm bullish reversal potential.
Trading Strategy:
- Buying Opportunity: Traders may watch for bullish reversal signals (e.g., bullish engulfing patterns, RSI divergence) near 0.46700 for potential long entries.
- Target Levels: A breakout above recent resistance could push price toward 0.48800, with extended gains possible up to 0.49950.
- Risk Management: A stop-loss below 0.46700 would protect against further downside if selling resumes.
Conclusion:
NZDCHF’s recent price action suggests that bears are losing dominance, opening the door for a corrective rally. Traders should monitor price reactions near 0.46700 for confirmation of a bullish reversal. A break above immediate resistance could accelerate gains toward higher targets, while a drop below support would indicate continued bearish control.

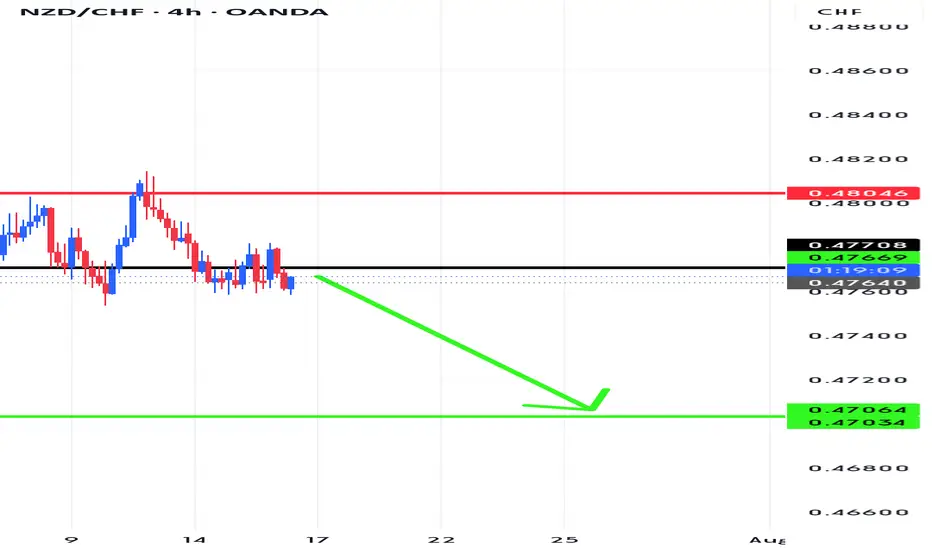
NZDCHF Will Move Lower! Sell!
Please, check our technical outlook for NZDCHF.
Time Frame: 4h
Current Trend: Bearish
Sentiment: Overbought (based on 7-period RSI)
Forecast: Bearish
The market is approaching a key horizontal level 0.475.
Considering the today's price action, probabilities will be high to see a movement to 0.472.
P.S
The term oversold refers to a condition where an asset has traded lower in price and has the potential for a price bounce.
Overbought refers to market scenarios where the instrument is traded considerably higher than its fair value. Overvaluation is caused by market sentiments when there is positive news.
Disclosure: I am part of Trade Nation's Influencer program and receive a monthly fee for using their TradingView charts in my analysis.
Like and subscribe and comment my ideas if you enjoy them!

NZDCHF REVERSALTechnically:
NZDCHF Printed bullish divergence
NZDCHF broke it's last lower high
NZDCHF broke bearish trend line which acted as support
NZDCHF retested bearish trend line which now acted as resistance
NZDCHF after printing first higher high retrace fib 0.812.

NZDCHF Long Trade based on COT ReportOANDA:NZDCHF Long trade, with my back testing of this strategy, it hits multiple possible take profits, manage your position accordingly.
This is good trade, don't overload your risk like greedy, be disciplined trader, this is good trade.
Use proper risk management
Looks like good trade.
Lets monitor.
Use proper risk management.
Disclaimer: only idea, not advice

NZDCHF My Opinion! BUY!
My dear friends,
Please, find my technical outlook for NZDCHF below:
The instrument tests an important psychological level 0.4784
Bias - Bullish
Technical Indicators: Supper Trend gives a precise Bullish signal, while Pivot Point HL predicts price changes and potential reversals in the market.
Target - 0.4796
About Used Indicators:
Super-trend indicator is more useful in trending markets where there are clear uptrends and downtrends in price.
Disclosure: I am part of Trade Nation's Influencer program and receive a monthly fee for using their TradingView charts in my analysis.
———————————
WISH YOU ALL LUCK
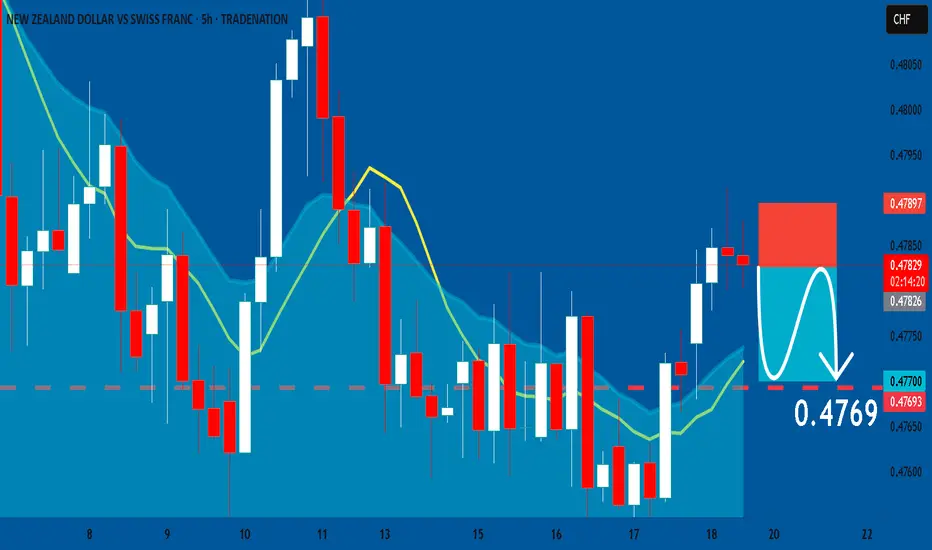
NZD/CHF BEARS ARE STRONG HERE|SHORT
Hello, Friends!
NZD/CHF is trending down which is clear from the red colour of the previous weekly candle. However, the price has locally surged into the overbought territory. Which can be told from its proximity to the BB upper band. Which presents a classical trend following opportunity for a short trade from the resistance line above towards the demand level of 0.475.
Disclosure: I am part of Trade Nation's Influencer program and receive a monthly fee for using their TradingView charts in my analysis.
✅LIKE AND COMMENT MY IDEAS✅
