NZDCHF Will Explode! BUY!
My dear friends,
Please, find my technical outlook for NZDCHF below:
The price is coiling around a solid key level - 0.5447
Bias - Bullish
Technical Indicators: Pivot Points Low anticipates a potential price reversal.
Super trend shows a clear buy, giving a perfect indicators' convergence.
Goal - 0.5476
Safe Stop Loss - 0.5428
About Used Indicators:
The pivot point itself is simply the average of the high, low and closing prices from the previous trading day.
———————————
WISH YOU ALL LUCK
CHFNZD trade ideas

NZDCHF The Target Is DOWN! SELL!
My dear friends,
Please, find my technical outlook for NZDCHF below:
The instrument tests an important psychological level 0.5485
Bias - Bearish
Technical Indicators: Supper Trend gives a precise Bearish signal, while Pivot Point HL predicts price changes and potential reversals in the market.
Target - 0.5463
About Used Indicators:
Super-trend indicator is more useful in trending markets where there are clear uptrends and downtrends in price.
———————————
WISH YOU ALL LUCK

Possible sell zoneWe see price broke structure to the downside and is now approaching the supply zone which broke the previous structure. We look forward to seeing a continuation of the bearish trend.


NZDCHFFUNDAMENTAL;NZD stronger than CHF
COT data long/short 72/28 CHF 12/86 %
SEASONAL; NZD bullish in JULY CHD side ways
SENTIMENTAL : long/short 29/71 %
TECHNICAL :break of bearish trend line
printing HH and HL
no bearish divergence
retraced to 0.51 area
near bullish channel bottom and support
ideal buying 0.61
trade at your risk
good luck

NZD-CHF Bearish Flag Breakout! Sell!
Hello,Traders!
NZD-CHF is trading in a
Downtrend and the pair
Broke out of the bearish
Flag pattern so we are
Bearish biased and we
Will be expecting a
Further move down
Sell!
Like, comment and subscribe to help us grow!
Check out other forecasts below too!

NZDCHFIn my opinion, the NZD/CHF currency pair is poised to decline in the coming days, continuing until it reaches the marked support level. Several factors contribute to this outlook, including recent economic data, market sentiment, and technical indicators. The New Zealand dollar may face pressure due to potential dovish signals from the Reserve Bank of New Zealand, while the Swiss franc could gain strength as a safe-haven asset amid global uncertainties. As a result, I believe that the NZD/CHF pair is likely to move downward in the near term, heading towards the specified support zone.

NZDCHF bearish ideabearish trend on daily chart, we see a big bearish candle as a good entry zone.
Good luck!

nzdchfnzdchf had previously broken its upward trend sharply. Then it received a reaction from the 0.54400 resistance and made an upward move. In this case, I think we can collect profits up to the 0.5440 region if the position is entered from the 0.5488 resistance, which is within the fair value gap.


NZDCHF: Bullish Continuation & Long Trade
NZDCHF
- Classic bullish setup
- Our team expects bullish continuation
SUGGESTED TRADE:
Swing Trade
Long NZDCHF
Entry Point - 0.5470
Stop Loss - 0.5454
Take Profit - 0.5496
Our Risk - 1%
Start protection of your profits from lower levels
❤️ Please, support our work with like & comment! ❤️

NZDCHF – should I short this? … the week of 08 July, 2024This pair is at a significant level of 0.5500 but I have to admit that I am a bit double minded. I want to go short, but cannot rule out a bullish continuation either. So let me list the Pros and Cons.
Pros
Preceding trend was bearish.
Price is consolidating in an upward sloping channel – also known as “bearish flag” pattern.
For the past 5 trading days, price has been unable to close above 0.5500.
Many wicks to the up side.
Cons
Price is above the 200dma.
Most recent price action is bullish.
Weekly chart is bullish, previous structure was broken.
The best way forward is to put this pair on our watch list and we make our own decision. Deciding not to trade this is a valid decision too.
This is not a trade recommendation, it is just my analysis.
You should be aware that trading carries a high level of risk, so only trade with money you can afford to lose. Please use sound money and risk management if/when you trade.
If you like my idea, please give a “boost” and follow me to get even more.
Please comment and share your thoughts too!!

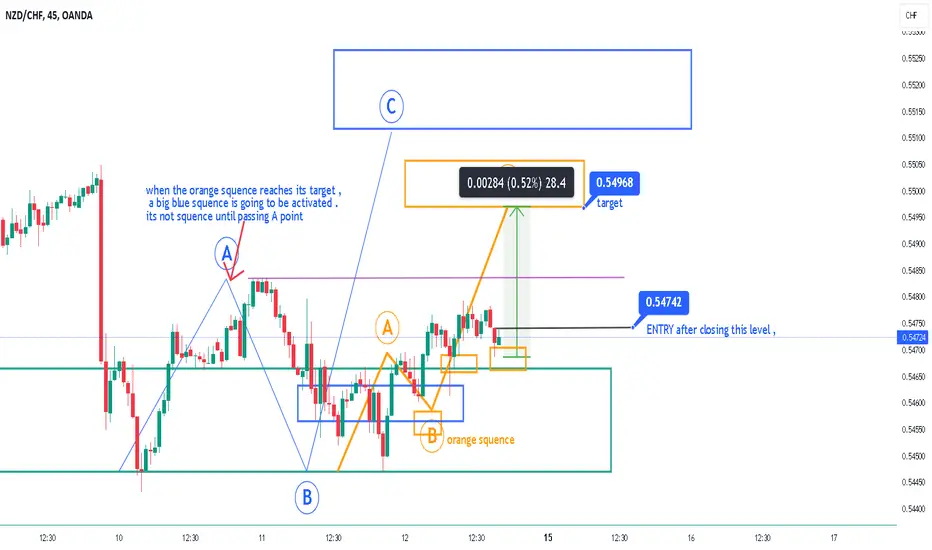
How I Caught the Spike Down on NZDCHF Using This Great StrategyIn this video, I explain the Restricted Market Structure strategy and how it differs from the traditional Market Structure strategy. You'll learn how to set up trades using this unique approach and discover which currency pairs are best suited for it, as well as which pairs to avoid.
Key points covered:
Detailed explanation of Restricted Market Structure strategy
Differences between Restricted Market Structure and Market Structure strategies
Step-by-step guide to setting up trades with the Restricted Market Structure strategy
Best currency pairs to use this strategy with and pairs to avoid
Real-life example with NZDCHF, showcasing how it caught the big drop on the H1 chart perfectly
Join me for an in-depth analysis and practical tips to enhance your trading skills. Don't forget to like, comment, and subscribe for more trading strategies and expert insights. Let's master the markets together! 🚀💹 And remember to hit the Boost Button on this video to support our Trading View community!
Disclaimer: Forex trading involves significant risk and is not suitable for every investor. Carefully consider your financial situation and risk tolerance before entering any trade. Always perform your own research and seek advice from a licensed financial advisor if needed.


NZD/CHF at the Brink: Is a Major Sell-off Imminent?📊 Introduction:
The rising wedge pattern is a technical analysis formation that often signals a potential reversal in an uptrend or the continuation of a downtrend. This pattern is characterized by converging trendlines, where both the highs and lows are rising but at different rates. The formation of a rising wedge usually indicates weakening momentum in the upward trend, which can lead to a bearish breakout and a subsequent downward movement in the price. In this analysis, we will examine the impact of this pattern on the NZD/CHF currency pair in the 4-hour timeframe.
🔍 Technical Analysis:
The NZD/CHF currency pair is currently in a downtrend on the 4-hour timeframe, and multiple indicators suggest that this bearish momentum may persist.
1. Candlestick Momentum:
o One of the primary indicators of the continued downtrend is the noticeable strength of the red candlesticks. These bearish candles not only dominate in size but also show stronger momentum compared to their green counterparts, indicating a prevailing selling pressure.
2. Rising Wedge Pattern:
o Another significant indicator is the formation of a rising wedge pattern. This bearish reversal pattern, characterized by converging trendlines, suggests a potential breakdown. If the price breaches the lower trendline of the wedge on the 4-hour chart, it is expected to decline to the pattern’s base.
3. Support and Resistance Levels:
o Given the persistent selling pressure observed in higher timeframes, a critical level to watch is the 0.5489 support. Should an hourly candle close below this support, it could trigger further declines, targeting the next key support level at 0.54131.
📉 Conclusion:
The NZD/CHF pair is under significant bearish pressure, with technical indicators pointing towards a continued decline. Traders should monitor the critical support levels and the behavior of candlesticks closely to make informed trading decisions. The rising wedge pattern's potential breakout and the strength of the red candlesticks are key factors suggesting further downside potential.
________________________________________
⚠️ Disclaimer: This analysis is for informational purposes only and does not constitute financial advice. Always conduct your own research before making any trading decisions.

NZD/CHF BEST PLACE TO SELL FROM|SHORT
Hello,Friends!
NZD/CHF uptrend evident from the last 1W green candle makes short trades more risky, but the current set-up targeting 0.541 area still presents a good opportunity for us to sell the pair because the resistance line is nearby and the BB upper band is close which indicates the overbought state of the NZD/CHF pair.
✅LIKE AND COMMENT MY IDEAS✅

NZFCHFNZDCHF is in strong bullish trend.
As the market is consistently printing new HHs and HLs.
currently the market is retracing a bit after last HH, which is also the 50% Fib retracement level and local support as well. if the market successfully sustain this buying confluence the next leg up could go for new HH.
What you guys think of this idea?

MY TRADE SETUP SELLING AREA NZDCHF Hello Friends
**NZDCHF SELL Trade Setup**
**Currency Pair:** NZD/CHF
**Trade Direction:** Sell (Short)
**Entry Point:** 0.55191
**Stop Loss:** 0.55272
**Take Profit:** 0.54257
**Technical Analysis:**
**Risk Management:**
1. **Position Sizing:**
- Ensure the position size is calculated based on your risk management rules, typically risking no more than 1-2% of your trading account on a single trade.
2. **Trade Management:**
- Monitor the trade closely for any signs of reversal or unexpected market movements.
- Adjust the stop loss to break even once the trade has moved in your favor by a certain amount (e.g., 50% of the take profit target).
**Conclusion:**
The NZD/CHF pair shows a strong bearish setup based on both technical and fundamental analysis. Entry at 0.55191 with a stop loss at 0.55272 and a take profit target at 0.54257 offers a favorable risk-reward ratio. As always, ensure to follow your trading plan and risk management rules.
---
Feel free to adjust the specifics according to your analysis and strategy!

NZDCHF shortThere is a bearish divergence which indicates a reversal. The ZXY index is bearish and CXY index is bullish which further supports my analysis.

NZDCHF - Bullish continuation (Short Term Trade)NZDCHF likely to go further up. If it continues, will test 4 hr resistance area. There is no divergence on RSI and already broke the previous support area. Buy Entry can be taken at FIB level of 0.5 with stop loss on previous LH.

NZDCHF Strong buy opportunity within the Channel Up.The NZDCHF pair delivered a fast-profit buy signal last time (May 09, see chart below), with the price even breaking above the established Channel Up:
A new Channel Up prevailed as seen on the current chart and since it held the Support of the 1D MA200 (orange trend-line), it broke again above the 1D MA50 (blue trend-line) and gave a bullish confirmation.
We expect the extension of the uptrend in the form of the new Bullish Leg of the Channel Up (1D RSI also rebounded on a bottom formation similar to all previous buy opportunities). Our Target is 0.56750 (Resistance 2).
-------------------------------------------------------------------------------
** Please LIKE 👍, FOLLOW ✅, SHARE 🙌 and COMMENT ✍ if you enjoy this idea! Also share your ideas and charts in the comments section below! This is best way to keep it relevant, support us, keep the content here free and allow the idea to reach as many people as possible. **
-------------------------------------------------------------------------------
💸💸💸💸💸💸
👇 👇 👇 👇 👇 👇
