NZD/CHFLooking to short the market once i get that third touch since price has broken previous low and closed below .
SWISS FRANC / NEW ZEALAND DOLLAR
No trades
Market insights

NZDCHFIs NZDCHF exhausting at resistance zone?
As the price is been on high bull run but now it seems like price is lacking bullish momentum after printing double top pattern at resistance level and bearish divergence( on lower time frame) suggesting the sell pressure is about to start.
If the bears took control , the 1st target could be 0.5400
What you guys think of it?

SELL NZDCHF - trade explained in detailTrader Tom, an investing.com technical analyst with over 15 years’ experience, explains his trade idea using price action and a top down approach. This is one of many trades so if you would like to see more then please follow us and hit the boost button.

NZDCHF BREAKOUT AND PULLBACK ON KEY LEVELWe recently observed a significant breakout and rally at a crucial level, followed by a price reversal back toward this key level where the initial breakout was confirmed. We now anticipate a retest of this level, expecting it to act as a support zone before another bullish reversal occurs.

NZDCHF – looking for pullback and bullish continuationThe recent bullish move by this pair has been restricted by the resistance zone around 0.54750. However, this zone was overcome about 2 weeks ago. After breaking through with momentum, price is now pulling back and I think it will find support at the same zone aided by the 50EMA.
Let’s see how this plays out.
This is not a trade recommendation.
Trading carries a high level of risk, so only trade with money you can afford to lose. Anything can happen in the markets at any time. Please use sound money and risk management in all your trades.
If you like my idea, please give a “boost” and follow me to get even more.
Please comment and share your thoughts too!!

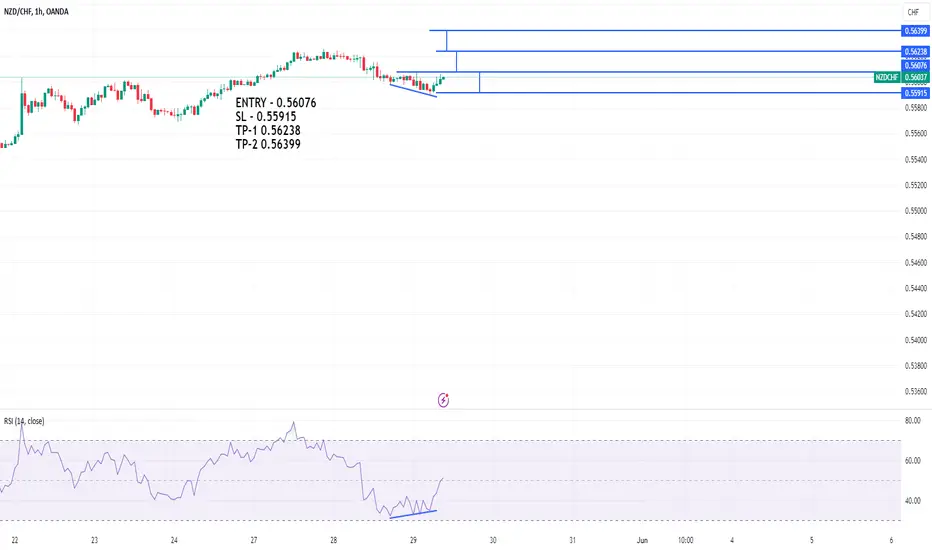
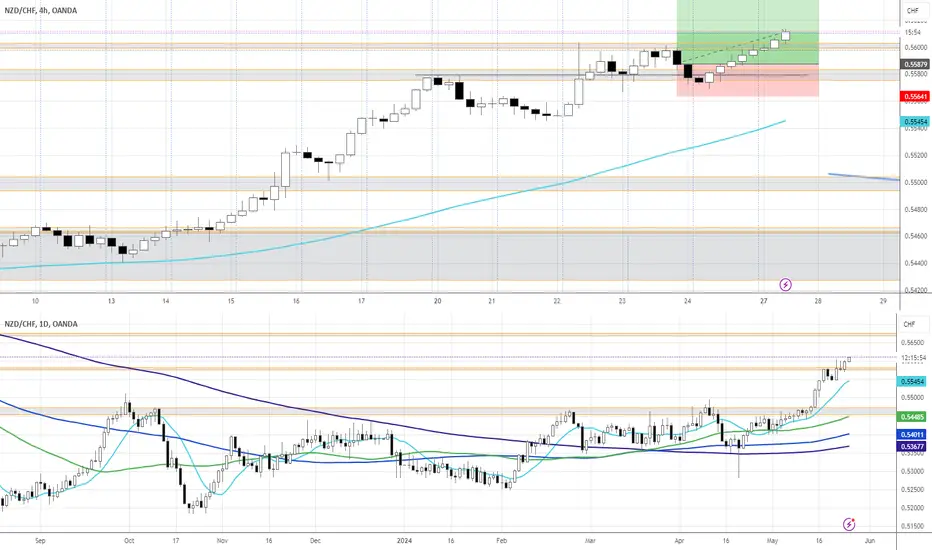
NZD CHF - 1H Time Frame - Long SetupOn 1H TF forming a bullish divergence. If we break the previous LH (0.56076).Entry / buy stop will trigger. If new lows are formed. The set up is invalidated. Good Luck
Buy The Strongest, Short The Weakest (May 23)Fundamentals & Sentiment
NZD:
- Hawkish comments from RBNZ
- Positive carry
- AUDNZD is in the mean reversion to the downside
CHF:
- SNB: "The SNB has already cut rates but it certainly sounds like there is more to come."
- Market is pricing in the cut with some more room to go (<60% chance)
Technical & Other
Setup: TC(B)
Setup timeframe: 1h
Trigger: 1h
Medium-term: Uptrend
Long-term: Uptrend
Min target: May highs
Risk: 0.43%
Potential Triple Top forming, could be bearish from herePrice tested this current zone 3 times this week and couldn't push further. With XXXCHF pairs all being currently well overbought on higher timeframes, there is a possibility that this could be a point in which price retraces back down to the previous major resistance zone, which has now turned support. 0.55 would be a good place for price to retrace back to.

NZDCHF: Long Trade Explained
NZDCHF
- Classic bullish pattern
- Our team expects retracement
SUGGESTED TRADE:
Swing Trade
Buy NZDCHF
Entry - 0.5541
Stop - 0.5511
Take - 0.5588
Our Risk - 1%
Start protection of your profits from lower levels
❤️ Please, support our work with like & comment! ❤️

NZDCHF LONGPrice Action Day Trading
Daily Bias: Bullish, Price broken through long term resistance and closed above
POI: Price is retracing back to the broken resistance after formed a higher high. Based on Currency Index, NZD is close to support level and CHF is close to resistance level. Based on those confluence, NZDCHF will have a higher chance of bullish reacting at the Resistance level.
Setup: H1 TF, Set a long trade at the broken resistance level targeting Daily Swing high. SL below H1 swing low below the Resistance level. R:R 1:3

Some Of My Entries And Reasons , How I Made +2000 Pips ?This Is An Educational + Analytic Content That Will Teach Why And How To Enter A Trade
Make Sure You Watch The Price Action Closely In Each Analysis As This Is A Very Important Part Of Our Method
Disclaimer : This Analysis Can Change At Anytime Without Notice And It Is Only For The Purpose Of Assisting Traders To Make Independent Investments Decisions.

NZDSCHF Short Set up with 3 ConfirmationsAs seen in the chart, a nice double top formation is developing. In double top patterns, it is crucial to observe divergence in the oscillators, which we can see here. Additionally, the price moving below the 50-hour moving average and the contraction of the uptrend further support my decision to enter a short trade.

NZDCHF - SELL
Example of trading NZ Open or wait for Aussey open
Using Currency Strength Chart below by boitoki
I could see after 2 hours that the NZD was heading lower
Open is Actually 10:00 if u use Forex 24hr Clock
But the New Day Starts at 9:00 so they still call that Asian Session or NZ open lets call it Pre open.
11:00 am u can get a good idea whats going on with the trend visually
I'm just saying this is a very Viable trading strategy if anyone wanted to pursue I, I know it's obviously not new but where is the EA ?
Especially Monday open usually NZD Aussey Dollar are Strong being Traded by them because they need to use them.
: )

NZD/CHF SELLERS WILL DOMINATE THE MARKET|SHORT
Hello,Friends!
Previous week’s green candle means that for us the NZD/CHF pair is in the uptrend. And the current movement leg was also up but the resistance line will be hit soon and upper BB band proximity will signal an overbought condition so we will go for a counter-trend short trade with the target being at 0.547.
✅LIKE AND COMMENT MY IDEAS✅

NZDCHF - Resistance Becomes Support 🚀Hello Traders !
On the daily time frame, the NZDCHF Price Broke a strong resistance level (0.55542 - 0.56043).
This key level becomes a new support level !
So, I predict a bullish move📈
------------------
TARGET: 0.56400🎯

ECONOMIC ANALYSIS LONGDetailed Report on the NZD/CHF Currency Pair
Fundamental Economic State
New Zealand:
GDP Growth: New Zealand's economy is projected to grow by 1.1% in 2024, following a significant slowdown due to tight monetary policy and a decline in private investment and government consumption. The GDP growth is expected to recover to 1.5% in 2025 (IMF) (FocusEconomics).
Employment Data: The unemployment rate is stable at around 4.0%, reflecting a tight labor market. Despite the economic slowdown, employment growth has remained relatively strong (OECD) (IMF).
Inflation Rates: Inflation in New Zealand has declined from its peak, currently around 3.0%, and is expected to fall further in the coming quarters. The Reserve Bank of New Zealand (RBNZ) has maintained a tight monetary policy to combat persistent inflationary pressures (IMF) (Stats NZ).
Retail Sales: Retail sales have seen a slight uptick in early 2024, ending a period of consecutive quarterly declines. This improvement is supported by rising consumer confidence and increased tourist arrivals (OECD) (FocusEconomics).
Trade Balances: New Zealand's current account deficit remains above its long-run average, although it has narrowed slightly due to lower domestic demand and reduced oil prices. Export growth has been supported by strong demand for agricultural products (IMF) (FocusEconomics).
Fiscal Policies: The New Zealand government is running a structural fiscal deficit, with spending-to-GDP ratio higher than expected due to responses to rising costs and weather-related events. The fiscal policy remains more expansionary compared to other advanced economies (IMF).
Switzerland:
GDP Growth: Switzerland's economy is experiencing moderate growth with projections of around 1.5% for 2024. The economy remains stable, supported by robust industrial production and strong financial services sector (IMF) (FocusEconomics).
Employment Data: Switzerland boasts a low unemployment rate, consistently below 3.0%, reflecting a highly efficient labor market and strong demand for skilled labor (IMF).
Inflation Rates: Swiss inflation remains low, around 1.5%, which is well within the target range of the Swiss National Bank (SNB). The country's strong currency and stable economic environment contribute to subdued inflationary pressures (IMF).
Retail Sales: Retail sales in Switzerland have shown steady growth, driven by high consumer confidence and robust domestic consumption. The stable economic environment supports continuous retail sector expansion (IMF).
Trade Balances: Switzerland maintains a significant trade surplus, driven by high exports of pharmaceuticals, machinery, and financial services. The strong Swiss franc continues to support the country's trade balance (IMF).
Fiscal Policies: Switzerland's fiscal policy is characterized by prudence and sustainability. The government runs a budget surplus and maintains low public debt levels, ensuring long-term economic stability (IMF).
Daily Percentage Changes
Over the past month, the NZD/CHF exchange rate has experienced fluctuations driven by various economic data releases and market events. Key movements include:
Early May 2024: A decline in NZD following weak economic data from New Zealand, including lower-than-expected GDP growth figures.
Mid-May 2024: An increase in NZD driven by stronger retail sales and consumer confidence data, along with a slight improvement in inflation rates.
Late May 2024: Volatility due to geopolitical tensions and speculation around central bank policy decisions in both New Zealand and Switzerland (OECD) (IMF) (FocusEconomics).
News Analysis
Recent news impacting the NZD/CHF exchange rate includes:
RBNZ Announcements: The RBNZ's decision to maintain a tight monetary policy has led to periods of stability for the NZD (IMF) (Reserve Bank of New Zealand).
Swiss Economic Data Releases: Strong Swiss industrial production and low inflation have supported the CHF, contributing to its strength against the NZD (IMF) (FocusEconomics).
Geopolitical Developments: Global economic uncertainties and trade negotiations have influenced market sentiment and currency valuations (IMF) (FocusEconomics).
Interest Rate Expectations
RBNZ: The RBNZ is expected to maintain its current interest rate of 5.5% through 2024, with potential adjustments depending on inflation and economic growth trajectories (IMF) (Reserve Bank of New Zealand).
SNB: The Swiss National Bank is likely to keep interest rates low, around 1.5%, to support economic growth and maintain price stability. The SNB's cautious approach to monetary policy supports the stability of the CHF (IMF).
Commodity Prices and Market Sentiment
Dairy and Agricultural Products: New Zealand's economy heavily relies on exports of dairy and other agricultural products. Fluctuations in global demand for these commodities significantly impact the NZD (IMF).
Gold: As a safe-haven asset, gold prices influence the CHF. Strong gold prices support the CHF, reflecting its role as a stable currency in times of economic uncertainty (IMF).
Projection Figures
Based on current economic data and trends, the NZD/CHF exchange rate is projected to be around 0.57 by the end of June 2024. This projection considers stable commodity prices, steady interest rates, and moderate economic growth in both countries (IMF) (FocusEconomics).
Trade Ideas
Short-term: Consider going LONG on NZD/CHF at current levels (around 0.55) with a target of 0.57, based on expected improvements in New Zealand's economic indicators and steady Swiss economic performance.
Long-term: A cautious LONG position could be taken with a target of 0.58, assuming a gradual improvement in global economic conditions and positive impacts from fiscal policies in both countries (IMF) (FocusEconomics).
Current Price Consideration
As of now, the NZD/CHF is trading around 0.55. The projections and trade ideas are aligned with this current price, ensuring relevance and accuracy based on the latest economic data and market conditions (IMF) (FocusEconomics).
Additional Considerations
Global Macroeconomic Trends: The global economic outlook, particularly developments in major economies like China, will continue to influence the NZD/CHF pair.
Seasonal Trends: Historical data indicates that certain seasonal patterns may affect currency movements, which should be considered in the analysis.
By keeping these factors in mind, the provided projections and trade ideas aim to offer precise and realistic guidance based on thorough economic analysis.
