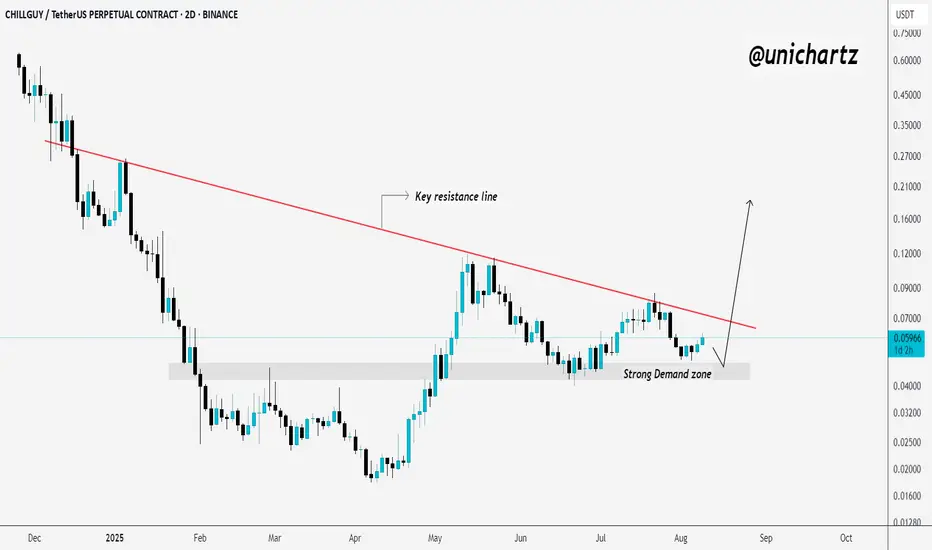
CHILLGUY Setup Heating Up — Break and Fly!If $CHILLGUY can break and close above the descending resistance line, it could spark a strong bullish move, potentially pushing the price toward the $0.10 level.
Until then, bulls need to maintain momentum and defend key support to keep this breakout scenario alive.
DYOR, NFA
$CHILLGUYUSDT – Second Chance Before the Breakout?Getting a second chance to enter $CHILLGUYUSDT.
Price is still basing out and holding key levels—looking constructive.
I’m adding here and will continue to do so as long as this structure holds.
The path remains tilted to the upside for now.
15 cents still firmly on the horizon.

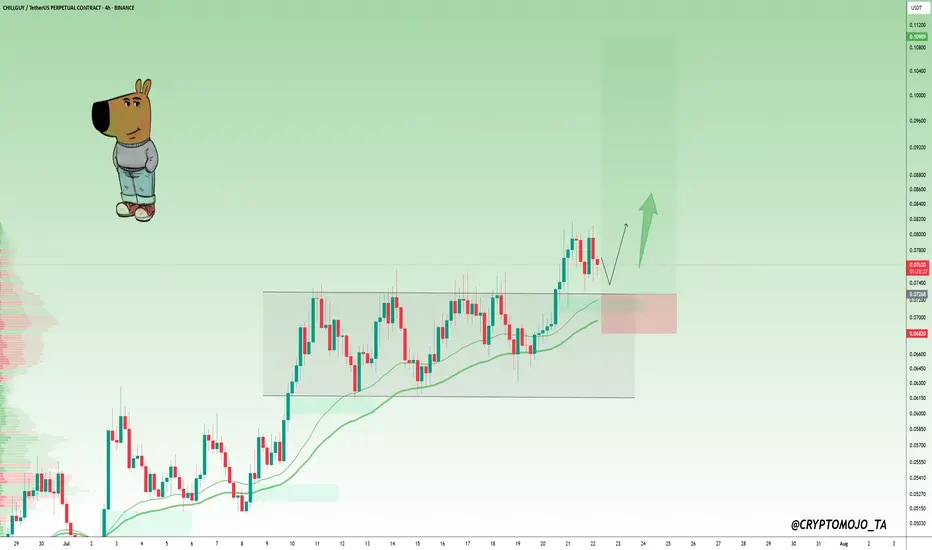
CHILLGUY Rebound Zone, Targets in Sight!#chillguy
Price is still holding above the key trendline and support zone. Buyers have stepped in again from this level, and the chart shows a potential bounce setup.
If this area holds, CHILLGUY could continue upward.
Entry Zone: Around $0.066–$0.068
Stop Loss: Below $0.062
Targets:
Target 1:

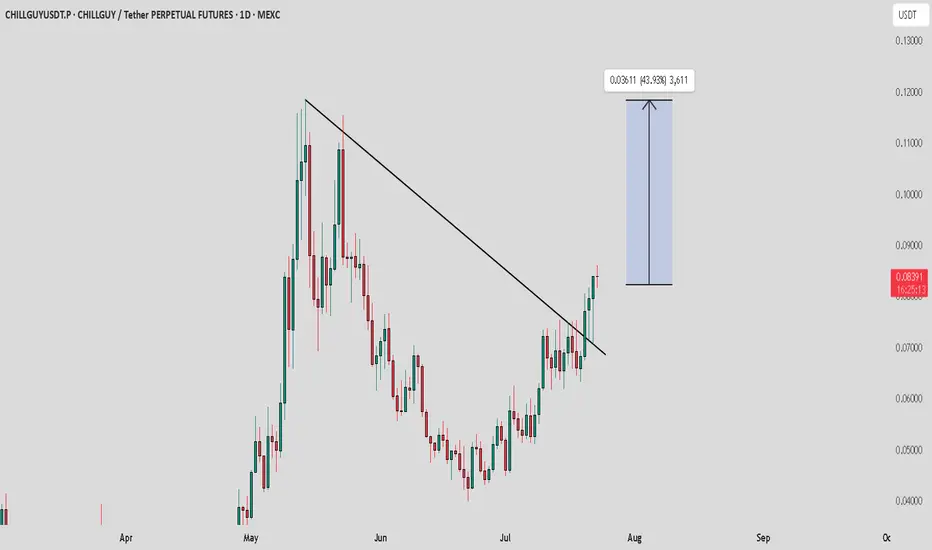
$CHILLGUY Bounce Ahead? +33% Potential$CHILLGUY just bounced off the support in its rising wedge on the 4H chart.
If the trend holds, we could see a 33% move toward the $0.08938 zone.
But if it breaks below, the setup’s off, so watch closely and manage risk.
DYOR, NFA

#CHILLGUY LONG!#CHILLGUY
Price is respecting a strong trendline support while also holding above the support zone. Buyers have stepped in near this level multiple times.
If the trendline holds, this could be the next bounce area for continuation.
Entry Zone: Around $0.072–$0.074
Stop Loss: Below $0.066
Targets

CHILLGUY / USDT : Trend shift and Retest confirmedChillGuy/USDT - Trend Shift & Retest
ChillGuy/USDT has fully shifted its trend, and after a successful retest, we expect a strong pump towards $0.10 - $0.12 soon.
Bullish Scenario:
Successful retest confirms the trend shift, leading to a potential move towards $0.10 - $0.12.
Pro Tip:
Keep a cl
#CHILLGUY Retest in Motion, $0.11 Next?#CHILLGUY Breakout Retest in Progress
CHILLGUY has broken out of its recent sideways range and is now pulling back for a possible retest.
The previous resistance zone around $0.072–$0.073 is now acting as support.
As long as the price stays above this level, the setup remains bullish. A success
$CHILLGUY breakout done!$CHILLGUY has initiated a validated breakout from a multi-month symmetrical triangle consolidation on the 1D timeframe — accompanied by increasing volume, confirming structural expansion. 📈📊
📐 Target projections (Fibonacci & measured move-based):
• Short-term: $0.10
• Mid-term: $0.18215 (0.236), $0

CHILLGUY – Ideal Entry After Retrace - 2x incoming!Best time to enter on $CHILLGUY—been waiting for a retrace, and we finally got it.
Anything near $0.055 is a solid buy if you missed the green zone entries.
The 3D chart is already signaling strong demand, and both downtrend signals from the local top have expired.
Expecting this one to trend fas

$CHILLGUY Breakout Confirmed, Retest in Progress!#CHILLGUY just broke out after weeks of accumulation.
The price was stuck in a tight range for nearly a month, forming a clear symmetrical triangle just under major resistance. After multiple tests, bulls finally pushed through both the trendline and horizontal resistance around $0.054–$0.056.
Thi

See all ideas
Summarizing what the indicators are suggesting.
Oscillators
Neutral
SellBuy
Strong sellStrong buy
Strong sellSellNeutralBuyStrong buy
Oscillators
Neutral
SellBuy
Strong sellStrong buy
Strong sellSellNeutralBuyStrong buy
Summary
Neutral
SellBuy
Strong sellStrong buy
Strong sellSellNeutralBuyStrong buy
Summary
Neutral
SellBuy
Strong sellStrong buy
Strong sellSellNeutralBuyStrong buy
Summary
Neutral
SellBuy
Strong sellStrong buy
Strong sellSellNeutralBuyStrong buy
Moving Averages
Neutral
SellBuy
Strong sellStrong buy
Strong sellSellNeutralBuyStrong buy
Moving Averages
Neutral
SellBuy
Strong sellStrong buy
Strong sellSellNeutralBuyStrong buy
Displays a symbol's price movements over previous years to identify recurring trends.