NAS100 Update - Potential TargetsDear Fellow Traders,
How I see it:
NASDAQ Stocks will remain in a sell off phase this quarter.
My "BEARISH" targets in case "DAILY TREND RESISTANCE" holds -
* TP1 & TP2 as indicated.
My "BULLISH" targets in case "DAILY TREND RESISTANCE" is breached -
* TP1 & TP2 as indicated.
KEYNOTE:
Bullish TP 2 = 78.60% FIB retracement from ATH
Feel free to ask if anything is unclear.
Thank you for taking the time to study my analysis.
NDAQ100 trade ideas

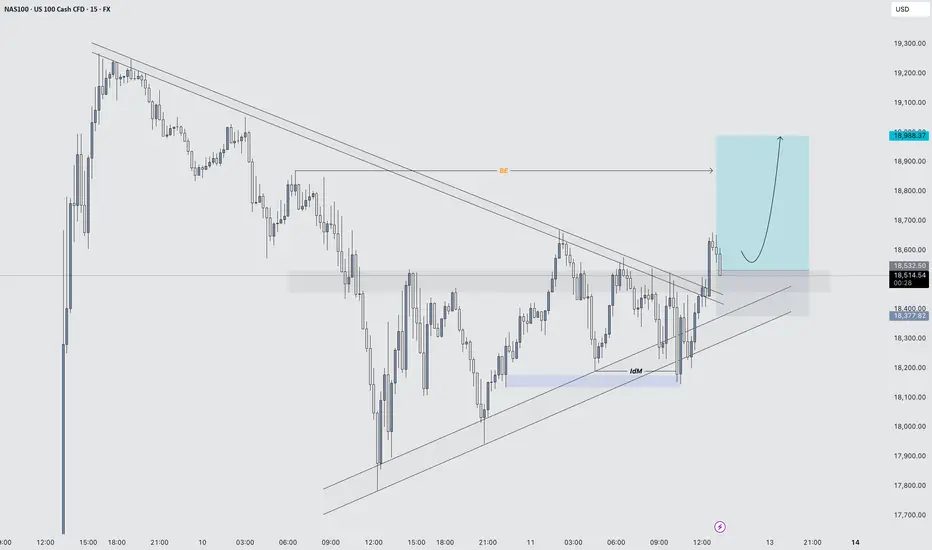
NAS100 (15min) – Bullish Entry Activated1. Symmetrical Triangle Formation
Price was compressing inside a symmetrical triangle, with a series of lower highs and higher lows, indicating indecision and buildup of pressure.
2. Downside Fake-out (False Breakout)
Price briefly broke below the lower trendline, suggesting a potential bearish breakout.
However, there was no strong follow-through; instead, price quickly reclaimed the trendline and pushed back inside the structure.
This is a classic fake-out, often trapping late sellers and providing liquidity for buyers.
The rejection from the lows resulted in a long wick, signalling strong buying interest and failure to break down.
3. Aggressive Bullish Reaction
After reclaiming the triangle support, price moved rapidly back to the top of the triangle.
The next key move was a strong breakout above the upper trendline, confirming bullish intent.
4. Break and Retest
Price action followed through with a clean breakout above resistance, followed by a minor pullback and retest of the broken trendline, which held as support.
This retest offered a textbook entry point based on price action principles.
5. Bullish Structure Confirmation
Post breakout, price formed a higher low and continued to make a higher high, confirming a trend shift.
This structural change strengthens the bullish outlook.
Nasdaq Buy Now This trade is Based on ICt concept
Used only 1% Risk
Book 50% Trade after 20 pips Profit

Nas tariff trade idea Looking for nas sells with escalations in tariff war. I will make sure global equities push lower alon with oil pushing lower and recession fears coming back in the market
looking for buys on nas if de escalations happen and we can see oil above 60 and global markets pushing up

NAS100 Stuck in Limbo – Breakout Brewing or Breakdown Coming?The NAS100 is caught in a see-saw of indecision, dancing between trendline resistance above and support below. No need to guess the outcome—momentum will tip its hand soon. We're planning to straddle the move with a one-cancels-the-other (OCO) setup and let the market choose the direction. Stay patient, stay ready.

Nasdaq downtrend prevails till it breaks 19200 ResistanceNasdaq downtrend prevails till it breaks 19200 Resistance.

The Nasdaq 100 is exhibiting a strong short-term bearish trend. 📉 Technical Analysis (Short-Term):
The Nasdaq 100 is exhibiting a strong short-term bearish trend.
CentralCharts
The index is trading below its 200-day moving average, indicating potential market weakness and possibly the start of a downtrend.
Business Insider
Key resistance levels are around $20,275–$20,382; a breakout above this range could signal a bullish reversal.
TradingView
Support is observed near $18,872; a break below this level may lead to further declines.
TradingView
🧠 Fundamental Analysis:
The Nasdaq 100 concluded Q1 2025 with a loss of 8.6%, reflecting a challenging start to the year.
Seeking Alpha
Upcoming Q1 earnings reports from major tech companies, including Netflix and TSMC, are anticipated to influence market direction.
FX Leaders
Persistent inflation above the Federal Reserve's target and signs of a weakening job market are contributing to economic uncertainty.
Business Insider
💬 Sentiment Analysis:
Investor sentiment is currently bearish, with the Nasdaq 100 having fallen over 8% in March, marking the worst monthly performance since late 2022.
MarketWatch
Concerns over trade tensions, inflation, and potential stagflation are weighing on market confidence.
Business Insider
Despite the downturn, April's historical performance as a strong month for U.S. stocks may offer buying opportunities amidst volatility.

NAS100 Playbook For The Week Friday closed around 18,783, likely in the midst of wrapping up Wave 5 on the 1H timeframe ⚠️
However, the daily Wave 5 still looks incomplete — my upside target remains around 19,732.
Notably, price hasn’t tapped the Wave 3 daily high at 19,258, so there’s still room for one more push 📈
What I’m Watching:
🔻 Short-term pullback likely.
Here are the zones I’m eyeing for potential shorts:
🔹 1H Wave 2 FVG zone → 18,098
🔹 Daily FVG / Wave 2 bottom → 17,573
I’ll be looking to short into one of those levels IF structure confirms, then potentially flip long once we see a solid move on the daily 💥
—
Trading structure over signals — let the wave tell the story 🌊
#NAS100 #ElliottWave #MarketStructure #kushstratedFX

monday long opportunity for nasdaq1. From the daily chart perspective, I believe a short-term bottom has already formed, but the stop-loss level is too far for a long position, so it’s better to seek a low-entry buy. Last Friday, it reached a support level, but I wasn’t firm enough so i didn't enter. BUtT, we can PATIENTLY wait for a lower point to buy here.
monday plan:
On the 1-hour timeframe, resistance is at 19100-19300 (which is also the 4-hour resistance), and support is at 18200-17800.
Look for buying opportunities on Monday, with real-time updates afterward, stop-loss at 17600.
TARGET IS 19100-19300.
If price goes up directly, i will wait 19100-19300 for a short opportunity instead.

NAS100 (US Tech 100) OUTLOOK🟢 NAS100 bounced hard from the 17,922 support zone after a sharp drop, now printing bullish momentum going into the new week.
🔑 Marked Levels:
• Support: 17,922 🛡️ | 16,600 🩸
• Resistance: 19,225 ❌ | 19,860 ❌ | 20,347 ❌
📈 Scenarios to Watch:
• Bullish: Break and hold above 19,225 may lead to a push toward 19,860 and 20,347.
• Bearish: Rejection at 19,225 could send price back to 17,922 or lower.
⚠️ No need to chase — wait for clean setups and respect your risk. 🎯
📘 This is not financial advice. Trade safe and stick to your plan.

NQ: Upcoming Weekly Analysis!Happy week!
ST/Mt/Lt Outlook: SELL
FA Analysis:
1- US is in or about to be in RECESSION.
2- US is isolating itself from the world economy; from the driver seat.
3- 90-days tariff pause: Market relief, recovery period; it's absolutely not a "buying the dip" strategy!
4- Inflation (CPI and PPI) are softening surprisingly!!! The explanation might be from a lower demand (considering the recession/economy slowing down); So this is not necessary the right softening inflation that the FED is looking for.
5- The FED will use the inflation softening to cut rates.
6- On the other hand, Tariffs will increase inflation.
7- Also, Consumer sentiment is at lowest level.
8- Bonds are skyrocketing (Follow U10y and U30y). Trump wants them down but market is pushing them up to make pressure on him to withdraw the tariffs. Hence, Trump will intervene with carrots and candies every time Y10y, e.g., breaks 4.5%.
9- Dollar is loosing foot whereas Gold is seeking the sky. Money is flying outside USA.
Next week is soft in terms of economic data beside ECB meeting and Trump's tweets.
TA Analysis:
Weekly TF:
a- As the outlook is Sell, here is a chart based on Waves theory.
b- I consider Wave 1 completed and price is in retrace to complete Wave 2 (between 50-61.8 fib) (Yellow box)
c- The current wave 2 might take few other days/weeks (at least 2). This wave 2 is supported by the 90-days pause, the Inflation softening and the FED cutting rate next meeting.
(Note: I invite you to keep this chart close to your eyes:))
Daily TF:
FY awareness, each wave has at least 3 moves: Initial swing; Retrace' and Impulsive swing.
Wave 2 has already made both Initial and retrace swings. We should expect to see the last impulsive swing.
From TA, the daily close was irrelevant; it was inside inside previous daily candles!
Happy green week to Everyone!

Market outlook on NasdaqI think the Nasdaq will retest the recent low and it is likely to break and get to fib extension 14500-15000

Market on Edge: Tariffs, Tension, and Market Turmoil(The following is for informational purposes only and reflects personal opinions, not investment advice. Please exercise your own judgment before making any financial decisions.)
In the coming weeks, the U.S. stock market is likely to remain driven by news flow, with investors closely watching the Trump administration’s policies on tariffs.
Last week, market sentiment remained extreme fearful as the impact of the tariff measures continued to ripple through the markets. The U.S. bond market sell-off prompted President Trump to announce on Wednesday a 90-day delay on tariff implementation for countries other than China. This announcement triggered a sharp market rebound that forced many short sellers to cover their positions. However, as the tariff delay did not fundamentally resolve the underlying uncertainty surrounding trade policies, the market failed to sustain its gains on Thursday and Friday.
At present, U.S.-China trade tensions continue to escalate, and no successful trade agreement has been announced yet. The market is seeking more concrete positive developments—such as tax cuts from the Trump administration, or the signing of trade agreements with major economies that include tariff reductions—before uncertainty can be lifted and a meaningful rebound achieved.
For now, it is better to remain patient and let the news develop, with minimal trading activity. Market direction will largely depend on future actions from the Trump administration and the Federal Reserve, making it difficult to rely on technical analysis alone to determine the market trend.
Currently, the 19,988–20,382 range serves as a critical resistance zone. A breakout above 20,382, sustained over time, would indicate that bulls are gaining control. Conversely, if the price stays consistently below 20,275, it suggests that bears remain dominant.
Until clear, favorable news emerges, further downside in the market is possible. However, shorting at these levels also carries significant risk, as any policy shift or positive announcement from Trump could trigger another sharp rebound—similar to what occurred last Wednesday.

US 100 - Ranges overview Let's see what the charts are telling us on US 100.
Just like US 30 US 100 retraced and is currently in a redistribution phase.
From a HTF, as long as we hold 16771.6 expect us aggressively trade towards 19000 and 20500.
IF we fail to hold 16771.6 expect us to retrace towards the 16771.6 and 15201 range. Any clean close below 16771.6 and the market will aggressively seek the sellside liquidity around 15201.
As always WAIT FOR THE MARKET TO SHOW YOU ITS HAND.
Stay safe and never risk more than 1-5% of your capital per trade. The following analysis is merely a price action based analysis and does not constitute financial advice in any form.

NDQ100 Weekly projection as of 13 April 2025Based on the chart pattern I have seen for NDQ100, I believe that NDQ100 will make a big correction before it can fly higher compare to the previous HH.
Let's us see together and trade together.
Hi, I am new and would appreciate if everyone can share your insights too. Thanks

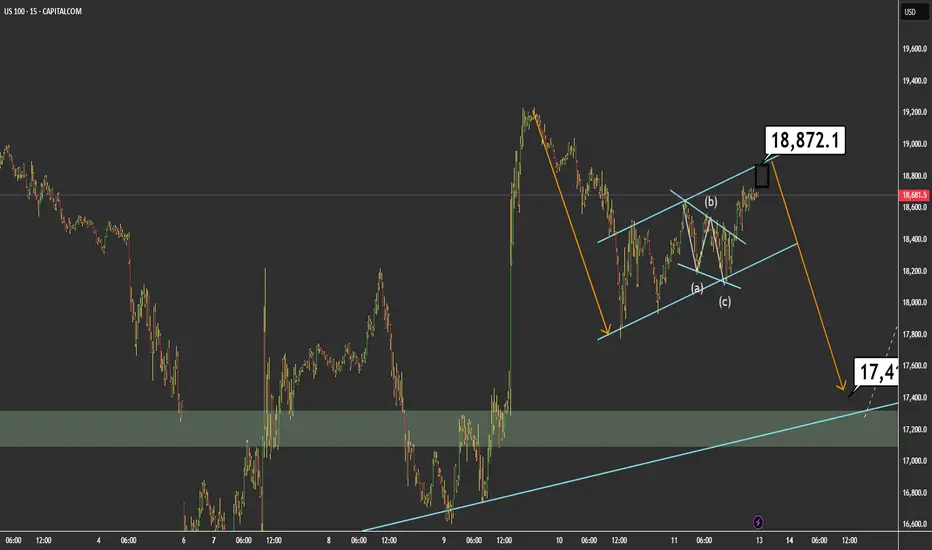
Likely Bullish Gap at Open Followed by a Sharp Drop📈 US100 – Likely Bullish Gap at Open Followed by a Sharp Drop 📉
On the 15-minute chart of the US100, we can see a corrective structure forming within an ascending channel, likely representing wave (B) of a larger correction. The price is currently near the top boundary of the channel, around 18,872.1.
🔍 Key Technical Highlights:
Clear prior bearish impulse.
Ongoing corrective move within a rising channel.
ABC correction forming inside the channel.
Potential rising wedge, suggesting bullish exhaustion.
📌 Main Hypothesis: I expect the market to open with a bullish gap, potentially reaching or briefly exceeding the 18,872.1 level, before starting a stronger downward move toward 17,411.8, which aligns with a key support zone and broader trendline confluence.
📊 Key Levels:
Resistance: 18,872.1 (ideal reversal area)
Target Support: 17,411.8
⚠️ Alternative Scenario: A strong breakout and consolidation above the channel could invalidate the bearish setup and suggest a continuation to the upside.
💡 Conclusion: This move would fit well within a broader corrective pattern, offering a technical pullback before any potential continuation. I’ll be watching the open closely for confirmation.
💼 Trade Idea:
🔹 Strategy: Short from resistance
🔹 Suggested Entry: 18,850 – 18,880 (potential gap zone and upper channel resistance)
🔹 Stop Loss: Above 18,920 (outside channel and above recent highs)
🔹 Take Profit: 17,500 – 17,450 (key support zone / technical target)
🔹 Risk/Reward Approximation: 1:4
🧠 Wait for price action confirmation (rejection, bearish engulfing candle, or intraday structure break before entering).