SELL NAS100 - TEXT BOOK SET UPFollowing the trend. The trend has been making LHs and LLs. I am just following the trend nothing much.
NDAQ100 trade ideas

NASDAQ Analysis Stalking shorts on the Daily - nearby.
My weekly sentiment is bearish cause of technical factors.
Among the catalysts is bullish performance on the US Dollar index and price action compared to the US30 & US500.
Look to sell near 4H swing high, entry using the 15M bearish ChoCh only after three legs of bullish correction on the 1H frame into the highlighted levels of the swing high.
Anticipation is for the third leg to react bearish and the fourth leg to deliver impulse to the sell side.

SELL-THE -RALLY :Swing trade limit Trend & Structure Broken
The green up-trend line and the last swing low were breached (you saw a BOS and CHoCH). That’s your first clue that buyers have lost control.
Failed Rally into Supply
When price pulled back up, it stalled under the old swing high / “equilibrium” zone. It never made a fresh higher high—so there’s no reason to chase longs.
Entry (Blue @ ~21,689) 🔵🚀
After price broke the rising trendline and the last swing low, it rolled back up into the equilibrium/supply area. That gives you a “sell-the-rally” entry at the blue level—where late buyers and remaining shorts congregate.
Stop-Loss (Red @ ~22,071) 🔴❌
Placed just above the prior swing high and the upper edge of the supply zone. If price pops above this red line, it signals the short setup has failed and bulls are back in control.
Take-Profits (Greens @ ~21,448 → 21,066 → 20,718 → 20,306) 🟢🎯
These green levels are the next pockets of demand/value below:
21,448 – the minor PDL/PWL area 📉
21,066 – first major demand zone 💰
20,718 – deeper value area 📦
20,306 – unfilled gap that often attracts fast buyers ⚡
Happy trading! 👍

My View on NAS1001. Price has been trending up for a long time.
2. A possible Reversal Pattern spotted
3. Head and Shoulder Pattern
4. Almost all elements of the Pattern have appeared
5. Refer to the Chart for entry details
6. Apply proper risk management based on your account size.
"Direction is Better than Speed"
Aliyu Gital

Hanzo / Nas100 30 Min ( Accurate Tactical Break Out Zones )🔥 Nas100 – 30 Min Scalping Analysis (Bearish Setup)
⚡️ Objective: Precision Breakout Execution
Time Frame: 30-Minute Warfare
Entry Mode: Only after verified breakout — no emotion, no gamble.
👌Bullish After Break : 21710
Price must break liquidity with high volume to confirm the move.
👌Bullish After Break : 21550
Price must break liquidity with high volume to confirm the move.
☄️ Hanzo Protocol: Dual-Direction Entry Intel
➕ Zone Activated: Strategic liquidity layer detected — mapped through refined supply/demand mechanics. Volatility now rising. This isn’t noise — this is bait for the untrained. We're not them.
🩸 Momentum Signature Detected:
Displacement candle confirms directional intent — AI pattern scan active.
— If upward: Bullish momentum burst.
— If downward: Aggressive bearish rejection.
Hanzo / Nas100 30 Min ( Accurate Tactical Break Out Zones )

Nasdaq-100 Wave Analysis – 19 June 2025- Nasdaq-100 reversed from long-term resistance level 22000.00
- Likely to fall to support level 21000.00
Nasdaq-100 index recently reversed down from the major long-term resistance level 22000.00 (which has been steadily reversing the price from the end of last year).
The downward reversal from the resistance level 22000.00 will form the weekly Shooting Star candlesticks reversal pattern if the price closes this week near the current levels.
Given the strength of the resistance level 22000.00 and the overbought weekly Stochastic, Nasdaq-100 index can be expected to fall to the next support level at 21000.00.

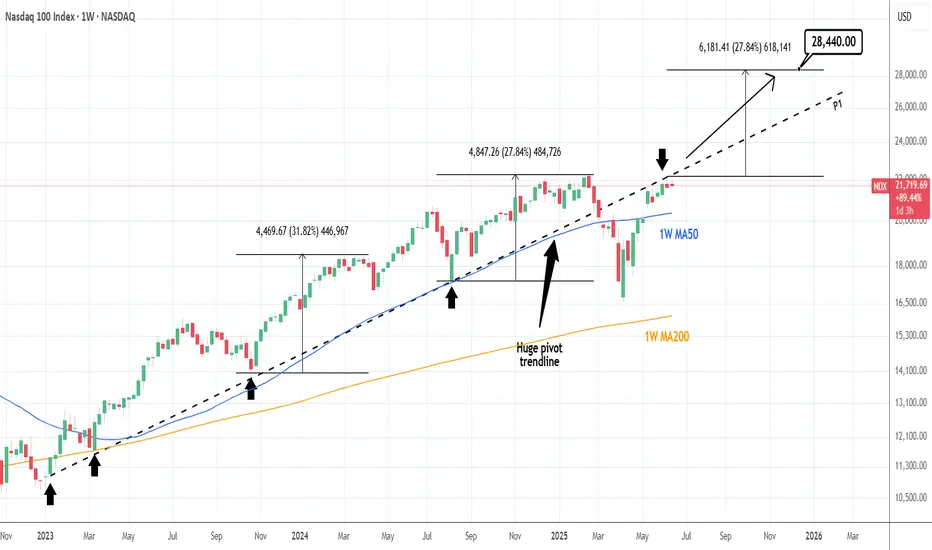
NASDAQ: Huge pivot can catapult it if broken.Nasdaq has turned neutral again on its 1D technical outlook (RSI = 54.712, MACD = 377..560, ADX = 20.644) as it has been struggling to cross above a hidden trendline, the Pivot P1 that was at the start of this Bull Cycle a support and after the trade war acts now as a resistance. If broken, we anticipate a +27.84% rise at least (TP = 28,440), which may very well be an end of year target.
## If you like our free content follow our profile to get more daily ideas. ##
## Comments and likes are greatly appreciated. ##
NASDAQ - UniverseMetta - Signal#NASDAQ - UniverseMetta - Signal
D1 - Formation of a narrowing diagonal + price broke through the lower trend line through a 3-wave structure. It is better not to increase risks. Stop behind the maximum of the 1st wave.
Entry: 21509.0
TP: 20986.3 - 20372.2 - 19784.5 - 18396.7
Stop: 22160.6

NASDAQ 2 Expected Scenarios Very Clear , Which One You Prefer ?Here is my opinion on Nasdaq on 4H T.F , The price still below my res so we can sell it if the price touch the res level again , and if we have a daily closure above my res then we can buy it with retest for the broken res , so it`s very easy if we still below the res we can sell and if we going up it we can buy it . but we need a daily closure above first .

ICT CONCEPTSTrading foreign currencies can be a challenging and potentially profitable opportunity for investors. However, before deciding to participate in the Forex market, you should carefully consider your investment objectives, level of experience, and risk appetite. Most importantly, do not invest money you cannot afford to lose.
There is considerable exposure to risk in any foreign exchange transaction. Any transaction involving currencies involves risks including, but not limited to, the potential for changing political and/or economic conditions that may substantially affect the price or liquidity of a currency. Investments in foreign exchange speculation may also be susceptible to sharp rises and falls as the relevant market values fluctuate. The leveraged nature of Forex trading means that any market movement will have an equally proportional effect on your deposited funds. This may work against you as well as for you. Not only may investors get back less than they invested, but in the case of higher risk strategies, investors may lose the entirety of their investment. It is for this reason that when speculating in such markets it is advisa

US100 — New ATH Trading SetupThe price recently previous ATH at the 22730 level. Current ATH is marked near 22,800, with a POC at 22,640.
Potential support around 22,500, below POC.
Watch for a bounce or further rise beyond 22,920.
Buyers probably will push right through 23,000 level today on Micros and Minis.

NAS100 4H – Bullish Breakout Continuation BUY SetupUS100 (NAS100) is showing clear bullish strength after reclaiming 22,500.0, now trading around 22,718.0. The structure remains bullish, with higher highs and higher lows forming cleanly.
Buyers are still in control — looking for continuation to the upside.
---
BUY Trade Plan:
🔵 Buy Limit: 22,650.0 – 22,680.0
🛑 Stop Loss: 22,600.0
🎯 Take Profit 1: 22,800.0
🎯 Take Profit 2: 22,950.0
---
Why Buy?
✅ Strong bullish market structure.
✅ Recent pullback held above previous support levels.
✅ Momentum favoring upside continuation after minor retracement.
Smart Money likely to drive price higher after liquidity grab around 22,650 zone.
---
Summary:
Bias: BUY ONLY 🔥
Setup: Wait for price to pull back into 22,650 – 22,680, enter long on confirmation.
Risk Management: Respect SL and TP levels — no emotions.
---
💬 Are you buying NAS100 too? Drop your thoughts below!
#NAS100 #US100 #Indices #TradingView #SmartMoney #BuySetup #FrankFx14

NAS100 SHORTElite Strategy.
Price at structured liquidity.
Targeting lower liquidity pools, lower structured liquidity zone.
Executed off the 10 minute time frame.

#NDQ - Monthly Targets: 23721.73 or 21387.86?Date: 03-07-2025
#NDQ - Current Price: 22641.89
Pivot Point: 22554.80 Support: 22276.15 Resistance: 22835.11
Upside Targets:
Target 1: 23028.36
Target 2: 23221.62
Target 3: 23471.67
Target 4: 23721.73
Downside Targets:
Target 1: 22082.06
Target 2: 21887.98
Target 3: 21637.92
Target 4: 21387.86

#NDQ - Weekly Targets 23197.39 or 21886.08 ?Date: 03-07-2025
#NDQ - Current Price: 22641.89
Pivot Point: 22541.74 Support: 22335.83 Resistance: 22748.58
#NDQ Upside Targets:
Target 1: 22832.49
Target 2: 22916.40
Target 3: 23056.89
Target 4: 23197.39
#NDQ Downside Targets:
Target 1: 22251.45
Target 2: 22167.08
Target 3: 22026.58
Target 4: 21886.08

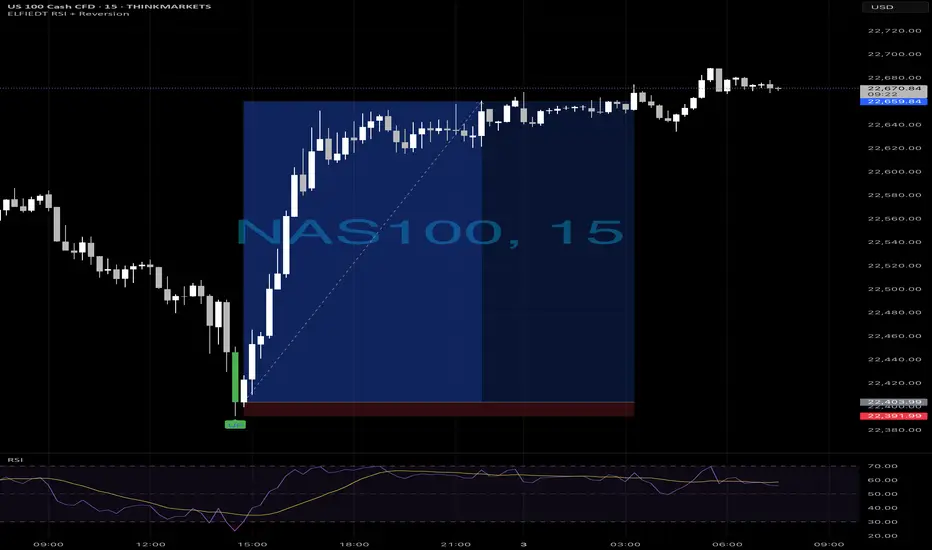
Ustec - longs📈 NAS100 Long Reversal — Powered by ELFIEDT RSI + Reversion Indicator
Timeframe: 15-min
Instrument: NAS100 (US Tech 100)
⸻
✅ Signal Setup (Long Entry)
This clean reversal was captured using my custom ELFIEDT RSI + Reversion indicator, which detects:
• RSI-based exhaustion conditions
• Precise reversal signals (green “UP” label on the chart)
• Trend-aligned confirmations
⸻
📌 Entry Criteria:
1. Oversold RSI conditions signaled potential exhaustion of the downtrend.
2. A clear bullish reversal candle closed with confirmation from the indicator.
3. The “UP” label marked the ideal entry candle just before the impulsive breakout.
4. RSI momentum shifted positively at the point of signal.
⸻
🎯 Execution Plan:
• Entry: At close of the signal candle with the “UP” label
• Stop-Loss: Placed just below the recent swing low (see red zone on chart)
• Target: Up to previous intraday structure and recovery zone
⸻
💡 Key Observations:
• Early signal allowed high RR entry before breakout
• RSI structure confirmed direction shift
• Strong sustained price action into close
⸻
📚 Learn More:
This trade is part of a larger system combining:
• RSI signal dynamics
• Momentum shift detection
• Session and structure alignment
If you’d like more information about the indicator or how to use it in your own strategy, feel free to follow or reach out.
#NAS100 Buy 22499.8#NAS100 Buy 22499.8
SL 21899.8
TP 22699.8
TP 23499.8
TP 24899.8
Trade at your own risk
Protect your capital
The Wizard 🧙♂️ SWFX

ICTTrading foreign currencies can be a challenging and potentially profitable opportunity for investors. However, before deciding to participate in the Forex market, you should carefully consider your investment objectives, level of experience, and risk appetite. Most importantly, do not invest money you cannot afford to lose.
There is considerable exposure to risk in any foreign exchange transaction. Any transaction involving currencies involves risks including, but not limited to, the potential for changing political and/or economic conditions that may substantially affect the price or liquidity of a currency. Investments in foreign exchange speculation may also be susceptible to sharp rises and falls as the relevant market values fluctuate. The leveraged nature of Forex trading means that any market movement will have an equally proportional effect on your deposited funds. This may work against you as well as for you. Not only may investors get back less than they invested, but in the case of higher risk strategies, investors may lose the entirety of their investment. It is for this reason that when speculating in such markets it is advisa

USTEC 15M Trade Setup Analysis (TCB Strategy)📊 USTEC 15M Trade Setup Analysis (TCB Strategy)
Trade Type: Countertrend Breakout -> Continuation
Symbol: USTEC (NASDAQ 100 Index)
Timeframe: 15-Minute
Entry Zone: Around 22,500
Resistance Zone: 22,587.90
Target: 22,865.84
Stop Loss: 22,458.87
Risk–Reward: 1:3 (approx)
Structure: Falling wedge breakout into bullish channel
Setup Confidence Score: 95%
📝 Analyst Notes
Price is breaking out from a well-defined falling wedge within a rising channel. Entry around 22,500 is based on breakout momentum, with SL tucked under structure. A retest entry would offer added confluence. Resistance at 22,587.90 is critical—a break and hold above confirms bullish strength toward the 22,865 target.
🎯 Execution Plan
Option 1: Aggressive entry near 22,500–22,540 (early breakout)
Option 2: Wait for clean retest of wedge breakout or 22,500 zone
Target: 22,865 (upper channel boundary)
SL: 22,458 or below the recent structure low
R:R: ~1:3 — very favorable
🟢 Verdict
This is a high-quality TCB setup, especially if we get a retest confirmation. The bounce off channel support + wedge breakout = excellent confluence.

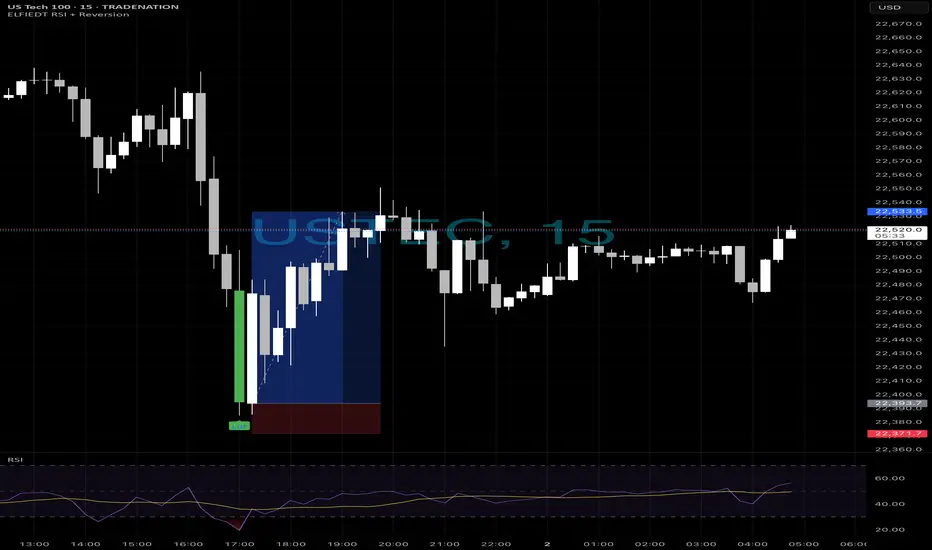
Usrec longs after drop📈 US Tech 100 | 15-Min Chart
✅ Live Trade Example using ELFIEDT RSI + Reversion
⸻
This setup was captured using the ELFIEDT RSI + Reversion indicator. A clean BUY signal was triggered after an extended move, followed by a sharp reversal — perfectly timed and visually confirmed by the indicator’s built-in logic.
💡 The result? A precise entry with a strong follow-through.
This tool is built to spot high-probability reversals with confluence — across timeframes, instruments, and volatility conditions.
⸻
👥 Want to trade with structure and clarity?
Join our community of traders who use this system daily to simplify their decisions and sharpen their edge.
📩 Comment “🔥” or send a DM to learn more.
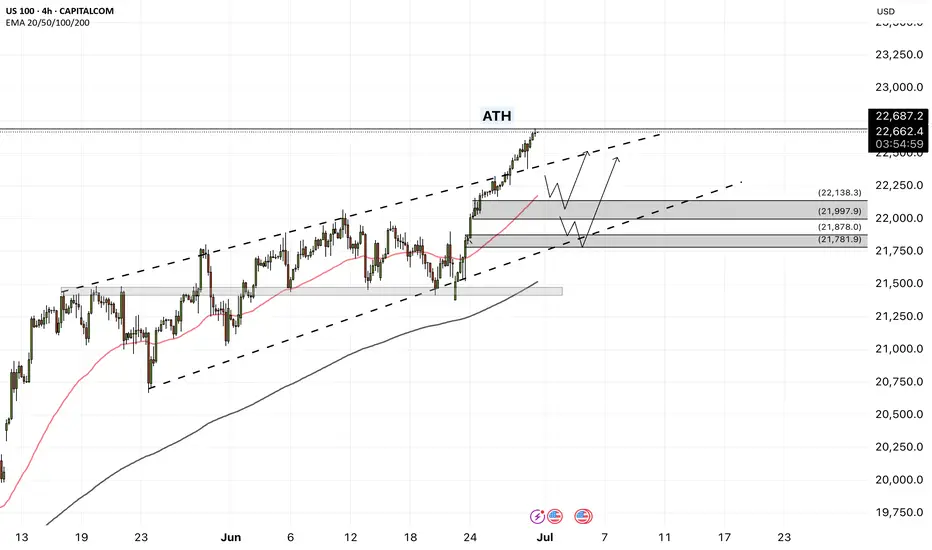
NAS100 - The stock market is breaking the ceiling!The index is above the EMA200 and EMA50 on the four-hour timeframe and is trading in its medium-term channels. If it does not increase and corrects towards different zone, it is possible to buy the index near the reward.
Following a strong rally in U.S.equities, the S&P 500 and Nasdaq indices both achieved new all-time highs on Friday. It marks the first time since February that the S&P 500 has surpassed its previous peak, while the Nasdaq entered fresh price territory for the first time since December.
Despite ongoing market focus on economic data and the Federal Reserve’s interest rate policy path, the simultaneous surge in both indices reflects a renewed appetite for risk in the stock market—an appetite that has been accelerating since mid-April, especially in tech stocks.
In contrast, the Russell 2000 index, which tracks small-cap U.S. companies, still remains significantly below its prior high. To return to its October levels, it would need to rise over 13.5%. However, Friday’s 1.7% gain suggests capital is beginning to flow more broadly into underrepresented sectors.
Analysts argue that a strong breakout in the Russell 2000 could signal a broader rotation toward increased risk-taking—possibly driven by optimism over future rate cuts, easing inflation, and improved business conditions in the second half of the year.
Now that the S&P 500 has reached new highs and the Nasdaq has joined in, attention turns to the Russell 2000. If it begins to accelerate upward, markets could enter a new phase of sustained bullish momentum.
Following a week focused on gauging U.S. consumer spending strength, the upcoming holiday-shortened week (due to Independence Day) will shift attention to key employment and economic activity data.
On Tuesday, markets await the ISM Manufacturing PMI and the JOLTS job openings report. Wednesday will spotlight the ADP private employment report, and Thursday—one day earlier than usual due to the holiday—will see the release of several crucial figures, including the Non-Farm Payrolls (NFP), weekly jobless claims, and the ISM Services Index.
Currently, investor reaction to Donald Trump’s tariff commentary has been minimal. Market participants largely believe that any new tariffs would have limited inflationary effects and that significant retaliation from trade partners is unlikely.
Friday’s PCE report painted a complex picture of the U.S. economy. On one hand, inflation remains above ideal levels; on the other, household spending is showing signs of fatigue—a combination that presents challenges for policymakers.
Inflation-adjusted personal consumption fell by 0.3%, marking the first decline since the start of the year and indicating a gradual erosion of domestic demand. While wages continue to rise, their impact has been offset by declining overall income and reduced government support. To maintain their lifestyle, households have dipped into their savings, driving the personal savings rate down to 4.5%—its lowest level this year.
On the inflation front, the core PCE price index—the Fed’s preferred inflation gauge—rose 2.7% year-over-year, slightly above expectations. Monthly inflation also increased by 0.2%. Although these figures appear somewhat restrained, they remain above the Fed’s 2% target, with persistent price pressures in services—particularly non-housing services—still evident.
Altogether, the data suggest the U.S. economy faces a troubling divergence: weakening household income and consumption could slow growth, while sticky inflation in the services sector—especially under a potential Trump tariff scenario—could limit the Federal Reserve’s ability to cut interest rates.
NAS100!Nasdaq is clearly in either the start or the end of a consolidation
The trend is still up.
Trade with care use a stop loss

Comprehensive Market Analysis: NAS100 Comprehensive Market Analysis: NAS100
1. Monthly Timeframe (The Long-Term "Big Picture")
Observation: The chart displays an incredibly powerful and long-standing uptrend. The price is consistently making higher highs and higher lows.
Candlestick Analysis: The most recent candles are strong, long-bodied bullish (green) candles. There are no significant bearish reversal patterns present whatsoever. This is a picture of strength.
Ichimoku Analysis: The price is trading far above the Kumo (Cloud), which is wide and bullish (green). The Tenkan-sen is far above the Kijun-sen, and the Chikou Span is in open space high above the price action from 26 periods ago. This is a textbook example of a very strong, healthy bull market.
Conclusion (Monthly): The long-term outlook is unequivocally Bullish.
2. Weekly Timeframe (The Dominant Trend)
Observation: The strength seen on the monthly chart is confirmed here. The trend is clearly defined and moving from the lower-left to the upper-right.
Heikin Ashi Interpretation: If we were to view this with Heikin Ashi, this chart would show a long sequence of green candles, with most of them having no lower wicks, which, according to your lesson, signifies a very strong and healthy uptrend.
Ichimoku Analysis: All five Ichimoku components are in perfect bullish alignment. The price is above the Tenkan-sen, which is above the Kijun-sen, and all are far above the Kumo. This confirms the trend is not only bullish but also has strong momentum.
Conclusion (Weekly): The dominant trend is Strongly Bullish.
3. Daily Timeframe (The Trading Trend)
Observation: The chart shows a clear uptrend. The most recent price action shows a slight pullback or pause after making a new high.
Candlestick Analysis: The last few candles are smaller and show some indecision (like Spinning Tops), which is very common after a strong upward move. This is more likely a "breather" or consolidation rather than a reversal. There are no major bearish reversal patterns like a Bearish Engulfing or Evening Star.
Ichimoku Analysis: The price is pulling back towards the Tenkan-sen, which is the first line of dynamic support. As long as the price holds above the Kijun-sen, the bullish trend is considered fully intact.
Conclusion (Daily): The trend is Bullish, currently in a minor pullback. The overall structure remains strong.
4. 4-Hour and 1-Hour Timeframes (The Intraday Trend)
Observation: These charts give a clearer view of the minor pullback seen on the daily chart. Here, the price action is moving sideways to slightly down.
Candlestick Analysis: We can see a few Long Upper Shadow candles near the recent top, which confirms the lesson that sellers stepped in to cause this short-term pause. However, there is no strong follow-through yet from the bears.
Ichimoku Analysis: On the 4H chart, the price is testing the Kijun-sen as support. This is a critical level. If it holds, the uptrend is likely to resume. If it breaks below, the correction could deepen, with the Kumo cloud being the next major support zone.
Conclusion (4H & 1H): The short-term momentum is corrective/sideways within a larger bullish trend.
5. Lower Timeframes (30M, 15M, 5M)
Observation: These charts show the corrective price action most clearly, appearing as a short-term downtrend.
Context is Key: Based on the overwhelming strength of the Monthly, Weekly, and Daily charts, this downtrend on the lower timeframes must be interpreted as counter-trend noise. It is a pullback, not a reversal of the major trend.
Harmonic Potential: This pullback could be forming the BC leg of a bullish ABCD pattern, or the AB leg of a bullish Gartley or Bat pattern, where traders would look for a buying opportunity at a key Fibonacci retracement level below.
Overall Synthesis and Final Conclusion
By performing a correct, top-down analysis of the NAS100 charts, the conclusion is the complete opposite of my previous mistaken analysis.
Long-Term (Monthly/Weekly): The market is in a powerful, secular bull market.
Medium-Term (Daily): The primary trend is up, but the market is taking a healthy and expected pause or pullback.
Short-Term (Intraday): The market is currently in a corrective phase.
Final Outlook: The multi-timeframe analysis is in strong alignment. The overwhelming evidence suggests that the primary trend for NAS100 is strongly Bullish. The current downward price action on the lower timeframes is very likely a temporary correction. Traders who align with the dominant trend would view this dip as a potential buying opportunity as the price approaches key support levels (like the Kijun-sen on the 4H/Daily chart), anticipating a resumption of the main uptrend.
For those interested in further developing their trading skills based on these types of analyses, consider exploring the mentoring program offered by Shunya Trade.
I welcome your feedback on this analysis, as it will inform and enhance my future work.
Regards,
Shunya Trade
⚠️ Disclaimer: This post is educational content and does not constitute investment advice, financial advice, or trading recommendations. The views expressed here are based on technical analysis and are shared solely for informational purposes. The stock market is subject to risks, including capital loss, and readers should exercise due diligence before investing. We do not take responsibility for decisions made based on this content. Consult a certified financial advisor for personalized guidance.
