Geometry: Shapes, Planes, and FiguresIn geometry, two such known forms are the circle and the square; however, a circle is merely a type of ellipse, so there are ellipses and squares.
Squares can be incremented and decremented, and their essential units can be found. Ellipses eccentricity can be added or removed thus creating variating arcs.
"Make It Mine" on this chart; deconstruct it; study it; study how it was formed; study the extensions that can be built on top of the base form. Even study beyond this, for this is not the end, only the beginning.
Original Chart: 13 mins
Scaling = .0001
(Had to change the duration to be able to post)
In-exhaustive book list
Law of Vibration - Tony Plummer
Michael Jenkins - Geometry of Stock Market Profits, Chart Reading for Professional Traders, Complete Stock Market Forecasting Course
Scott M. Carney - The Harmonic Trader, Harmonic Trading Volume I, Harmonic Trading Volume II, Harmonic Trading Volume III
H.M. Gartley - Profits in the Stock Market
Bill Wiliams - Trading Chaos, New Trading Dimensions, Trading Chaos 2nd Edition
J.M. Hurst - The Profit Magic of Stock Transaction Timing, Cyclic Analysis: A Dynamic Approach
Disclaimer: Not financial advice, no recommendations to buy or sell, no warranties of merchantability, profitability, or probabilities.
Australian Dollar Futures
No trades
Market insights

Geometry: Chart ExhibitFirst and forever reminder: expand into your own, continually evolve and grow.
Press share "Make it Mine" to view the full interactive chart
Note: Relationship of numbers to each other
Note: The sequence of the various shapes
Note: Geometric Angles
Note: "45" angles up and down various intersection points
In-exhaustive book list
Law of Vibration - Tony Plummer
Michael Jenkins - Geometry of Stock Market Profits, Chart Reading for Professional Traders, Complete Stock Market Forecasting Course
Scott M. Carney - The Harmonic Trader, Harmonic Trading Volume I, Harmonic Trading Volume II, Harmonic Trading Volume III
H.M. Gartley - Profits in the Stock Market
Bill Wiliams - Trading Chaos, New Trading Dimensions, Trading Chaos 2nd Edition
J.M. Hurst - The Profit Magic of Stock Transaction Timing, Cyclic Analysis: A Dynamic Approach
Disclaimer: Not financial advice, no recommendations to buy or sell, no warranties of merchantability, profitability, or probabilities.
Forum:
blackcryptolink.com

Geometry: Chart ExhibitFirst and forever reminder: expand into your own, continually evolve and grow.
Note: Adjusted axis, and regular horizontal and vertical axis
Note: Arcs
Note: Geometric Angles
In-exhaustive book list
Law of Vibration - Tony Plummer
Michael Jenkins - Geometry of Stock Market Profits, Chart Reading for Professional Traders, Complete Stock Market Forecasting Course
Scott M. Carney - The Harmonic Trader, Harmonic Trading Volume I, Harmonic Trading Volume II, Harmonic Trading Volume III
H.M. Gartley - Profits in the Stock Market
Bill Wiliams - Trading Chaos, New Trading Dimensions, Trading Chaos 2nd Edition
J.M. Hurst - The Profit Magic of Stock Transaction Timing, Cyclic Analysis: A Dynamic Approach
Disclaimer: Not financial advice, no recommendations to buy or sell, no warranties of merchantability, profitability, or probabilities.

Maybe up nowExcellent new one ☝️ Ya know you have to be a new one in a while back in mnm and I don’t know how to get you to me and how do I do you do that and

Australian Dollar Monthly Time Frame Bullish BiasOctober 18th 2021
Australian Dollar Monthly Chart Bullish Bias
Looking at Current Market Price Action, on the Monthly Time Frame We can see that the Australian Dollar Futures is painting a bullish recovery over the past 2-3 Weeks.
Finding support at the 0.72000 level we can see that the price action of August and September were unable to set lower lows. Combining that with the fact that in 2020 we set a high we haven't seen since roughly June 2018, at the beginning of this year we were able to see price trying to continue into a higher price target but was unsuccessful , as large levels of liquidity were most likely used to take some profits off the table on the fund level. Using the nearest level of structure created with the low in Nov 2020 and the high in Feb 2021, I was able to find a retracement level that was being respected as well as showed reaction at the 0.786 retracement level and combining that with the whole level of 0.7200 that creates a strong reason for price to reverse.
The other factor we have in our favor is October is the start of the new quarter which opens up the door for a potential quarterly shift which we are seeing the first signs of now.
That combined with the clear targets we have of prev highs from 2017 we have a clear path with the underlying bullish trend to the 0.80000 level.

New trading strategy upgrade - AUDUSDLet's wait for a "U" turn. still looking to BUY after a correction on daily chart!

Aud futureEverything will update.....
This strategy follow Volume Profile Analysis and Intermarket (Bond yield spread, Metal, ....). After we have zone for waiting buy or sell. We will enter with OrderFlow which show in NinjaTrader or another Platform......My english soooooo bad

Current Long Micro AUD/USD FuturesIn this publication I show a drawn up trade that is currently open on my account.
I use the principles of price action, where price is in extremes through expansion and contraction.
NO squiggyly lines just pure price action is quite simple and beautiful. To me it is an art form being in touch with the charts ebbs and flows.
Before every trade I practice a discipline called objective discovery where I read bar by bar to feel the buyers and sellers emotions in each bar.
This is my first post, Im thinking of starting a continuous blog where i post live trade ideas and go through the principles of price action and swing trading.

COT and price action supported bull move for next 6-12 monthLast year we witnessed an attack on a low made in 2008 and it was successful, but price was not willing to go lower. Instead it turned around and started to brake structure bullishly.
Are we in a buy programme now?
By comparing chart data with COT data we see that long book is growing exponentially starting from end of june this year.
All this and weakness in Dollar index is making a nice stage for other currencies to rally!

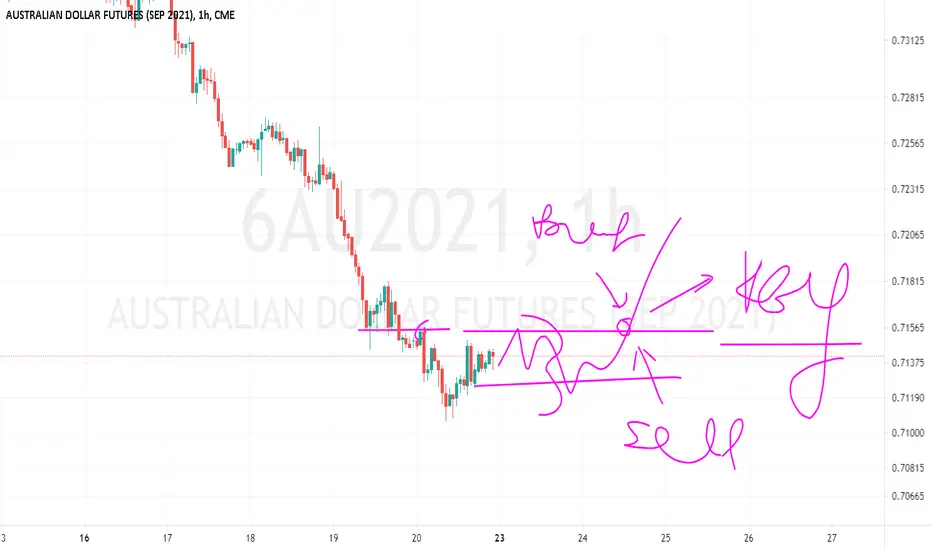
New trading strategy upgrade - AUDAUD is making a big correction on daily chart. Let's see the key level on the my plan I drawn on the chart. We could plan to buy or sell by price over or below the key level. I personally looking to buy ! SET UP your SL at any time, it helps. good luck
New strategy upgrade - AudusdAssuie is still very stong next week, we will see how it break above strong resistance.

New trading Strategy upgrade - AudHi traders, this is my personal trading idea only. Please give an AGREE/ LIKE, my trading strategy is Price Auction - Chart only, I don't use indicators, MA, signals and trend line etc. Your comments are highly welcome. We need a relax and happy trading with happy ending on each trade. My chaos drawing is not to predict and guess the further, it is my plan where we are on the chart and how we shall trade on what we see. Good luck guys.
it will be last drop for Aussies, then build its strong buttom on H1 time frame before going up.


Aussie bearish in JulyAussie dollar looks weak. Bearish price action with target 0.72 in July. Probability H.


AUSTRALIAN DOLLAR FUTURESHi everyone,
As you can see from the graphic the AUSTRALIAN DOLLAR FUTURES is showing a great increasing trend , buy 6C1!

AUD FUTURE 6A1! : Price Action on Daily TMF , GROWN ! 🔔Welcome back Traders, Investors, and Community!
If you LIKE this analysis, Please support our page by hitting the LIKE 👍 button
Feel free to request any pair/instrument analysis or ask any questions in the comment section below.
Good trading at everyone!

AUSTRALIAN DOLLAR FUTURESThis analysis is very accurate and it depends on the long term, so it is better to wait until the corrective pattern becomes clear to us to determine the points of entry and exit accurately, but up to the hour there is a possibility to continue to rise to 0.81095 provided that it breaks the bargain 0.77610


AUSTRALIAN DOLLAR FUTURES The price continues to collapse after its confirmation
Objectives
TP1 : 0.75875
TP2 : 0.75690

AUSTRALIAN DOLLAR FUTURES (CONTINUOUS: CURRENT CONTRACT IN FRONWill be spiking in
AUSTRALIAN DOLLAR FUTURES (CONTINUUS: CURRENT CONTRACT IN FRONT)
6A1! CME, so you should buy in 30 minutes as long as the candles do not break the trend line
