EUR: COT Data Indicates Dollar ResilienceThe EURUSD pair closed the previous week with a bullish weekly candle, positioned within the bounds of a significant two-week-old bearish candle. This pattern suggests a potential pause or consolidation phase after a strong downtrend, but traders should remain cautious as the overall trend still bears the mark of the larger bearish candle.
Recent COT (Commitment of Traders) data provides additional insights into market sentiment. Retail traders have increased their long positions, indicating a more bullish outlook among individual traders. Conversely, both commercial and non-commercial traders are shifting towards bearish positions, signaling a potential underlying strength in the US dollar and a cautious stance among large market participants.
Given these dynamics, there is a high probability that the EURUSD may retest the recent daily supply zone, which has already been touched during the week. If the price moves down from this level, it could signal a continuation of the overall bearish trend, especially considering the COT data's favor towards dollar strength.
What are your thoughts on this setup? Do you see a potential reversal, or will the bullish weekly candle lead to further upside?
✅ Please share your thoughts about 6E1! in the comments section below and HIT LIKE if you appreciate my analysis. Don't forget to FOLLOW ME; you will help us a lot with this small contribution.
6EH2024 trade ideas
EURUSD: Potential Bullish liquidity after liqudity grabHello traders here's my point of view about CME_MINI:E71! CMCMARKETS:EURUSD
For the past months we've seen massive bullish momentum. The overall trend remains bullish specially if TVC:DXY continue bearish.
Yesterday, price retested a solid H4 ORDERBLOCK around the 1.6500 area. This was some sort of liquidity collection mouvement.. Price re-integrated the area leaving places for intraday BUY opportunities. As you can se price now is filling those intraday imabalces/FVGS
If we see clearly bearish signs in THE US DOLLAR INDEX DXY
by negative correlation EURUUSD can move up.
All eyes on today's 20 of august 2025 FOMC meeting!. We are traders, we adapt. if things change the idea will be totally invalidated!
Markets might wait for end of the week Jackson Hole Symposium toO.
You may find more details in the chart!
Thank you and Good Luck!
PS: Please support with a like or comment if you find this analysis useful for your trading day.

EURO Building for next move Today's Jackson Hole Conference is going to be explosive i believe in one way or another , with either the doves or hawks getting hold of the markets and this will impact Treasuries, equities and the $ so prepare

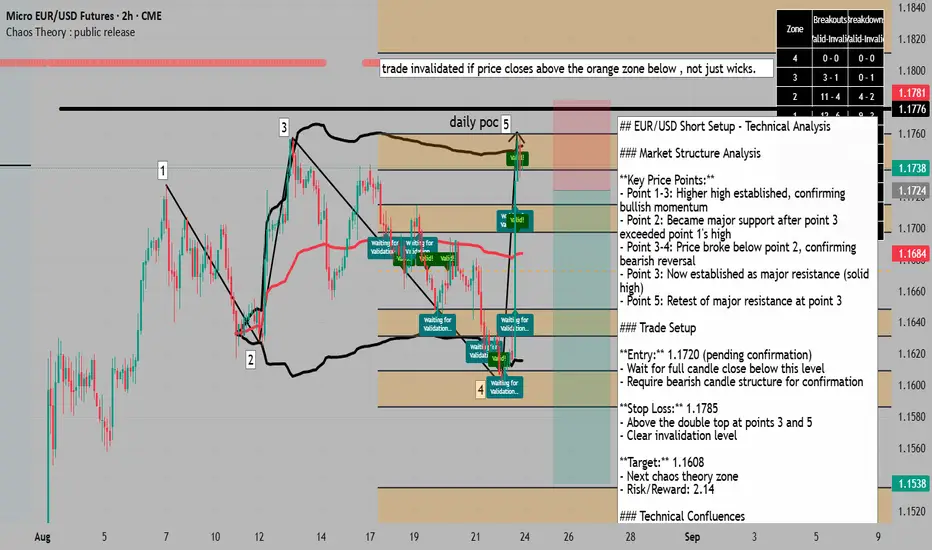
support broken, lower TF potentially joining major =SELL trend## EUR/USD Short Setup - Technical Analysis
### Market Structure Analysis
**Key Price Points:**
- Point 1-3: Higher high established, confirming bullish momentum
- Point 2: Became major support after point 3 exceeded point 1's high
- Point 3-4: Price broke below point 2, confirming bearish reversal
- Point 3: Now established as major resistance (solid high)
- Point 5: Retest of major resistance at point 3
### Trade Setup
**Entry:** 1.1720 (pending confirmation)
- Wait for full candle close below this level
- Require bearish candle structure for confirmation
**Stop Loss:** 1.1785
- Above the double top at points 3 and 5
- Clear invalidation level
**Target:** 1.1608
- Next chaos theory zone
- Risk/Reward: 2.14
### Technical Confluences
1. **Market Structure:** Lower highs and lower lows established on 4H and Daily timeframes
2. **RSI:** Price at second standard deviation (overbought zone)
3. **Elliott Wave:** Potential wave 3 completion, expecting wave 4 decline
4. **Chaos Theory Indicator:** 67% probability of reaching lower zone once triggered (based on 2,400 candle sample)
5. **Dow Theory:** Trend alignment across multiple timeframes
### Risk Management
- Position Size: 2% of account maximum
- Breakeven: Move stop to entry at 1.1700
- Partial Profit: Consider taking 50% at 1.1650
### Entry Criteria
1. Price must close below 1.1720 (full candle body)
2. Increased volume on breakdown preferred
3. No entry on wicks alone
### Current Status
Alert set at 1.1720. Waiting for bearish confirmation before entry.
### Notes
- If price reaches 1.1780-1.1790 first, expect potential liquidity sweep before reversal
- No trade if proper confirmation doesn't occur
- Setup invalidated above 1.1785
**Setup Narrative (educational)**1. **Context Prep:** We tagged the 12 AM bias—watching for a liquidity sweep into London (2–5 AM). Right on cue, the price trapped early movers.
2. **Price Reaction:** That trap sets the stage—when New York opens, price drives the opposite direction.
3. **Sniper Lesson:** Don’t react. Anticipate. Use bias, structure, and frames to position ahead of the move—and let the market run into your trigger.
This is *teaching, not calling*. Learn how to align bias + price structure in real time.

Trap Day Example – 12AM Bias, London Trap & New York Silver BullThis schematic illustrates how price action often sets up around key time windows and liquidity pools, independent of the actual news release.
• 12AM Candle Bias: The 12AM (NY) hourly candle often sets the directional framework for the day. A red candle can sometimes indicate the opposite bias (bullish) as liquidity is engineered around retail positioning.
• London Trap (1AM–5AM): Liquidity is typically built in the early session, where clean-looking structures entice traders to place stops just beyond obvious highs or lows. These stops become fuel later in the session.
• Reset Window (5AM–7AM): Price consolidates and repositions, chopping up retail orders. Patience here is essential.
• 7:38AM Liquidity Sweep: A sharp move often clears out positions, targeting extreme levels such as the 4th standard deviation (~68 pips in this example). This is not random — it’s part of the day’s liquidity cycle.
• 10AM Silver Bullet Zone: A major move frequently coincides with scheduled news events. However, the setup is often already “baked in” to the algorithms well before the announcement, providing a precise time/price confluence for high-probability trades.
Key Takeaway:
Markets are not driven by randomness. Time, liquidity, and structure work together to engineer traps and sweeps before directional moves unfold. By studying these repeatable cycles — from the London trap to the New York Silver Bullet — traders can better understand how the market truly operates.

Euro Bearish PredictionEuro Bearish Prediction.
Reversal point on multiple high volume nodes paired with previous month naked POC.
weekly and daily VA extensions.

EURUSDEURUSD Weekly/Upcoming Monthly Closure Out Look.
With the current signs of dollar weakness on the macro outlook I believe we can maintain the bullish stance on EU.
Trade Smart Trade Safe.

Morning Market Brief 15.08.2025TF - W
Today is packed with high-impact news, and both France and Italy are observing bank holidays. Ideally, I’d like to see the market provide a clear signal during the session that could indicate the direction for next week’s movement.
TF - D
Yesterday’s bearish close introduced a new variable in the form of a Rejection Block at 1.17305. This block may serve both as a potential area of interest for sellers and as an initial signal that selling at these price levels is favorable for them. Selling pressure continues.
TF - h4
H4 shows quite a lot of changes during the Asian session.
1) An intraday target has appeared in the form of a fractal low inside the buyers’ area of interest at 1.16545.
2) The price is moving in a compressed manner, without impulses, towards a bearish imbalance, which could send the price into the newly formed fractal at 1.16545 — a scenario I described yesterday evening.
3) Considering the formation of the daily Rejection Block, inside it there is an inducement in the form of an H4 fractal (1.17395). In the event of an upward impulse, it could serve both as a profit-taking target and as potential liquidity sufficient to send the price lower, forming a new trading range.
TF - h1
The 1H movement is highly compressed, with the price climbing slowly in small candles. The appearance of sellers during the test of the H4 imbalance could send this drawn-out move down to retest the local low.

Daily Market Recap 14.08.2025TF - MN
The price remains around the monthly fractal, with an untested monthly imbalance lying below. No new data has emerged yet.
TF - W
Over the past week, the price tested the 0.5% level of the weekly dealing range. If the current price holds within last week’s range, we will form a weekly fractal in discount territory. It is also worth noting that the trendline liquidity, marked by the red arc, is entirely positioned in discount territory, which may indicate low resistance in that area. The potential formation of a weekly fractal low could provide a downside target for shorts, as well as a level that could serve as a potential entry for long trades.
TF - D
On the daily chart, the market currently appears neutral. After breaking out of the previous range with a sharp drop, a new dealing range was formed. During the test of the weekly range’s discount levels, the price began forming bullish imbalances, then moved in a strong daily order flow, setting new highs after testing daily bullish imbalances. Over the last few days, however, no new bullish imbalances have formed, suggesting that bullish momentum is fading.
It’s important to note that we are currently in the middle of a daily bearish imbalance, and today we saw a strong reaction upon testing its upper boundary.
Considering these factors, my bias is short towards the potential weekly fractal low, provided the daily candle closes below 1.16425. Such a move would indicate to me that the market has found a seller within this trading range who is ready to sell.
TF - h4
Looking at the H4 chart, the picture is slightly different. Despite a deep correction, we remain within the current trading range. There is an area of interest in the form of an imbalance that held the price today. However, there is also an opposing imbalance above, which may limit further upside movement.
Theoretically, within the day we could see a test of the upper imbalance, followed by a move down towards the recent local lows, which are located inside a bullish imbalance.
Another possible scenario is consolidation during the Asian session, the formation of a 1H fractal, and, upon a reaction to it, the price could start an upward move either towards the H4 imbalance above or to today’s high, which tomorrow will act as the PDH (Previous Day’s High).

6E : Long levelThe level has been activated, so you can buy it. It is best to scalp or pip it; I cannot promise any significant movement. Be careful when trading on news or at market close/open.

6E : Long levelThe level has been activated, so you can buy it. It is best to scalp or pips it, but you can use it according to your own trading strategy. I cannot promise any significant movement. Be careful when trading on news or at market close/open.

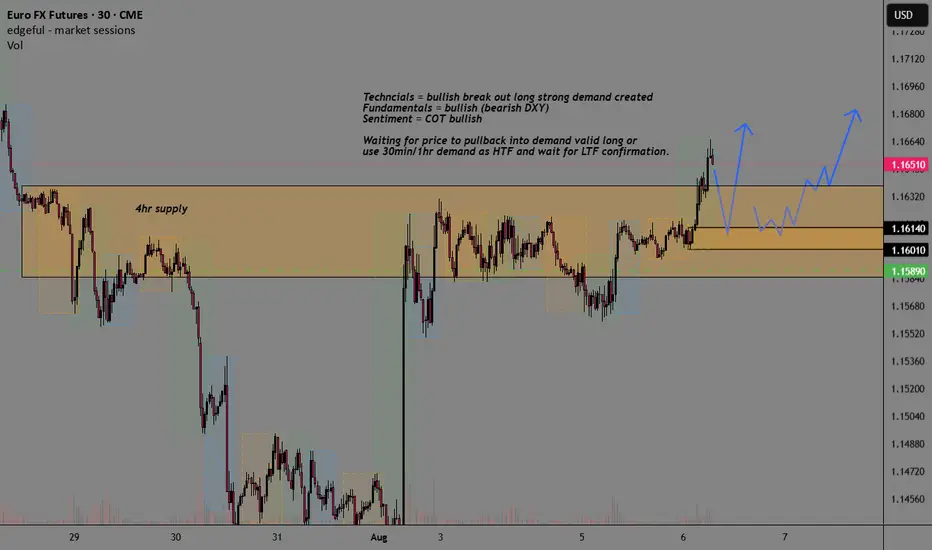
EUR EURUSD Supply-Demand Breakout Buy SetupSee chart for top-down analysis.
Looking at long if price pulls back into break-out level of demand with strong fundamentals, technicals, and sentiment COT reports.
6E : Long levelThe level has been activated, so you can buy it. I have slightly edited it since last time. It is best to scalp or pip it; I cannot promise any significant movement. Be careful when trading on news or at market close/open.

I think this strong rebound was a pullback I think this strong rebound was a pullback and the target is much lower.
Tactical Short Setup on EURThe September 2025 Euro FX futures contract (E6U25) is currently trading around 1.1440 after topping out near 1.19 the 1st of July. This decline reflects a broader market repricing, driven by evolving expectations around monetary policy from the Federal Reserve and the European Central Bank, softening Eurozone growth prospects, and a technical backdrop that has turned decisively bearish. Coupled with shifts in sentiment and options market positioning, the current setup presents an opportunity to initiate a tactical short with an attractive risk-reward profile.
Fundamental Analysis – Central banks and diverging momentums
Monetary policies on either side of the Atlantic appear to diverge. The Federal Reserve has kept its federal funds rate steady in the 4.25%–4.50% range since December 2024, resisting political pressure to ease. In contrast, the European Central Bank has gradually lowered its deposit rate from 4% to 2.00% since mid-2024 and maintained that level in July, considering inflation is now back to its 2% target. This has widened the yield differential in favor of the U.S. dollar.
Forward guidance from both central banks suggests a cautious stance. The Fed’s June 2025 dot plot anticipates a modest rate cut by year-end, though FOMC members remain divided. Meanwhile, the ECB projects subdued inflation and modest growth, implying no urgency for further easing.
On the macro front, U.S. GDP rebounded sharply in Q2 (+3.0% annualized), though driven largely by a collapse in imports. Domestic demand and job creation have slowed, and tariffs may push core inflation above 3% again. In the eurozone, Q2 GDP barely expanded (+0.1%), with uneven performance across member states. Inflation is stable at 2%, with core pressures easing. Altogether, the dollar retains a slight edge amid firmer data and a more hawkish Fed.
Technical Outlook – Bearish shift with volume confirmation
From a technical standpoint, the E6U25 contract has clearly broken down from its prior range. The area around 1.1775, which previously served as a high-volume node and resistance, was breached with strong downside momentum. The price action has since carved out a clean pattern of lower highs and lower lows, and volume has notably increased on bearish sessions, confirming the shift in control.
The current structure suggests a vacuum between 1.1775 and 1.1500, with only minor resistance expected around 1.1545, where some residual volume lies. There is little to no support before the 1.1280–1.1300 area, which aligns with a lower volume shelf on the visible range volume profile (VRVP). If price retraces to retest the 1.1525–1.1575 zone, that area is likely to act as a tactical selling opportunity before potentially resuming the downtrend.
Sentiment Analysis
CFTC data as of late July shows asset managers holding a substantial long position in EUR/USD, though these are beginning to unwind. The positioning profile leaves the euro vulnerable to further long liquidation if the selloff deepens.
Retail sentiment reinforces this view, as most retail traders are caught on the wrong side of the move. Open interest is stable but elevated, and trading activity has begun to rise slightly, hinting at retail dip-buying that may lack conviction. No major retail capitulation has occurred yet.
Broad market volatility remains subdued, and EUR/USD-specific indicators show a similar picture. The CME CVOL Index for EUR/USD remains around 8, a level considered moderately low by historical standards, reflecting a calm, non-disruptive market environment that favors technical trading, including respect for resistance levels and trend-following strategies.
Options Analysis
According to the CME FX Options Vol Converter, the landscape for EUR/USD still exhibits a modest downside bias. Risk reversals across one to three months tenors remain slightly negative, reflecting moderate demand for euro puts.
In listed markets, CME data for August expiries shows notable open interest concentration in puts at the 1.1450 and 1.1500 strikes, with deltas indicating directional positioning rather than purely hedging activity. On the call side, interest is more dispersed but visible above 1.1650, particularly at 1.1700 and 1.1750, suggesting some appetite for upside. However, the deltas are lower.
Trade Idea
A tactical short trade is favored in the 1.1525–1.1575 zone, which coincides with a potential pullback level within a well-established downtrend. This level also aligns with a minor volume shelf, providing a natural resistance area where sellers are likely to re-enter the market.
The suggested stop level is 1.1650, just above the recent short-term swing highs, which would invalidate the current bearish structure. The target lies around 1.1290, near the next major support zone and volume cluster.
Final thoughts
The EUR/USD rally in May/June was primarily fueled by expectations of synchronized easing and softer U.S. data. However, the Fed’s reluctance to commit to a cut, combined with a relatively more aggressive ECB stance, has shifted the narrative back in favor of the dollar. With asset managers showing signs of willingness to further unwind their exposure, combined with sentiment indicators pointing to complacency, a deeper retracement remains plausible.
The technical breakdown, lack of implied vol support for a rebound, and fresh open interest on euro puts collectively argue for tactical downside continuation. The proposed trade seeks to capture that move with a controlled stop and a realistic price target. Unless EUR/USD can reclaim the 1.1650–1.1700 zone decisively, the path of least resistance remains downward.
---
When charting futures, the data provided could be delayed. Traders working with the ticker symbols discussed in this idea may prefer to use CME Group real-time data plan on TradingView: tradingview.com/cme/ .
This consideration is particularly important for shorter-term traders, whereas it may be less critical for those focused on longer-term trading strategies.
General Disclaimer:
The trade ideas presented herein are solely for illustrative purposes forming a part of a case study intended to demonstrate key principles in risk management within the context of the specific market scenarios discussed. These ideas are not to be interpreted as investment recommendations or financial advice. They do not endorse or promote any specific trading strategies, financial products, or services. The information provided is based on data believed to be reliable; however, its accuracy or completeness cannot be guaranteed. Trading in financial markets involves risks, including the potential loss of principal. Each individual should conduct their own research and consult with professional financial advisors before making any investment decisions. The author or publisher of this content bears no responsibility for any actions taken based on the information provided or for any resultant financial or other losses.

EUR/USD Futures – Key Decision ZonePrice is consolidating between 1.1430 and 1.1485, forming a range near previous value areas.
A breakout is likely imminent. Watching for:
📈 Bullish scenario: Break and retest of 1.1490 → targeting 1.1570 supply zone.
📉 Bearish scenario: Sweep of 1.1430 lows with strong volume → targeting 1.1370 demand.
Volume is decreasing, RSI under 40, and we’re sitting at the mid of a low-volume node → stay patient and reactive, not predictive
EURUSDEURUSD - Still has potential either now or in the future to go up to 1.3726.
Off futures has potential to go below 0.95 based on analysis only.
Confluence:
Futures Analysis - Can go both ways based on todays price action.
Forex Analysis: Still in a downtrend based on the longer term perspective, down->consolidation->up...

Implied volatility, one more tool in our arsenalWHAT IS IMPLIED VOLATILITY?
Implied volatility (IV) refers to the market’s expectations of future volatility for a given asset, derived from option prices. Unlike historical volatility, which measures past price fluctuations, IV is forward-looking and reflects what traders believe will happen in the near future, typically over a 1 to 3 month horizon. IV is not directly observable; it is inferred from option prices using models like Black-Scholes. When option premiums rise even though the underlying asset remains flat, this often signals a rise in implied volatility: investors are preparing for more pronounced future price moves.
IMPLIED VOLATILITY IN FX
In FX markets, as in equities or commodities, implied volatility serves as a risk gauge and a proxy for uncertainty. It plays a critical role in portfolio management, hedging, and strategy timing.
High implied volatility on a currency pair indicates market expectations for increased future movement. This can stem from upcoming economic data, central bank decisions, geopolitical risk, or broader market instability. For example, rising IV on EUR/USD ahead of a major Fed or ECB meeting may signal increased demand for options as market participants hedge against potential surprises. Conversely, sustained low IV often reflects calm market conditions or, at times, a strong directional trend.
Implied volatility can act as a market condition filter for trading strategies. To simplify, we can, for example, divide the CVOL level into four distinct categories.
Abnormally low IV (well below average): Reflects extreme complacency or post-event calm.
Moderately low IV (below average): Indicates orderly, technical markets.
Moderately high IV (above average): Suggests elevated uncertainty.
Abnormally high IV (well above average): Signals market stress or panic.
In spot FX, where retail traders rarely engage in options directly, implied volatility serves best as a macro signal, helping inform position sizing, stop placement, or overall risk exposure based on the current volatility regime.
One advanced use of IV is to compare it against realized (historical) volatility. When implied volatility is much higher than realized volatility, it often means options are expensive, and vice versa. This comparison proves especially valuable in FX markets, as it helps traders identify situations where risk premia may be overpriced, revealing potential misalignments between implied and realized volatility. It also offers a forward-looking perspective by highlighting upcoming catalysts that are not yet fully priced into the spot market.
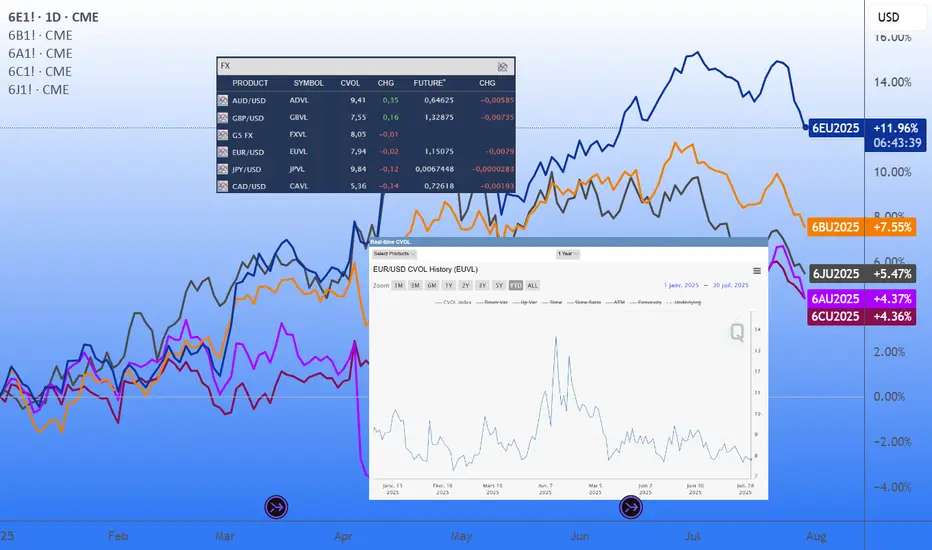
INTRODUCING THE CME CVOL INDEX
To make volatility data more accessible and comparable across asset classes, CME Group introduced the CVOL index family in 2023, a set of standardized implied volatility indexes derived from listed futures options.
How CVOL is calculated?
CVOL indexes are built using vanilla options on futures. They estimate 30-day forward implied volatility, using a basket of out-of-the-money options across various strikes and near-term expirations. The methodology is comparable to that of the VIX in equities, but adapted for the structure of futures markets. Each CVOL index is expressed as an annualized percentage, which can be interpreted as the expected one-standard-deviation move over the next 30 days.
CVOL indexes in FX
Several major currency pairs now have their own dedicated CVOL indexes, offering a real-time measure of implied volatility based on options pricing from CME Group futures contracts. Each index reflects the market’s expectations of future volatility for a given pair:
EUVL for EUR/USD (based on 6E futures)
JPVL for USD/JPY (6J futures)
GBPVL for GBP/USD (6B futures)
CAVL for USD/CAD (6C futures)
ADVL for AUD/USD (6A futures)
In addition to individual pair indexes, the G5 CVOL Index provides a broader view by aggregating the implied volatility of the five major currency pairs, offering a high-level snapshot of volatility across the G5 FX complex. This makes it a valuable tool for macro-focused traders monitoring global risk appetite, cross-asset volatility regimes, or portfolio-level currency exposure.
HOW TO USE CVOL IN PRACTICE
Detecting shifts in risk perception
A sudden spike in CVOL, without a move in the underlying, suggests that institutional players are actively hedging. This can act as an early warning signal for market-moving events or shifts in sentiment. Example: before an ECB decision, a jump in EUVL from 7% to 10% annualized while EUR/USD remains flat may suggest that traders are bracing for a policy surprise.
Adjusting position sizing
When CVOL moves beyond predefined thresholds, traders often respond by reducing leverage, widening stop-loss and take-profit levels, and avoiding overly aggressive directional exposure, in contrast with periods where CVOL fluctuates near its historical average and market conditions appear more stable.
Quant strategy filters
CVOL can also act as a regime filter within systematic trading strategies. For example, when implied volatility on EUR/USD, as measured by EUVL, reaches extreme levels, certain algorithms may shift into breakout mode, anticipating strong directional moves in a high-volatility environment. Conversely, when the index shows no abnormal reading, it may reflect a well-balanced market backdrop, offering more orderly conditions where structured strategies such as range trading tend to perform better.
As historical data on CVOL indexes are available, quant traders can easily backtest and validate ideas that incorporate volatility-based signals or regime filters. More experienced participants often go further, combining FX implied volatility with other volatility indicators, such as CVOL indexes on interest rate futures, to build multi-asset strategies and monitor cross-asset shifts in risk appetite with greater precision.
FINAL THOUGHTS
Implied volatility is a powerful lens into market expectations and potential price swings. In FX, although not always directly accessible to retail traders via options, IV data provides essential context for positioning, timing, and risk management.
With the advent of CME’s CVOL indexes, traders now have a standardized and transparent way to track and compare implied volatility across currencies. Whether you are a macro trader, hedge fund manager, or informed retail participant, monitoring CVOL brings a distinct informational edge, especially when used to anticipate shifts in sentiment and volatility regimes.
And perhaps most importantly: IV doesn’t tell you what happened, but what might happen next, making it an invaluable tool for anyone navigating fast-moving global FX markets.
---
When charting futures, the data provided could be delayed. Traders working with the ticker symbols discussed in this idea may prefer to use CME Group real-time data plan on TradingView: tradingview.com/cme/ .
This consideration is particularly important for shorter-term traders, whereas it may be less critical for those focused on longer-term trading strategies.
General Disclaimer:
The trade ideas presented herein are solely for illustrative purposes forming a part of a case study intended to demonstrate key principles in risk management within the context of the specific market scenarios discussed. These ideas are not to be interpreted as investment recommendations or financial advice. They do not endorse or promote any specific trading strategies, financial products, or services. The information provided is based on data believed to be reliable; however, its accuracy or completeness cannot be guaranteed. Trading in financial markets involves risks, including the potential loss of principal. Each individual should conduct their own research and consult with professional financial advisors before making any investment decisions. The author or publisher of this content bears no responsibility for any actions taken based on the information provided or for any resultant financial or other losses.
Euro Futures Idea.From HTF direction to LTF direction, this is my Trade Idea for the week of 28 July - 1 Aug.
Key Things in this trade idea, HTF PDAs, Liquidity of news high and daily swing and MMSM going on.

6E : Short-term longGood level for pips or short-term bounces. Careful on volatile news. It is better not to trade in them.

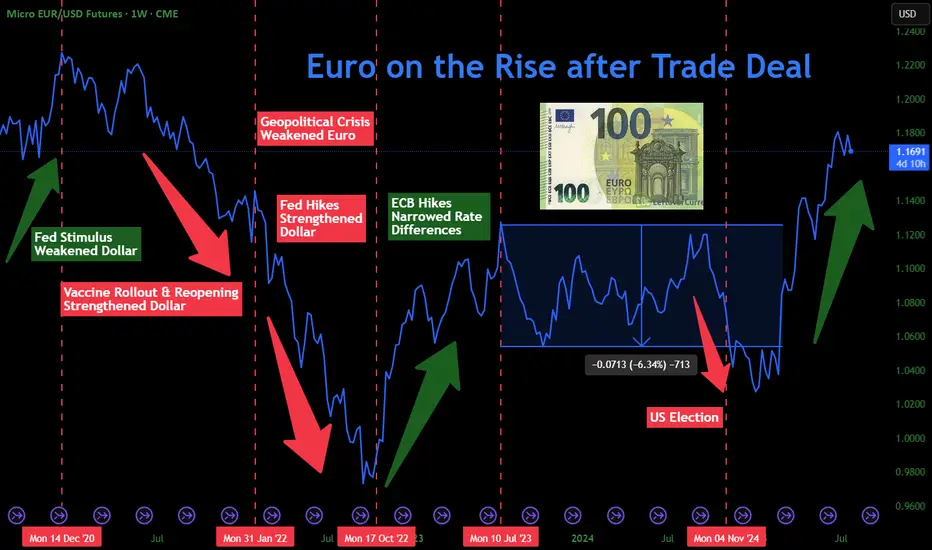
Euro to Rise as Trade Tensions DefusedCME: Micro Euro/USD Futures ( CME_MINI:M6E1! ), #microfutures
On July 27th, U.S. President Donald Trump and European Commission President Ursula von der Leyen announced the U.S. has reached a trade deal with the European Union.
• President Trump said that the deal imposes a 15% tariff on most European goods
• The EU will open its vast market to U.S. products, with 0% tariff
• The EU agreed to purchase $750 billion worth of U.S. energy
• The EU will also invest $600 billion into the U.S. above current levels
Financial market breathes a sigh of relief as the tariff was only half of the 30% rate previously feared. This critical deal marks the de-escalation of US-EU trade tensions. The two trading blocs together represent 30% of global trade and 43% of global GDP. In 2024, bilateral trade reached over €1.68 trillion, according to the EU.
The transatlantic partnership was at its lowest point since WWII. The US was prepared to exit NATO, leaving Europe the monumental challenge to rebuild its military and defense industry. The EU also faces problems in energy supply as well as rising social instability.
In my opinion, the Euro will benefit significantly with the stabilization of US-EU relations.
• Firstly, it allows the 27 EU nations to continue doing business with their biggest customer. The U.S. accounts for 20% of all EU exports in 2024, according to the EU.
• Secondly, due to its approach to energy policy, the EU now imports 55% of its energy needs. Natural gas imports fall by half as Europe reduces its reliance on Russian gas.
• Meanwhile, imports of liquefied natural gas (LNG) have doubled to fill the gap. The U.S. supplies half of LNG imports, according to Eurostat. The trade deal will secure low-cost LNG from the U.S., without tariff.
• Thirdly, while NATO members raise defense budget to 5% of GDP from 2-3%, the money will be spent more wisely by buying U.S. military equipment. Previously, for a worst-case scenario, I estimated a drag of 2% on GDP if EU were to rebuild its military and to directly engage in the Russia-Ukraine conflict. With the U.S. continuing its presence in NATO defense, this could be avoided.
• Fourthly, the Trump administration no longer pursues a strong Dollar. Instead, officials suggest that a weak dollar supports U.S. exports and helps raise the amount of tariff.
• Finally, the European Central Bank (ECB) kept interest rates unchanged in July, ending eight rate cuts over the past year. Meanwhile, the U.S. Federal Reserve eyes one or two rate cuts this year. The divergence in monetary policies would make the dollar weaken against the Euro, according to Interest Rate Parity (IRP).
The CFTC Commitments of Traders report shows that, as of July 22nd, CME Euro FX futures ($6E) have Open Interest of 843,447 contracts.
• Leveraged Funds have 102,310 in long, 73,901 in short, and 23,786 in spreads
• The long-short ratio of 1.4 shows that the “Smart Money” is bullish on the Euro
• The data reflects market sentiment before the trade deal
Micro Euro/FX Futures
A trader sharing a bullish view on Euro could explore the Micro Euro/FX futures ($M6E).
Each M6E contract has a notional value of 12,500 euro. On Monday afternoon, the September M6E contract (M6EU5) is quoted at 1.176, making it worth $14,700. Buying or selling one contract requires an initial margin of $340. The margining requirement reflects a built-in leverage of 43-to-1.
Let’s use a hypothetical trade to illustrate how to use a long futures position to take advantage of a potential rise of Euro.
Hypothetical Trade:
• Long 1 M6EU5 at 1.176, and set a stop loss at 1.15
• Trader pays $340 for initial margin
Scenario 1: Euro rises 5% to 1.235
• Long position gains: $737.5 (= (1.235-1.176) x 12500)
• The hypothetical return will be 217% (= 737.5 / 340)
Scenario 2: Euro falls 5% to 1.117
• The maximum loss: $325 (= (1.176-1.15) x 12500)
• While the position lost most of the money, the trader would not face a margin call due to the stoploss feature. Without it, the loss would have been $737.5
Happy Trading.
Disclaimers
*Trade ideas cited above are for illustration only, as an integral part of a case study to demonstrate the fundamental concepts in risk management under the market scenarios being discussed. They shall not be construed as investment recommendations or advice. Nor are they used to promote any specific products, or services.
CME Real-time Market Data help identify trading set-ups and express my market views. If you have futures in your trading portfolio, you can check out on CME Group data plans available that suit your trading needs www.tradingview.com
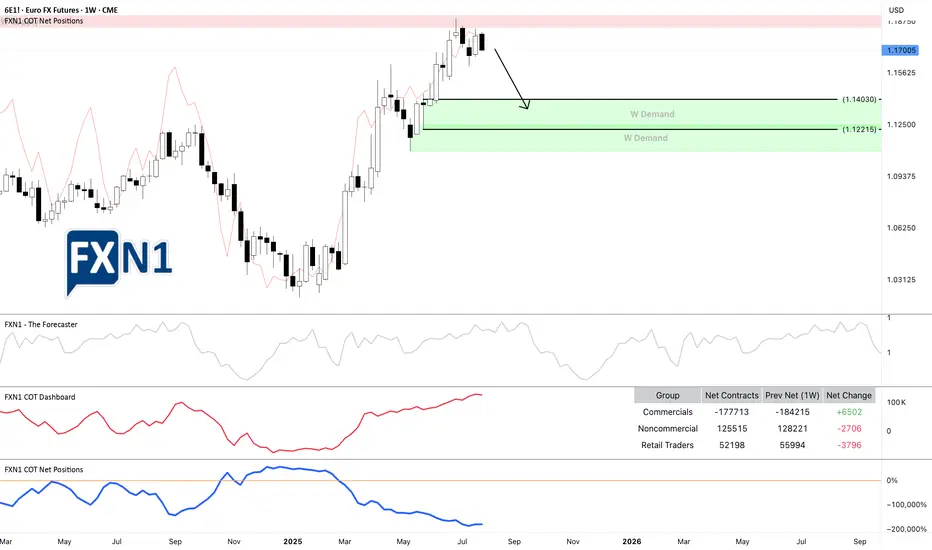
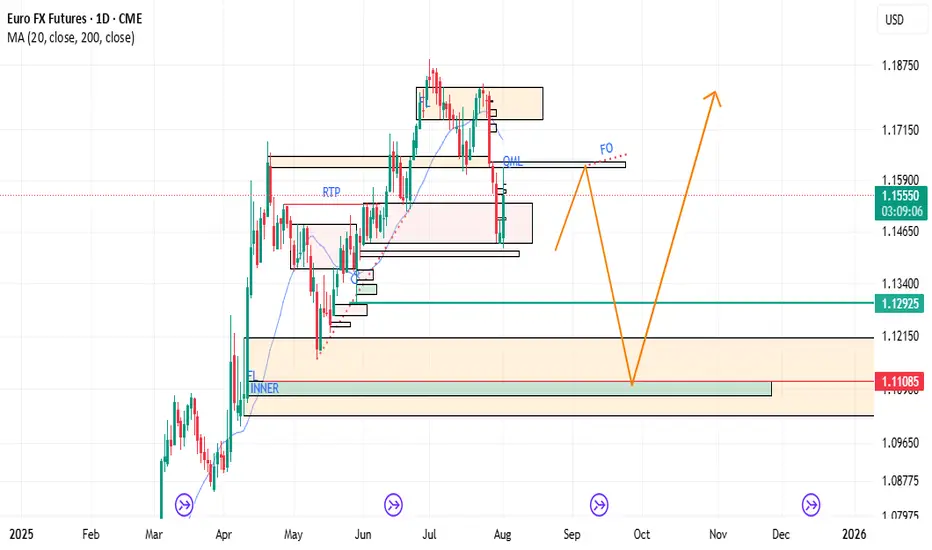
6E1!: Rebound at Weekly Supply Sparks Potential ReversalThe EURUSD (6E1! futures) experienced a rebound from a weekly supply zone * and now appears to be approaching a potential reversal toward a demand area. The overall picture is clear: we already capitalized on the rebound off the previous weekly supply zone, and at this point, we're simply observing the price as it approaches another key area of interest. It may be too late to initiate new short positions at this stage, but traders still holding shorts could potentially benefit from a continued move downward.
From a fundamental perspective, our Friday analysis of the DXY ** indicated the possibility of a bullish impulse, and today the US Dollar opened the session with a 0.58% gain. Currently, both commercial and non-commercial traders are aligned with the prevailing scenario. The most optimistic outlook suggests the price could decline to around 1.14030 over the coming weeks.
*
Previous analysis on EURUSD 6E1!
**
DXY Analysis
✅ Please share your thoughts about 6E1! in the comments section below and HIT LIKE if you appreciate my analysis. Don't forget to FOLLOW ME; you will help us a lot with this small contribution.