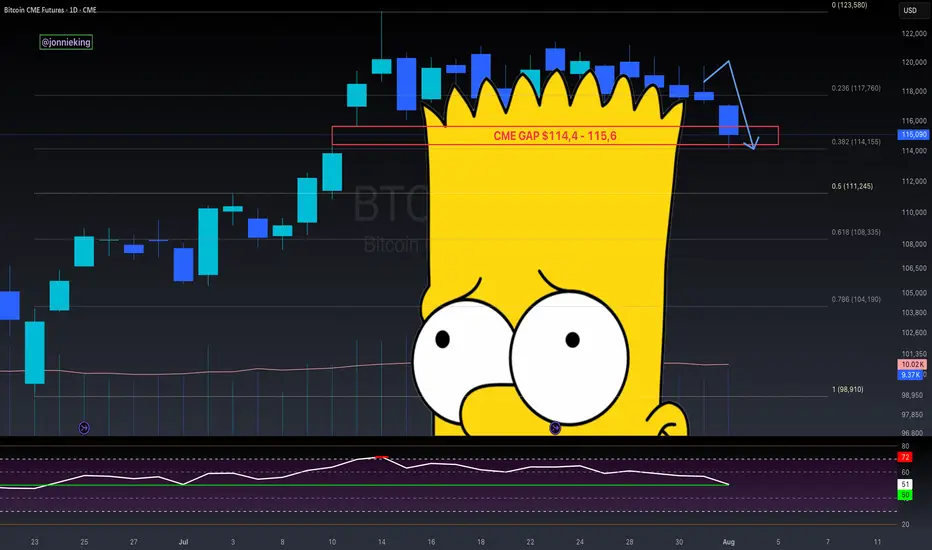
$BTC CME Gap + Bad Bart = Easiest Short EverCME Gap + Bad Bart is like taking candy from a baby 👨🏻🍼
Look at that textbook bounce off the .382 Fib 🤓
Pain ain’t over folks.
RSI still shows room on the downside 📉
Global Liquidity drain on the 4th.
Looking like the 50% Gann Level is next ~$111k
Get those bids in 😎
And never forget the Bul
Related futures
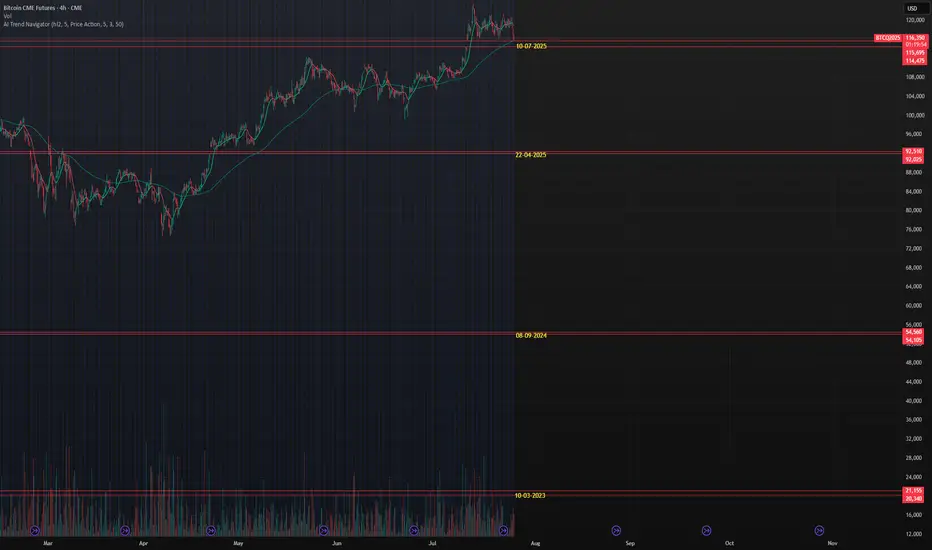
CME Gaps, which will be filled?Currently 4 gaps in the CME futures chart, running back till 2023 (march). What gap will be filled at some point in the future or will some remain open....
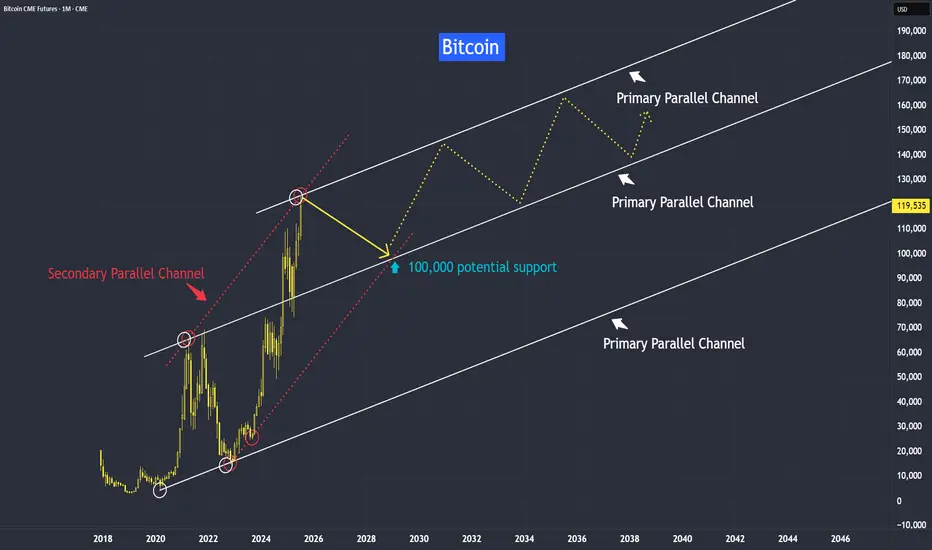
Bitcoin New Support at 100,000Bitcoin’s trend has been growing from strength to strength — and it’s likely to stay that way. Why?
This trend isn’t driven purely by speculation; it’s supported by strong fundamental reasons.
One of the most widely debated topics in finance today is the comparison between Bitcoin and gold. While
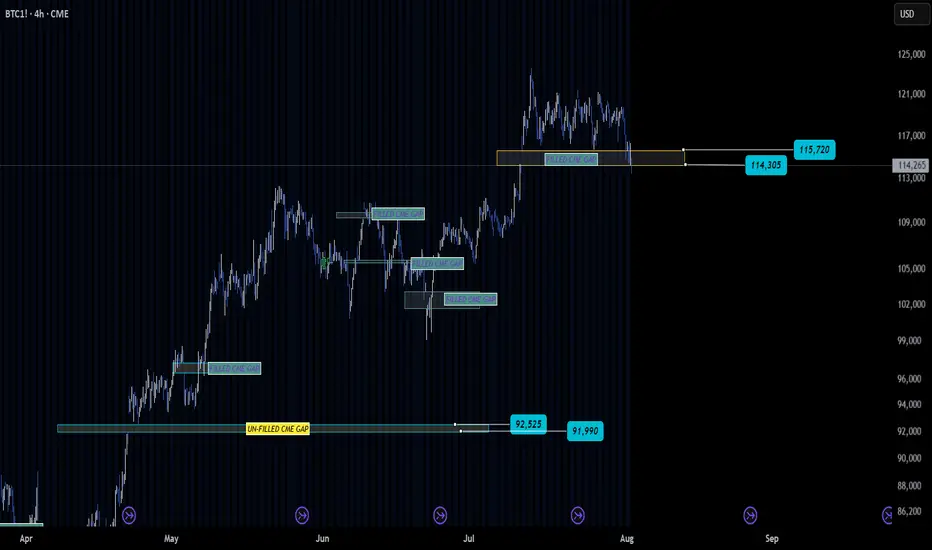
BTC Fills Key CME Gap — Eyes Now on What’s Next✅ The CME gap between 115700–114300 has officially been filled — a level many traders were watching closely.
What happens here could shape BTC’s next major move 🎯
Will we see consolidation, reversal, or continuation? Price action at this level deserves attention.
🕵️ Worth noting: one more unfilled
BITCOIN CME GAP IS FILLING RIGHT NOW!#Bitcoin CME Futures
Bitcoin is dipping — and all signs point to the CME gap getting filled.
Historically, these dips have been aggressively bought, so a strong bounce from here looks likely.

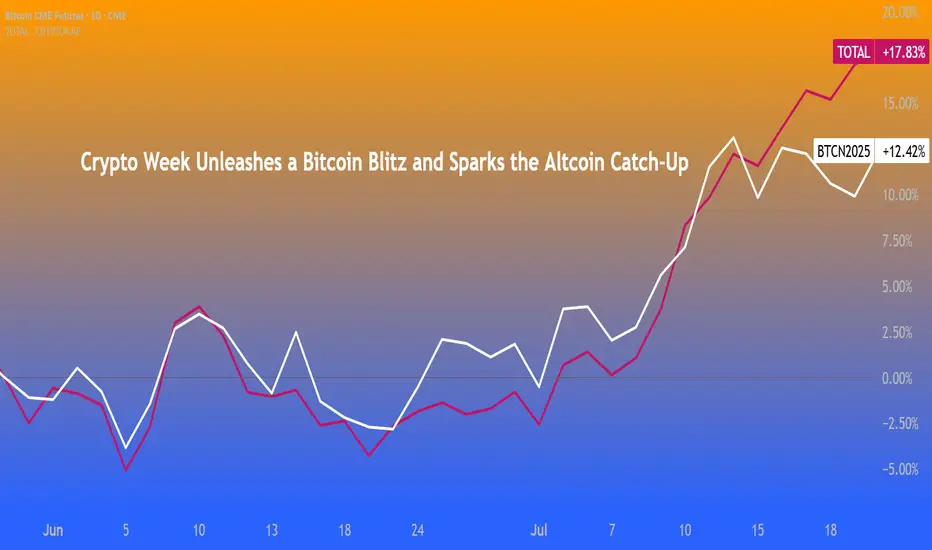
Crypto Week Unleashes a BTC Blitz & Sparks the Altcoin Catch-UpTotal crypto market capitalization has reached a new record high, driven by Bitcoin’s stunning rally. Other major coins, notably Solana and Ethereum, remain below their previous peaks.
These price records coincide with what President Trump has dubbed “Crypto Week.” Market insiders are preparing
Survival First, Success LaterThere was once a stone that lay deep in the heart of a flowing river.
Every day, the water rushed past it, sometimes gently, sometimes with force. The stone wanted to stay strong, unmoved. It believed that by holding its ground, it could outlast the river.
For years, the stone resisted. It didn’t

CME Gap: $115.8K–$116.8K Target or Trap?There’s a clear gap between $115,800 – $116,800 on the Bitcoin CME Futures chart. Historically, BTC tends to revisit and fill these gaps. Will we see a pullback to close it before the next move up? 📊
🧠 Watching price action closely around this zone. Share your thoughts below! 👇

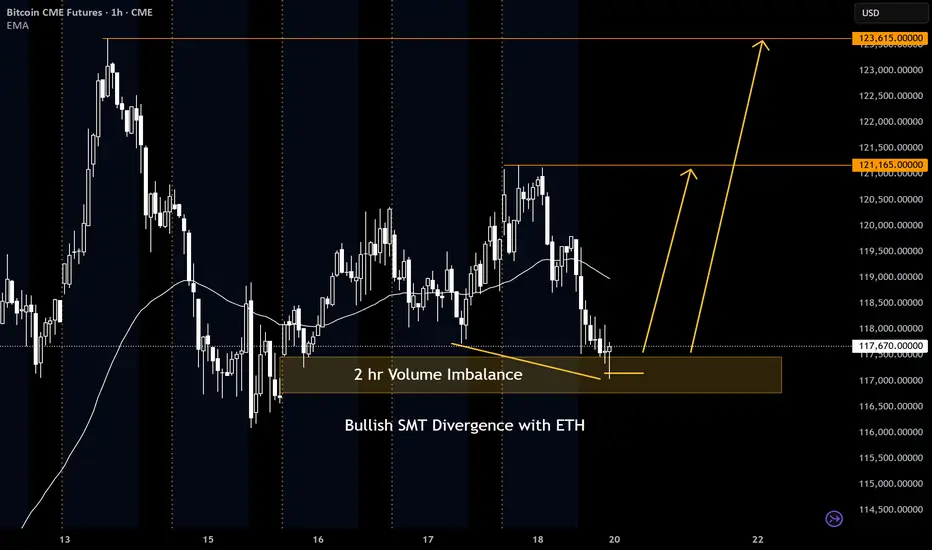
BTC Futures hitting ATH again???? Hmm....Looking at BTC futures, we have some bullish divergence with ETH. We also have a liquidity sweep into a 2 hr volume imbalance.
I will be looking at two areas to target. The first area is at 121,165 at the previous high and the second area is at 123,615 where the ATH will be broken.
Lets drop down
See all ideas
Summarizing what the indicators are suggesting.
Neutral
SellBuy
Strong sellStrong buy
Strong sellSellNeutralBuyStrong buy
Neutral
SellBuy
Strong sellStrong buy
Strong sellSellNeutralBuyStrong buy
Neutral
SellBuy
Strong sellStrong buy
Strong sellSellNeutralBuyStrong buy
A representation of what an asset is worth today and what the market thinks it will be worth in the future.
Displays a symbol's price movements over previous years to identify recurring trends.
Frequently Asked Questions
The current price of Bitcoin CME Futures is 114,830 USD — it has fallen −0.16% in the past 24 hours. Watch Bitcoin CME Futures price in more detail on the chart.
The volume of Bitcoin CME Futures is 879.00. Track more important stats on the Bitcoin CME Futures chart.
Open interest is the number of contracts held by traders in active positions — they're not closed or expired. For Bitcoin CME Futures this number is 22.14 K. You can use it to track a prevailing market trend and adjust your own strategy: declining open interest for Bitcoin CME Futures shows that traders are closing their positions, which means a weakening trend.
Buying or selling futures contracts depends on many factors: season, underlying commodity, your own trading strategy. So mostly it's up to you, but if you look for some certain calculations to take into account, you can study technical analysis for Bitcoin CME Futures. Today its technical rating is buy, but remember that market conditions change all the time, so it's always crucial to do your own research. See more of Bitcoin CME Futures technicals for a more comprehensive analysis.