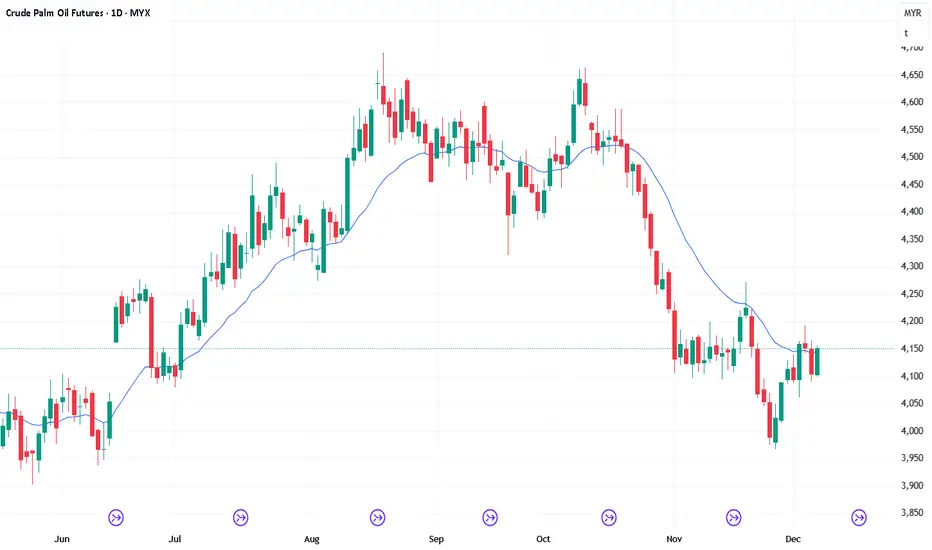
FCPO: Looking to sell.Looking to sell as price is retracing higher in a bearish trend. Area to sell is around 4135-4140. Immediate target is 4000.
Boost the idea if you think the same.
Happy trading.
USD Malaysian Crude Palm Oil Calendar Futures
No trades
Related commodities

9/12/25 Bears Need Follow-through Selling
Monday’s candlestick (Dec. 8) was a bear bar closing near its low.
In our previous report, we stated that traders would see whether the bulls could create a follow-through bull bar closing above the 20-day EMA, or if the market would trade lower instead.
The market traded lower testing the Thu

8/12/25 Market Back to 4100-50 Tight Trading Range Area
Friday’s candlestick (Dec. 4) was an inside bull bar closing near its high.
In our previous report, we stated that traders would watch to see whether the bears could create follow-through selling and close far below the 20-day EMA, or if the market would trade higher to retest the area near the
10/12/25 Bulls Need FT Buying Closing Above 20-Day EMA
Tuesday’s candlestick (Dec. 9) was a bull bar closing near its high with a long tail below.
In our previous report, we stated that traders would watch to see whether the bears could create a follow-through bear bar breaking below the tight trading range (4100) level, or if the market would trad

5/12/25 Can Bears Get FT Selling or Retest Above 20-Day EMA?
Thursday’s candlestick (Dec. 4) was a bear bar closing in its lower half with a small tail below.
In our previous report, we stated that traders would watch if the bears could create follow-through selling and close far below the 20-day EMA, or if the market would trade slightly lower but close

4/12/25 Can Bears Create Strong Retest of Nov 26 Low?
Wednesday’s candlestick (Dec. 3) was a bear doji closing near its low with a long tail above.
In our previous report, we stated that traders would watch if the bulls could create follow-through buying, or if the market would trade slightly higher but close with a long tail above, closing below

3/12/25 Can Bulls Create FT Buying Above the 20-Day EMA?
Tuesday’s candlestick (Dec. 2) was an outside bull bar closing near its high with a long tail below.
In our previous report, we stated that traders would see whether the bulls could create a retest and close above the 20-day EMA, or if the bears create a strong retest of the November low instea

11/12/25 Bulls Need Strong FT Above 20-Day EMA
Wednesday’s candlestick (Dec. 10) was a bear bar closing around the middle of its range with a long tail below.
In our previous report, we stated that traders would watch to see whether the bulls could create a follow-through test near or above the 20-day EMA, or if the market would trade sligh

FCPO - A high probably setupSince the last posting on November 25 2025, the market posed another interesting set up which infer a probable wave 3 developing to the upside if the reading is right.
The price movement displayed retracements and wave relationships are just to befitting to ignore. If this plays out to the guideline

FCPO Fibo 2.618now price at RM4,157.
Now price at resistant maybe price can break or pullback to level fibo 1.168 at TF H2.
if price break resistant maybe the price find another resistant.

See all ideas
Summarizing what the indicators are suggesting.
Neutral
SellBuy
Strong sellStrong buy
Strong sellSellNeutralBuyStrong buy
Neutral
SellBuy
Strong sellStrong buy
Strong sellSellNeutralBuyStrong buy
Neutral
SellBuy
Strong sellStrong buy
Strong sellSellNeutralBuyStrong buy
A representation of what an asset is worth today and what the market thinks it will be worth in the future.
Displays a symbol's price movements over previous years to identify recurring trends.
Frequently Asked Questions
The current price of USD Malaysian Crude Palm Oil Calendar Futures is 988.50 USD — it has risen 0.13% in the past 24 hours. Watch USD Malaysian Crude Palm Oil Calendar Futures price in more detail on the chart.
Track more important stats on the USD Malaysian Crude Palm Oil Calendar Futures chart.
Open interest is the number of contracts held by traders in active positions — they're not closed or expired. For USD Malaysian Crude Palm Oil Calendar Futures this number is 2.60 K. You can use it to track a prevailing market trend and adjust your own strategy: declining open interest for USD Malaysian Crude Palm Oil Calendar Futures shows that traders are closing their positions, which means a weakening trend.
Buying or selling futures contracts depends on many factors: season, underlying commodity, your own trading strategy. So mostly it's up to you, but if you look for some certain calculations to take into account, you can study technical analysis for USD Malaysian Crude Palm Oil Calendar Futures. Today its technical rating is strong sell, but remember that market conditions change all the time, so it's always crucial to do your own research. See more of USD Malaysian Crude Palm Oil Calendar Futures technicals for a more comprehensive analysis.