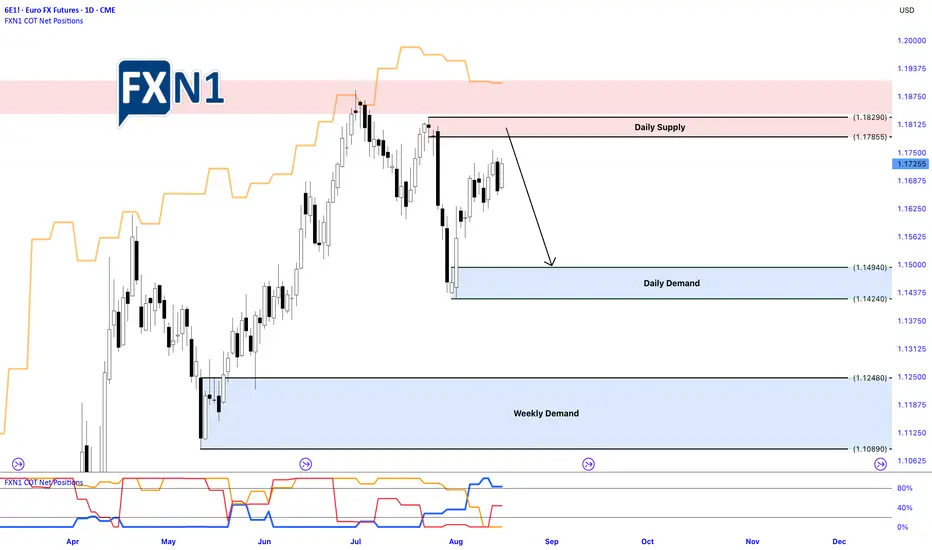
EUR: COT Data Indicates Dollar ResilienceThe EURUSD pair closed the previous week with a bullish weekly candle, positioned within the bounds of a significant two-week-old bearish candle. This pattern suggests a potential pause or consolidation phase after a strong downtrend, but traders should remain cautious as the overall trend still bea
Related futures
EURUSD: Potential Bullish liquidity after liqudity grabHello traders here's my point of view about CME_MINI:E71! CMCMARKETS:EURUSD
For the past months we've seen massive bullish momentum. The overall trend remains bullish specially if TVC:DXY continue bearish.
Yesterday, price retested a solid H4 ORDERBLOCK around the 1.6500 area. This was so

EURO Building for next move Today's Jackson Hole Conference is going to be explosive i believe in one way or another , with either the doves or hawks getting hold of the markets and this will impact Treasuries, equities and the $ so prepare

EUR: Waiting for Clarity in DXY and DirectionLast week, the 6E1! (Euro Futures / EUR/USD) closed with a solid bullish candle, successfully breaking through a key supply zone, signaling strong upward momentum. However, as the new week begins, the market has shifted to bearish pressure, indicating some uncertainty and potential consolidation.
T
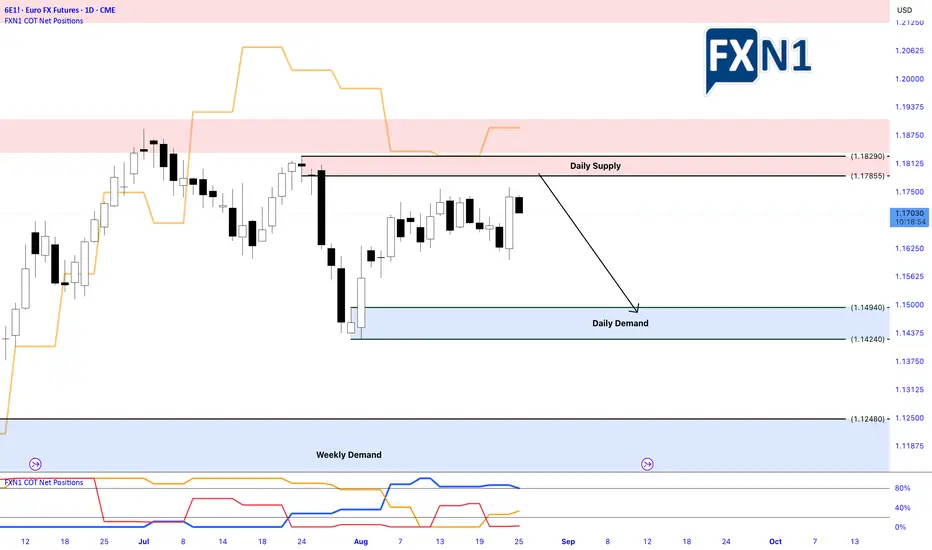
EURUSDEUR/USD is looking heavy. COT shows traders leaning too short the dollar while price action keeps favoring USD strength. Add in weakening eurozone data, and this pair looks ripe for a deeper move lower. Momentum favors the bears.

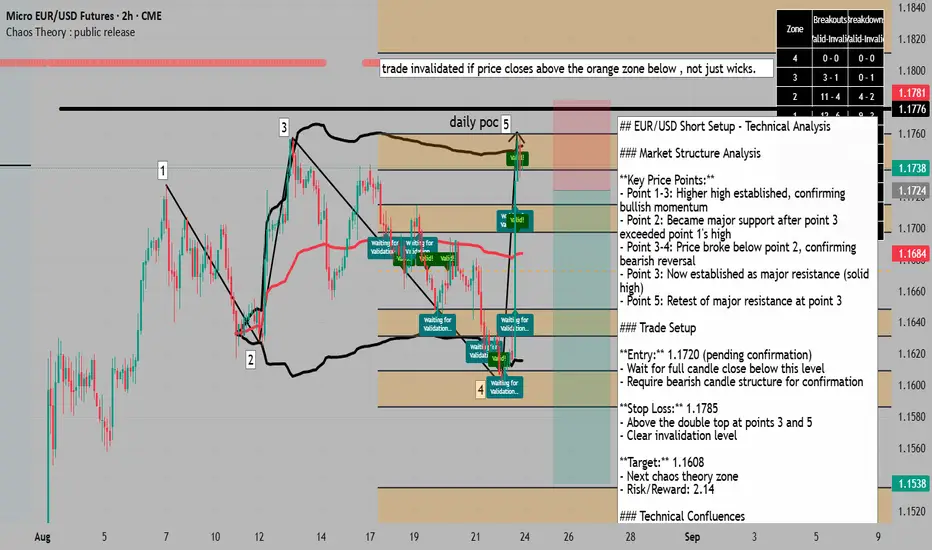
support broken, lower TF potentially joining major =SELL trend## EUR/USD Short Setup - Technical Analysis
### Market Structure Analysis
**Key Price Points:**
- Point 1-3: Higher high established, confirming bullish momentum
- Point 2: Became major support after point 3 exceeded point 1's high
- Point 3-4: Price broke below point 2, confirming bearish reversa
**Setup Narrative (educational)**1. **Context Prep:** We tagged the 12 AM bias—watching for a liquidity sweep into London (2–5 AM). Right on cue, the price trapped early movers.
2. **Price Reaction:** That trap sets the stage—when New York opens, price drives the opposite direction.
3. **Sniper Lesson:** Don’t react. Anticipate.

Trap Day Example – 12AM Bias, London Trap & New York Silver BullThis schematic illustrates how price action often sets up around key time windows and liquidity pools, independent of the actual news release.
• 12AM Candle Bias: The 12AM (NY) hourly candle often sets the directional framework for the day. A red candle can sometimes indicate the opposite bias (bul

Euro Bearish PredictionEuro Bearish Prediction.
Reversal point on multiple high volume nodes paired with previous month naked POC.
weekly and daily VA extensions.

EURUSDEURUSD Weekly/Upcoming Monthly Closure Out Look.
With the current signs of dollar weakness on the macro outlook I believe we can maintain the bullish stance on EU.
Trade Smart Trade Safe.

See all ideas
Summarizing what the indicators are suggesting.
Neutral
SellBuy
Strong sellStrong buy
Strong sellSellNeutralBuyStrong buy
Neutral
SellBuy
Strong sellStrong buy
Strong sellSellNeutralBuyStrong buy
Neutral
SellBuy
Strong sellStrong buy
Strong sellSellNeutralBuyStrong buy
A representation of what an asset is worth today and what the market thinks it will be worth in the future.
Frequently Asked Questions
The current price of E-mini Euro FX Futures (Dec 2025) is 1.1700 USD — it has risen 0.95% in the past 24 hours. Watch E-mini Euro FX Futures (Dec 2025) price in more detail on the chart.
The volume of E-mini Euro FX Futures (Dec 2025) is 16.00. Track more important stats on the E-mini Euro FX Futures (Dec 2025) chart.
The nearest expiration date for E-mini Euro FX Futures (Dec 2025) is Dec 15, 2025.
Traders prefer to sell futures contracts when they've already made money on the investment, but still have plenty of time left before the expiration date. Thus, many consider it a good option to sell E-mini Euro FX Futures (Dec 2025) before Dec 15, 2025.
Open interest is the number of contracts held by traders in active positions — they're not closed or expired. For E-mini Euro FX Futures (Dec 2025) this number is 155.00. You can use it to track a prevailing market trend and adjust your own strategy: declining open interest for E-mini Euro FX Futures (Dec 2025) shows that traders are closing their positions, which means a weakening trend.
Buying or selling futures contracts depends on many factors: season, underlying commodity, your own trading strategy. So mostly it's up to you, but if you look for some certain calculations to take into account, you can study technical analysis for E-mini Euro FX Futures (Dec 2025). Today its technical rating is sell, but remember that market conditions change all the time, so it's always crucial to do your own research. See more of E-mini Euro FX Futures (Dec 2025) technicals for a more comprehensive analysis.