Nasdaq’s All Time HighsLiquidity moves liquidity.
Expansion, Retracement, Reversal, Consolidation
Market is doing 1 of these 4
Expansion is determined by where liquidity sits and where it is going. Price delivery is upmost important when receiving bias and narrative
Seeing where price is coming from is just as important as seeing where price plans to go.
Rookies make the mistakes of catching the small reversals thinking it is the big move, it’s not.
Price is simply reaching equilibrium and balancing out buyers and sellers … Zoom out, you’re a sniper in a big field with one target, when you’re unsure always zoom out.
External range liquidity will target Internal range liquidity and vic versa.
Finding your entry in a discount/premium inside a context is key.
But by all means do NOT get caught in the pullback.
ESH2027 trade ideas
ES Futures — Week Ahead Playbook (Aug 11–15)Macro Drivers to Watch
Tue Aug 12 @ 8:30 AM ET — CPI (July)
Key inflation print; expect sharp vol expansion in NY AM.
Wed Aug 13 @ 2:00 PM ET — FOMC Minutes
Insight into Fed’s July 29–30 meeting tone.
Fri Aug 15 @ 8:30 AM ET — PPI (July) + Retail Sales (July)
Two high-impact releases within minutes.
Geopolitics:
US–China tensions over AI chip export controls & Russian oil tariffs
Possible Alaska summit with Trump, Putin, Zelenskyy Friday.
Bias & Structure
Trend (30m / 15m / 5m): Still bullish but pressing into 6415–6425 supply / weak-high zone.
Demand below: ~6410, ~6397, ~6386, ~6374.
Supply above: ~6425, ~6442–6446, ~6460–6465.
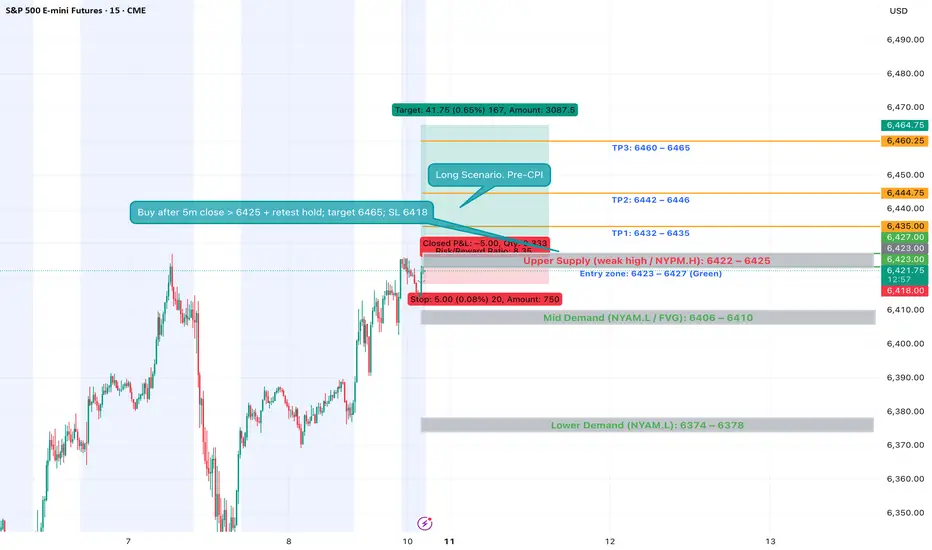
Setup 1 — Post-CPI Continuation Long
Trigger: First 5m close above 6422–6425 after CPI, then retest holds.
Entry: 6423–6427 (retest).
Invalidation: 5m close < 6418.
Targets:
TP1: 6432–6435
TP2: 6442–6446
TP3: 6460–6465
Notes: Needs bullish displacement, BOS hold, and Bookmap absorption on retest.
Setup 2 — Post-CPI Reversal Short
Trigger: Hot CPI or failed breakout → 5m close < 6406–6410, then retest from below.
Entry: 6406–6410.
Invalidation: 5m close > 6413–6415.
Targets:
TP1: 6388–6392
TP2: 6376–6378
TP3: 6358–6362
Notes: Needs trend flip on 30m/15m (CHoCH/BOS down) & heavy offer-side aggression.
Corrective Dip or New Downtrend on the S&P 500 Futures?🟣 1. Impulses vs. Corrections – The Classical View
When price trends, it doesn't move in a straight line. Instead, it alternates between directional movements called impulses and counter-directional pauses or retracements known as corrections. Most analysts define an impulse as a sharp, dominant move in the direction of the trend—typically accompanied by rising volume and momentum indicators. Corrections, on the other hand, tend to be slower, overlapping, and often occur with declining volume.
Common methods to identify impulses vs. corrections include:
Swing structure: Higher highs and higher lows suggest impulse; overlapping lows suggest correction.
Fibonacci retracements: Corrections often retrace up to 61.8% of a prior impulse.
Moving averages: Price above a rising MA is often viewed as impulse territory.
Volume analysis and oscillators such as RSI or MACD are used to confirm price behavior.
Despite the abundance of methods, the distinction between impulses and corrections often remains subjective. That’s where the Directional Movement Index (DMI) provides an objective lens—especially when paired with price action.
🟣 2. Rethinking Impulses with the DMI Indicator
The Directional Movement Index (DMI), developed by J. Welles Wilder, offers a quantitative way to assess the strength and direction of price movement. It breaks down market activity into three components:
+DMI (Positive Directional Movement Index): Measures the strength of upward movements.
−DMI (Negative Directional Movement Index): Measures the strength of downward movements.
ADX (Average Directional Index): Quantifies overall trend strength but is optional in this discussion.
The key to applying DMI lies in the crossover between +DMI and -DMI:
When +DMI > -DMI, upward price moves dominate—suggesting bullish impulses.
When −DMI > +DMI, downward moves dominate—suggesting bearish impulses.
Calculation is based on a comparison of successive highs and lows over a specific lookback period—commonly set to 14 or 20 periods.
While EMAs track trend direction and momentum, DMI helps dissect who’s in control. This makes it a powerful filter when evaluating whether a breakdown or breakout is likely to become an impulsive trend—or just another correction in disguise.
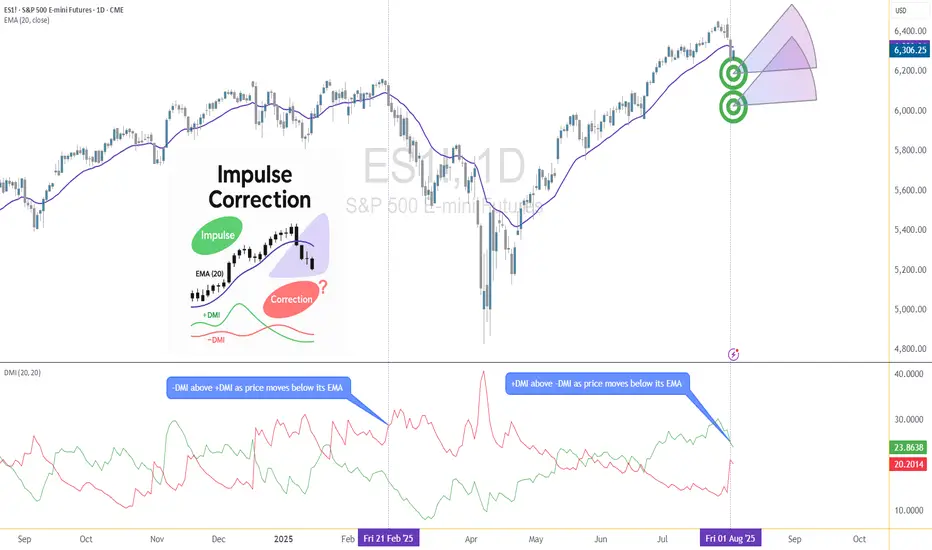
🟣 3. Case Study – Two Breakdowns, Two Outcomes
Let’s apply this logic to two recent moments on the E-mini S&P 500 Futures (ES) daily chart.
🔹 Feb 21, 2025 Breakdown
Price broke sharply below the 20-period EMA. At first glance, this looked like a potential trend reversal. The DMI confirmed this suspicion: −DMI surged above +DMI, signaling downside impulses were in control. The market followed through with a clear downtrend, confirming the move was not just a pullback—it was a shift in market structure.
🔹 Aug 1, 2025 Breakdown
A similar sharp break below the 20 EMA just occurred again. However, this time +DMI remains above −DMI, despite the bearish price action. This divergence tells a different story: the breakdown may not be impulsive in nature. Instead, it's likely a corrective dip within a broader uptrend, where buyers are still the dominant force.
This is a textbook example of how a moving average crossover without DMI confirmation can mislead traders. By combining these tools, we’re able to make more informed decisions about whether price action is signaling a true shift—or just a pause.
🟣 4. CME Product Specs – ES vs. MES
Traders can express directional views on the S&P 500 using two primary CME futures contracts: the E-mini S&P 500 Futures (ES) and the Micro E-mini S&P 500 Futures (MES). Both track the same underlying index but differ in size, capital requirement, and tick value.
✅ E-mini S&P 500 Futures (ES)
Symbol: ES
Contract Size: $50 x S&P 500 Index
Tick Size: 0.25 index points
Tick Value: $12.50
Initial Margin: Approximately $21,000 (varies by broker and through time)
Market Hours: Nearly 24/6
✅ Micro E-mini S&P 500 Futures (MES)
Symbol: MES
Contract Size: $5 x S&P 500 Index
Tick Size: 0.25 index points
Tick Value: $1.25
Initial Margin: Approximately $2,100 (varies by broker and through time)
The Micro contract provides access to the same market structure, liquidity, and price movement as the E-mini, but with a fraction of the exposure—making it ideal for smaller accounts or more precise position sizing.
🟣 5. Risk Management Matters
Understanding whether a market move is impulsive or corrective isn’t just academic—it’s the difference between positioning with the dominant flow or fighting it. Traders often get trapped by sharp moves that appear trend-defining but are simply noise or temporary pullbacks.
Using tools like DMI to confirm whether directional strength supports price action provides a layer of risk filtration. It prevents overreaction to every EMA crossover or sudden price drop.
Stop-loss orders become vital in both impulsive and corrective conditions. In impulsive environments, stops help lock in profits while protecting from reversals. In corrective phases, they act as circuit breakers against breakouts that fail.
Moreover, knowing the product you're trading is critical:
A single ES contract controls ~$320,000 of notional value.
An MES contract controls ~$32,000.
This disparity means poor sizing on ES can magnify errors, while proper sizing on MES can offer flexibility to test, scale, and hedge with tighter capital control.
Whether you're reacting to price or preparing for continuation, risk management is the only constant. It’s what turns analysis into disciplined execution.
When charting futures, the data provided could be delayed. Traders working with the ticker symbols discussed in this idea may prefer to use CME Group real-time data plan on TradingView: www.tradingview.com - This consideration is particularly important for shorter-term traders, whereas it may be less critical for those focused on longer-term trading strategies.
General Disclaimer:
The trade ideas presented herein are solely for illustrative purposes forming a part of a case study intended to demonstrate key principles in risk management within the context of the specific market scenarios discussed. These ideas are not to be interpreted as investment recommendations or financial advice. They do not endorse or promote any specific trading strategies, financial products, or services. The information provided is based on data believed to be reliable; however, its accuracy or completeness cannot be guaranteed. Trading in financial markets involves risks, including the potential loss of principal. Each individual should conduct their own research and consult with professional financial advisors before making any investment decisions. The author or publisher of this content bears no responsibility for any actions taken based on the information provided or for any resultant financial or other losses.
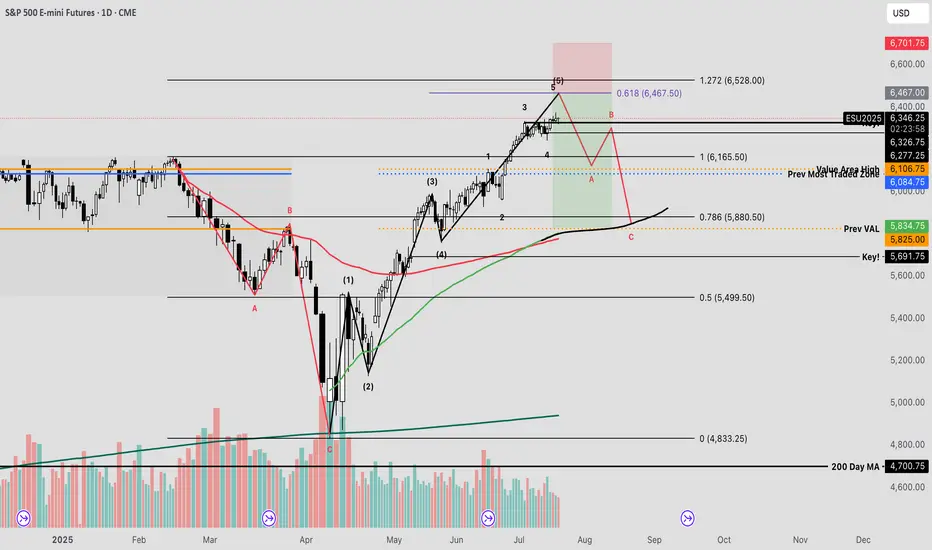
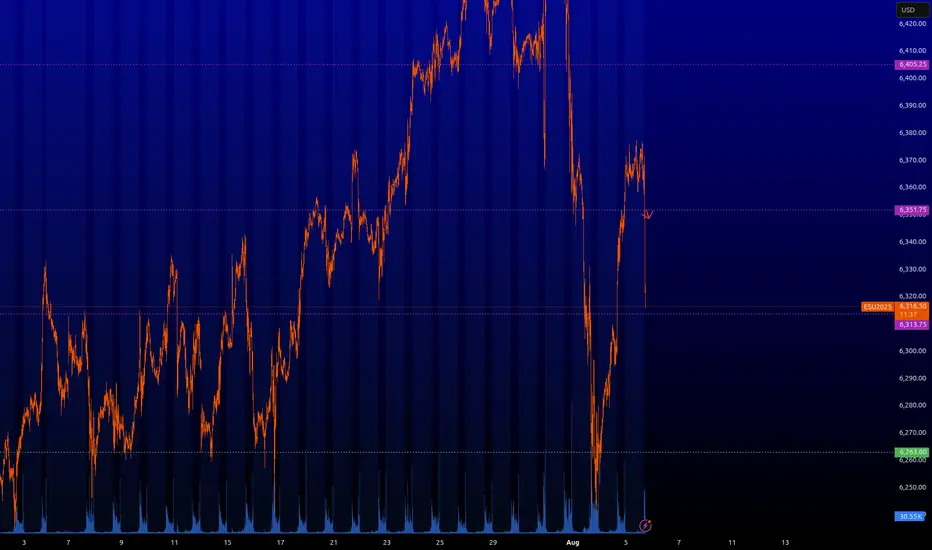
SPY The Final Countdown Since the April lows, equity markets have exhibited strong performance, with many stocks appreciating by nearly 100%—some even exceeding that threshold. Given the velocity of this rally, a corrective pullback may be imminent before the broader uptrend resumes.
The current reading on the Fear & Greed Index places market sentiment firmly within the "extreme greed" territory—historically a zone where investors often begin to lock in profits or initiate contrarian positions against the prevailing trend.
From a technical standpoint, I’ve conducted an Elliott Wave impulse analysis to evaluate the recent price structure. This method, which utilizes Fibonacci-based mathematical relationships, provides insight into the expansion and contraction phases of market cycles.
Using the trend-based Fibonacci extension tool, one can estimate potential termination zones for impulse waves. In the current scenario, the fifth wave appears to be approaching completion. By analyzing the proportional relationships between waves 1, 3, and 4, a key confluence level emerges at the 61.8% extension—commonly referred to as the “golden pocket”—just above the 6400 level on the futures chart.
I plan to set alerts at this price level to secure profits, hedge existing positions, and potentially initiate a short trade—should market structure confirm a reversal through a valid breakdown trigger.
Approachable Contracts for Trading Around Fed DecisionsCME Group E-Mini S&P Options ( CME_MINI:ES1! ) and Micro S&P Futures ( CME_MINI:MES1! ), #microfutures
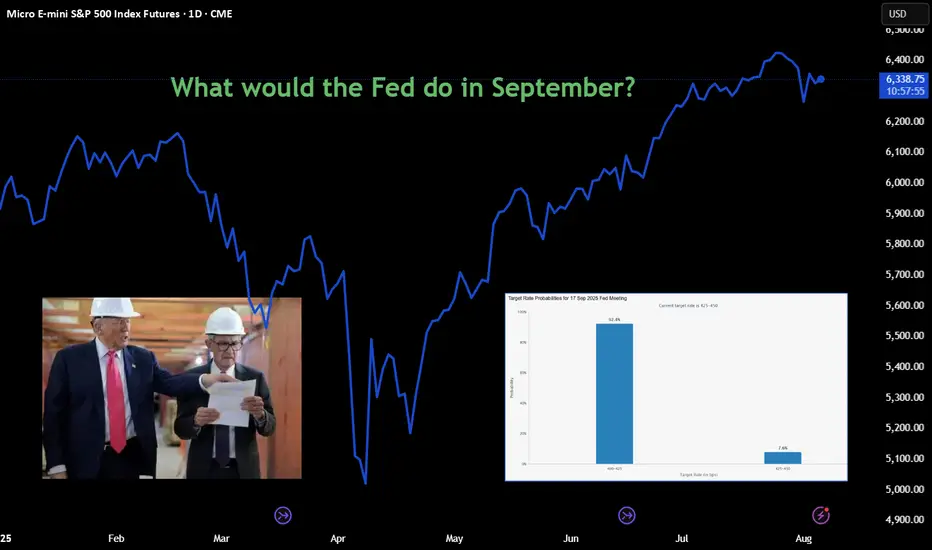
On July 30th, the Federal Open Market Committee (FOMC) decided to keep the Fed Funds rate unchanged at the 4.25-4.50% target range. Investors now turn their focus on whether the Fed will cut rates on the September 16th-17th FOMC meeting.
According to CME FedWatch Tool, as of August 6th, there is a 92.4% chance that the Fed will cut rates by 25 bps in September. My observation:
• Before July FOMC, market consensus was no rate cut, with the odds at 95.3% as of July 20th. Investors now overwhelmingly expect rate cuts to come at the next meeting.
• Two Fed governors broke the long-run consent and voted against the FOMC decision.
Today, I would like to explore two trading strategies focusing on the next Fed decision.
We will start by breaking down all possible Fed decisions as follows:
1) Cut rates by 25 basis points (92.4%)
2) No rate cuts (7.6%)
3) All others, such as cutting by 50 bps and raising rates by 25 bps (0%)
If we deem the 3rd option to be statistically insignificant, we now have an event with binary outcomes, namely, Cut and No Cut .
Since “Cut” is the market consensus, we will translate the possible outcomes as:
• Meet market expectations (Cut Rates)
• Exceed market expectations (No Cut)
Furthermore, financial markets will likely react calmly if the Fed decision meets expectations, while asset prices could swing widely if the FOMC exceeds expectations.
Typically, US stock market indexes, interest rate contracts and the US dollar exchange rates are very sensitive to the Fed decisions. Our discussion today will focus on stock indexes. I will follow up on the other two asset classes in future writings.
Based on the above analytical framework, we could design two sets of trading strategies:
Sell Call Options if a trader expects the Fed to cut rates
• Since the decision meets expectations, asset prices would not move a lot.
• Options may expire worthiness, which allows sellers to pocket the premium as profit.
Sell Futures if a trader expects No Cut
• Since the decision exceeds expectations, S&P prices could go down sharply.
• With build-in leverage in futures contracts, a trader could realize enhanced profit.
Now, let’s explore how to structure trading strategies using S&P futures and options.
Hypothetical Fed Decision 1: Meet Expectations
Cutting rates is bullish for S&P as it will lower borrowing costs for component companies. However, since market already priced in a Fed cut, stock prices will not move a lot.
If a trader shares this view, he could explore selling Out-of-the-Money (OTM) Call Options on CME E-Mini S&P 500 futures ( NYSE:ES ).
Each ES contract has a notional value of $50 x S&P 500 Index. On August 6th, the September ES contract (ESU5) is quoted at 6,341, making the notional value at $317,050.
• Call options at the 6500-strike are quoted at $42. By selling 1 call, options seller will receive $2,100 in upfront premium (= 42 x 50).
• Options expire on September 19th, two days after the FOMC. If ESU5 price does not exceed 6500, options seller will pocket the premium as profit.
• Warnings: selling options involves significant risks. Seller could lose more than the premium he collected. To cut losses, seller could buy back at the open market and exit the position. This will avoid losses to accumulate by expiration date.
Hypothetical Fed Decision 2: Exceed Expectations
Since rate cut is already priced in, an Unchanged decision will likely cause the S&P to fall sharply, as expected future borrowing costs will go up.
If a trader shares this view, he could explore selling CME Micro S&P 500 futures ( MSTAR:MES ).
Each MES contract has a notional value of $5 x S&P 500 Index. On August 6th, the notional value of ESU5 is $31,705. Buying or selling 1 futures contract requires an upfront margin deposit of $2,135 at the time of this writing.
Micro S&P 500 futures are 1/10 in notional comparing to its E-Mini counterpart. With smaller size and lower margin requirement, the micro contracts are more approachable for non-professional traders. At the same time, they also enjoy the leverage built-in the futures contracts. Micro S&P contracts tap into the liquidity pool with the broad S&P contract suite.
Hypothetical Trade
• Short 1MESU5 at 6,341, and set a stop loss at 6450
• Trader pays $2,135 for initial margin
A “Meet” Scenario: S&P go up 1.5% to 6,436
• Short position loss: $475 (= (6436-6341) x 5)
• The maximum loss will be $545 if the S&P moves higher, due to the stop-loss feature
An “Exceed” Scenario: S&P falls 5% to 6,024
• Short position gain: $1,585 (= (6341-6024) x 5)
• The theoretical return is 74.2% (= 1585/2135), excluding transaction fees
Happy Trading.
Disclaimers
*Trade ideas cited above are for illustration only, as an integral part of a case study to demonstrate the fundamental concepts in risk management under the market scenarios being discussed. They shall not be construed as investment recommendations or advice. Nor are they used to promote any specific products, or services.
CME Real-time Market Data help identify trading set-ups and express my market views. If you have futures in your trading portfolio, you can check out on CME Group data plans available that suit your trading needs www.tradingview.com
This is a focus the Index marketIt's Sunday and you might want to look at the S&P when the Market opens later tonight. For 2 days the S&P went lower and I think you can categorize this as an expanding Market and it's very tradable. You can even miss the trade on Thursday and still make a good return on Friday. Also I would call this a spike pattern and my assumption is that the market had a range on the first day that was Thursday and then it doubled the range on Friday. There's very good volatility in the S&P and I believe there is an order to it that can help you find trades that otherwise leave you with no options when they really do exist. At the end of the video I put on a range box by definition it can't be a perfect box because I need a little bit more information probably on Monday but it might be Tuesday..... And it doesn't always work but if you take this approach to the market and if you use the tools that I work with including 2 bar reversals and you're willing to Short because sellers are who are making money on the S&P on Thursday and Friday and possibly own Monday. Most Traders will never short .... And they will miss tremendous opportunity. I will follow up on this Market on Monday or Tuesday.

Day 1 Trading Only S&P Futures — Starting with $200 Profit
Day 1 — Trading Only S&P Futures
Daily P/L:+ 204 :moneybag:
Sleep: 8 hours
Emotions: Tired and sored from muay thai.
:thought_balloon: Today’s Trade thoughts:
I was leaning bearish in the market because we had such strong selling pressure on Friday butonce we broke over the level i posted last week at 6330, I gave up on my bias and I just followed the signals and traded the the X1dd buy signal with @gohawks14 and shorted the Max gamma resistance around 6352 and called a day when i made $200.
I think for this week as we start the trading challenge, I want to have one account where i just make $200 and call it a day so this way i can build consistency and get my trading % up.
:bell:News Highlights:
DOW REBOUNDS NEARLY 600 POINTS, VIX PLUNGES AS U.S. STOCKS END SHARPLY HIGHER ON RATE-CUT OPTIMISM
:bar_chart: VX Algo Signals (9:30am – 2pm EST):
9:00 AM Market Structure flipped bullish on VX Algo X3!
10:10 AM VXAlgo NQ X1 Sell Signal
10:40 AM VXAlgo ES X1 Sell Signal
11:40 AM VXAlgo NQ X1DD Buy Signal (Double buy signal)
11:40 AM VXAlgo ES X1 Buy signal
12:40 PM VXAlgo NQ X1 Sell Signal
1:21 PM VXAlgo ES X1 Sell Signal
2:00 PM VXAlgo ES X3 Sell Signal
:chart_with_upwards_trend: Key Levels for Tomorrow:
Above 6332 = Bullish
Below 6300 = Bearish
:link: Recap & Charts: www.tradingview.com

Why You’re Not Successful as a Trader(And What Nobody Tells You)A lot of people want to know how to succeed at trading. They jump into day trading thinking it’s super easy. Just click a button and make money, right? And in a way, it really is that simple because every trade has about a 50/50 chance of being right or wrong. But here is the thing most people do not realize.
To be truly successful long term (a month or more) you have to treat trading like a business and perform like a top athlete.
Let me explain why by sharing a story from my own life.
Back in high school I was one of the top two athletes in my city. Imagine a sport similar to tennis. There were others who were taller, stronger, more naturally gifted in every way. But they were not as consistent as I was. That consistency gave me the edge.
Here is what I did differently.
I worked out every day building cardio and training specific muscles in my arms, shoulders, and legs for explosive power.
I practiced really difficult shots hundreds and hundreds of times. When I made those shots during games people called it luck. But I knew better. I had rehearsed those shots so much that there was almost a 99 percent chance I would make them.
I also played mind games with my opponents. I talked to them before matches and gave them false confidence by saying I had injuries or wasn’t feeling great. Sometimes I praised a shot they had but secretly I had studied it carefully and knew exactly how to counter it. I was setting them up to lose.
The stock market is just the same.
It is a competition. The market is full of opponents, other traders, institutions, algorithms, all fighting for an edge. If you want to be in the top 10 percent who consistently make profits you have to be at the top of your game mentally, physically, and emotionally.
That is why so many traders fail. They don’t realize they need to train themselves like athletes. Having the right indicators or a big account is not enough. If you are tired, stressed, or emotionally drained, you are far more likely to make mistakes.
Ask yourself.
Did I sleep well last night?
Am I managing my stress and emotional environment like family issues or distractions?
Am I exercising enough to keep my heart and mind sharp?
Am I fueling my brain with the right nutrition and supplements?
Am I constantly learning and keeping my mind sharp enough to spot patterns and make quick decisions?
For me trading is like those athlete days. I take supplements to keep my mind sharp and my emotions steady throughout the day. I aim for 5,000 to 10,000 steps daily to stay physically fit. I carefully track my sleep with my Oura ring because getting good rest is critical to trading well.
Trading is a competition you show up to every single day. If you are not in your best shape losing that day is expected. And while even top athletes sometimes lose when they are at their best losing because you were not prepared is something you cannot accept.
Knowing the rules is just as important.
I once played a match where the sun was setting right on my side during the game. The other team had sun visors allowed by the rules. We only had hats but hats were banned. That small difference made a huge impact on the outcome.
Trading has its own rules and invisible players too like the Plunge Protection Team which steps in to prevent market crashes past a certain point. There are many hidden mechanics in the market you have to understand.
For example moving averages are not just about the famous 50 and 200-day crosses. There are many subtle details about how they are calculated and used that most traders miss unless they study deeply.
So honestly ask yourself these questions.
Do I really want to succeed in this market?
Am I willing to put in the time and effort it takes?
Am I treating trading like the serious business it is?
If your answer is yes then start treating yourself like the most important asset in your trading business. Train your body and mind. Learn the rules inside and out. Practice with discipline and consistency.
Success is not going to be easy. But it will be earned.

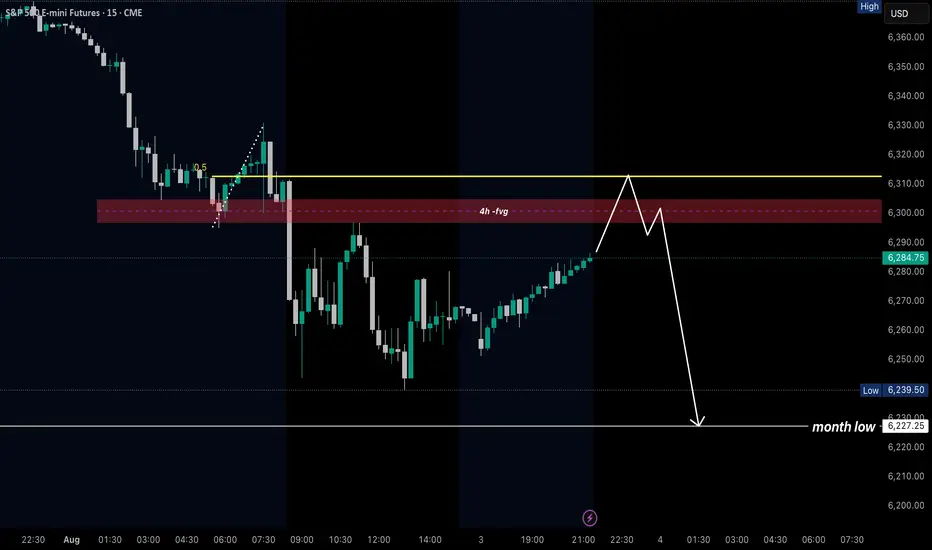
ES bearish sentiment for Monday aug 4thIll be watching for a bearish set up to form around the bearish 4 hr fvg to take out previous month low
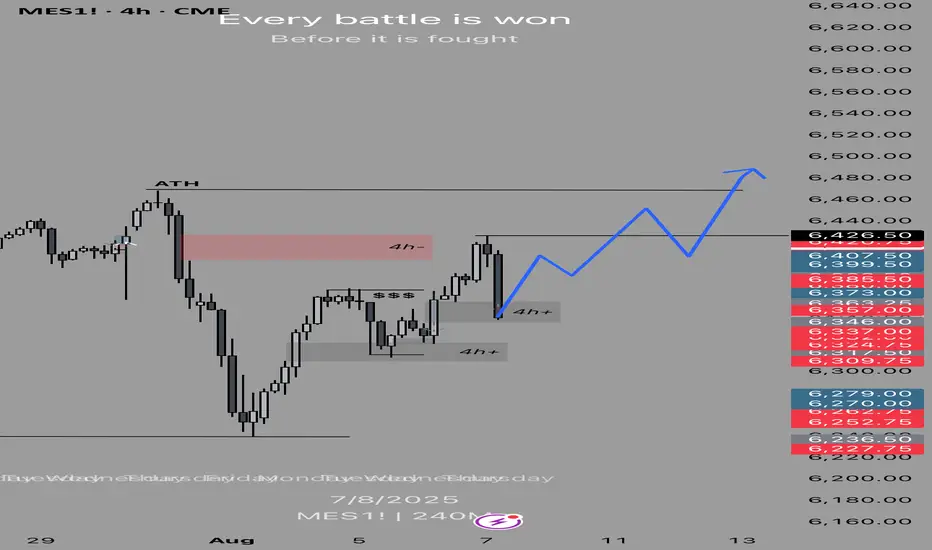
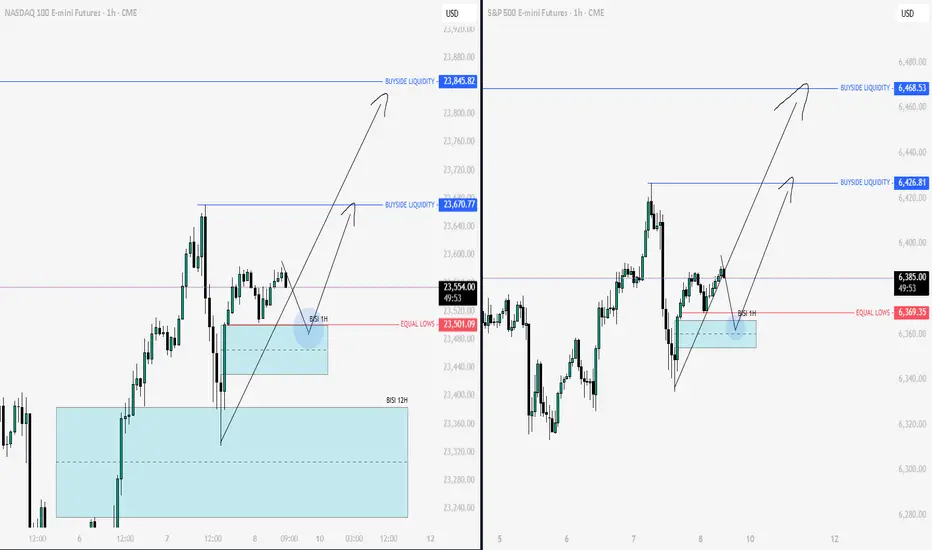
Nq & Es Key Levels & Daily Bias 08-08-2025Today’s bias is once again bullish, aiming for those all-time highs.
When the market opens at 09:30, I’d like to see price dip into discount zones or take out some lows first — that would set up a nice rally upward and a potential long opportunity.
If that doesn’t happen, I’ll stay on the sidelines. No chasing longs in premium territory.
Enjoy the day no matter what happens, and keep learning so you’re sharper tomorrow.
We’ll check back later to see how it played out.
S&P 500 (ES1!): Bullish! Look For Valid Buy Setups!In this video, we will analyze the following FX market for the week of Aug 11 - 15h:
S&P 500 (ES1!)
The S&P 500 rose Friday to close the week strong on a busy week of tariff updates and good earnings.
There is no reason to consider selling.
Wait for pullbacks to FVGs for high probability buys. Look for IRL to ERL, and repeat.
Enjoy!
May profits be upon you.
Leave any questions or comments in the comment section.
I appreciate any feedback from my viewers!
Like and/or subscribe if you want more accurate analysis.
Thank you so much!
Disclaimer:
I do not provide personal investment advice and I am not a qualified licensed investment advisor.
All information found here, including any ideas, opinions, views, predictions, forecasts, commentaries, suggestions, expressed or implied herein, are for informational, entertainment or educational purposes only and should not be construed as personal investment advice. While the information provided is believed to be accurate, it may include errors or inaccuracies.
I will not and cannot be held liable for any actions you take as a result of anything you read here.
Conduct your own due diligence, or consult a licensed financial advisor or broker before making any and all investment decisions. Any investments, trades, speculations, or decisions made on the basis of any information found on this channel, expressed or implied herein, are committed at your own risk, financial or otherwise.

Futures reject at supply, bear flag forming?The market has sold off big time to round out last week and has been chopping around in a recovery for the past few days.
I decided to make a little channel from the bottom to the recent lows and it looks like we broke the bottom of the channel and then managed to get back into it, of course if we can break out above the channel that is hyper-bullish because a ton of shorts will be trapped after the initial break.
On the other hand, a false break on a channel is less likely than a follow-through, so odds would indicate bearish sentiment.
I checked the volume profile of the previous sessions and it looks like supply/demand has acted as a good spot for support and resistance levels. Today we bid right up to the supply level and sold off all the way to the demand level, supply acted as resistance and demand acted as support and we ended roughly in the middle of the two zones.
Overall, it doesn't really tell you much, but the coming days will paint the picture better.
If we can break below 6340 I would expect an attempt at 6250 and possibly lower.
If we can break above 6425 then we can go to new all time highs.
Overall I am leaning slightly bearish, but watching for price action confirmation.

S&P 500: The Underlying Trend Remains BullishLast week, the S&P 500 index entered a consolidation phase amid a packed fundamental calendar. The Fed’s monetary decision, PCE inflation, the NFP report, and trade negotiations all triggered short-term profit-taking. However, this consolidation has remained technically well-structured, with key supports intact, and the broader trend remains bullish.
Let’s conduct a technical assessment as this week unfolds under geopolitical pressure, with the Friday, August 8 ultimatum set for Russia.
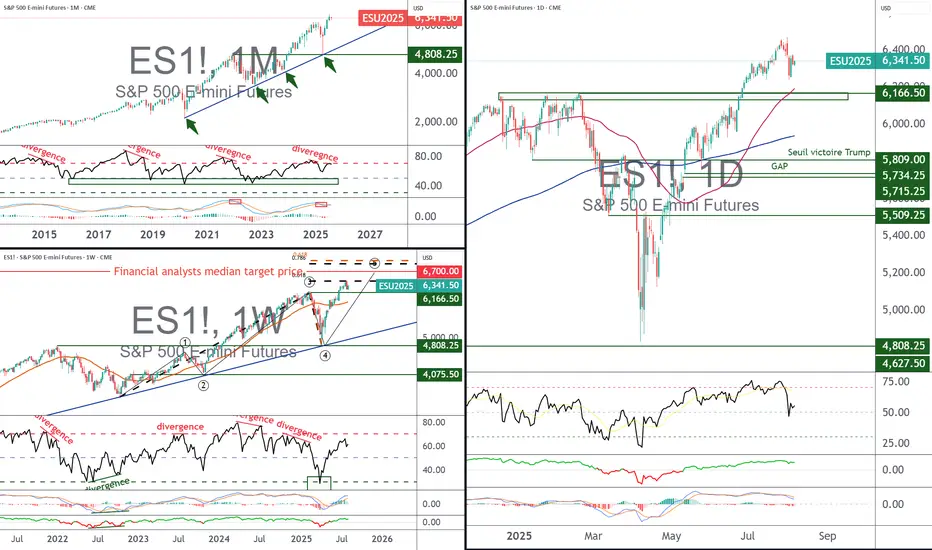
1. The underlying trend in the S&P 500 remains bullish above the major support at 6050/6150 points
Let’s first examine the different timeframes for the S&P 500 futures contract. The triptych below shows monthly, weekly, and daily candlesticks. All three timeframes send the same message: the underlying trend in the S&P 500 remains bullish as long as the major support at 6050/6150 points holds on a weekly closing basis. This support zone corresponds to the former all-time high from last winter. In the short term, a retest of the support cannot be ruled out before the trend resumes.
2. Quantitative analysis does not show an overbought situation, with the percentage of stocks above the 50-day moving average still below extreme levels
Last week’s consolidation helped deflate a potential overbought condition. The percentage of S&P 500 stocks trading above their 50-day moving average was approaching an overbought zone, but is now back to 50%, giving the index renewed capacity to resume its bullish trend.
3. The Dow Jones is in an accumulation phase below its all-time high
The Dow Jones also shows a promising technical setup, potentially forming a bullish continuation inverse head-and-shoulders pattern. A breakout above the 45,000-point resistance is needed to confirm this signal. The equal-weighted S&P 500 index shows a similar technical structure.
4. Retail investor sentiment is still far from euphoric extremes
Market tops are always built in euphoria, especially among retail traders. According to the latest data from the American Association of Individual Investors (AAII), buying interest has increased and is slightly above the historical average, but still far from its typical overheating zone. This sentiment indicator confirms that the underlying trend in the S&P 500 remains bullish above the 6050/6150-point support (based on S&P 500 futures).
DISCLAIMER:
This content is intended for individuals who are familiar with financial markets and instruments and is for information purposes only. The presented idea (including market commentary, market data and observations) is not a work product of any research department of Swissquote or its affiliates. This material is intended to highlight market action and does not constitute investment, legal or tax advice. If you are a retail investor or lack experience in trading complex financial products, it is advisable to seek professional advice from licensed advisor before making any financial decisions.
This content is not intended to manipulate the market or encourage any specific financial behavior.
Swissquote makes no representation or warranty as to the quality, completeness, accuracy, comprehensiveness or non-infringement of such content. The views expressed are those of the consultant and are provided for educational purposes only. Any information provided relating to a product or market should not be construed as recommending an investment strategy or transaction. Past performance is not a guarantee of future results.
Swissquote and its employees and representatives shall in no event be held liable for any damages or losses arising directly or indirectly from decisions made on the basis of this content.
The use of any third-party brands or trademarks is for information only and does not imply endorsement by Swissquote, or that the trademark owner has authorised Swissquote to promote its products or services.
Swissquote is the marketing brand for the activities of Swissquote Bank Ltd (Switzerland) regulated by FINMA, Swissquote Capital Markets Limited regulated by CySEC (Cyprus), Swissquote Bank Europe SA (Luxembourg) regulated by the CSSF, Swissquote Ltd (UK) regulated by the FCA, Swissquote Financial Services (Malta) Ltd regulated by the Malta Financial Services Authority, Swissquote MEA Ltd. (UAE) regulated by the Dubai Financial Services Authority, Swissquote Pte Ltd (Singapore) regulated by the Monetary Authority of Singapore, Swissquote Asia Limited (Hong Kong) licensed by the Hong Kong Securities and Futures Commission (SFC) and Swissquote South Africa (Pty) Ltd supervised by the FSCA.
Products and services of Swissquote are only intended for those permitted to receive them under local law.
All investments carry a degree of risk. The risk of loss in trading or holding financial instruments can be substantial. The value of financial instruments, including but not limited to stocks, bonds, cryptocurrencies, and other assets, can fluctuate both upwards and downwards. There is a significant risk of financial loss when buying, selling, holding, staking, or investing in these instruments. SQBE makes no recommendations regarding any specific investment, transaction, or the use of any particular investment strategy.
CFDs are complex instruments and come with a high risk of losing money rapidly due to leverage. The vast majority of retail client accounts suffer capital losses when trading in CFDs. You should consider whether you understand how CFDs work and whether you can afford to take the high risk of losing your money.
Digital Assets are unregulated in most countries and consumer protection rules may not apply. As highly volatile speculative investments, Digital Assets are not suitable for investors without a high-risk tolerance. Make sure you understand each Digital Asset before you trade.
Cryptocurrencies are not considered legal tender in some jurisdictions and are subject to regulatory uncertainties.
The use of Internet-based systems can involve high risks, including, but not limited to, fraud, cyber-attacks, network and communication failures, as well as identity theft and phishing attacks related to crypto-assets.
ES - August 5th, 2025 - Daily Trading Plan7:45am EST - Overnight Session Update -
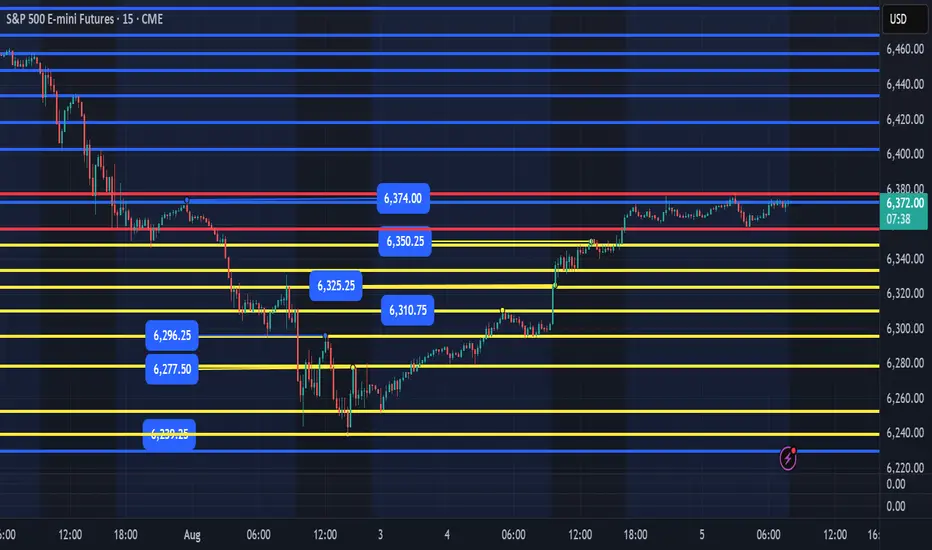
Yesterday we reached our main targets of 6325, 6350, 6375. Overnight we have been consolidating in a tight range between 6358-6378. We could get one good flush and recover of 6358 and we can long to 6378, 6400. If we breakout of 6375, we should continue higher to 6400, 6420+. I also would be careful as price has been in a narrow range, we could get a fake breakout above 6375. IF, price breaks out and then returns back inside the 6375 range, we can expect price to sell off and potentially pullback to retest the levels below. I hate trading a new position when price is at the high of the breakout and high of the session. I would rather wait to get a flush of 6358 and recover to long or flush much further down to the 6297 area and flush and recover would be even better.
I will update closer to 9:30am EST. My lean is to wait for a flush of 6358 and recover to long back to 6378, 6400.
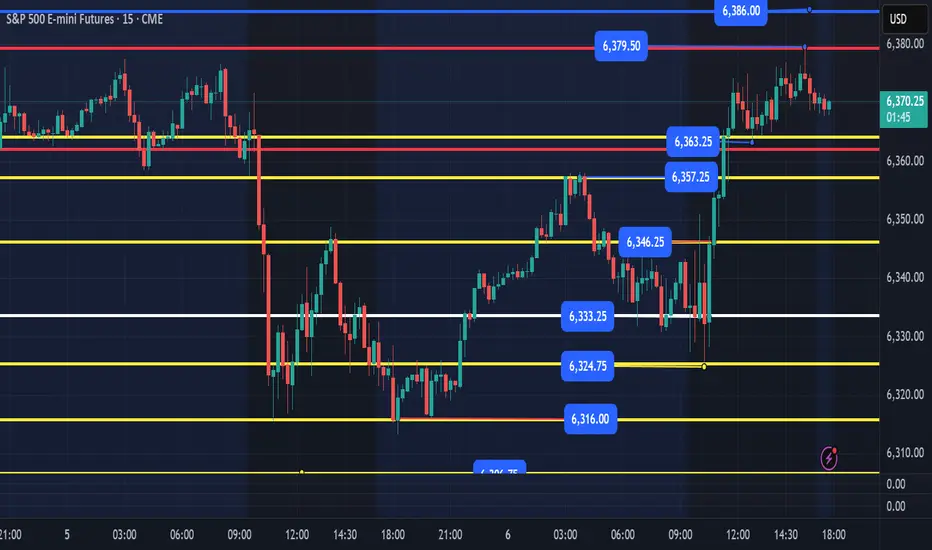
ES - August 8th - Daily Trading PlanThe session open of 6370 held this level overnight and we had a shallow failed breakdown around 1:45am at 6368 and rallied back up to the overnight highs. We are trading in a tight 20 pt range overnight and currently we are testing the 6391 level.
6391 is the 0.618 retracement of the 6426 high to 6333 low from yesterday session. We could stall and move back down the levels once reached or continue higher. IF, we continue higher, we should be able to continue up to test 6400, 6410, 6426. If we reject the 6391 level, we will need to come back down and need to hold the 6370 session open level or we will possibly continue to look for support at 6344, 6333, 6324. 6315. Below these levels and we will be looking to the 6297, 6280, 6252, 6240.
Personally, 6315 is probably the better next level down for a decent move. We could easily have a session like yesterday where no follow through happened until the 6333 level. Since it was tested yesterday, you would want to see a flush to 6324 or 6315 and reclaim of the levels above the bounce to long for a level-to-level move.
My plan is looking for a rejection of the 6391-95 range and see us pullback and retest the overnight low. This has been tested already and may not produce much support. You will need to see how price is acting as it nears.
You can see my post last night in the related publications section as to the levels I outlined and how that played out. "Price needs to hold 6365 with 6355 at lowest or we will most likely go back down and retest the 6344 & 6333 levels which have been a magnet this week." 6368 was the overnight low and we rallied from this level. We might get one more bounce but could fizzle out quickly.
I will post an update around 10am once the NYSE opens and we can see how price acts in the first 30 mins.

ES : Short levelThe level has been activated, so you can short it. I have slightly edited it since last time. It is best to scalp or pip it; I cannot promise any significant movement. Be careful when trading on news or at market close/open.
ES - August 6th Evening Open / August 7th Daily Trading PlanWe held the 6324 level today and institutional buyers stepped in at this level and we rallied to our targets for the day. We currently have our first support down at 6363 level and an ultra-bull case for tomorrow is to build a flag and break out above 6380 with targets of 6386, 6402+
Ideally, we would pull back overnight and flush 6344, 6323 or the 6315 level and reclaim for a nice move up the levels. Either way, trend is still up, and short-term bulls need to hold 6315 level, or we will probably retest the levels below at 6297, 6280, 6252 and then the Friday's low of 6240.
I will update my August 7th trading plan tomorrow am as we need to see what price does in the evening session. My lean is we don't lose 6344, but any flush and recovery of levels outlined we should continue up higher.
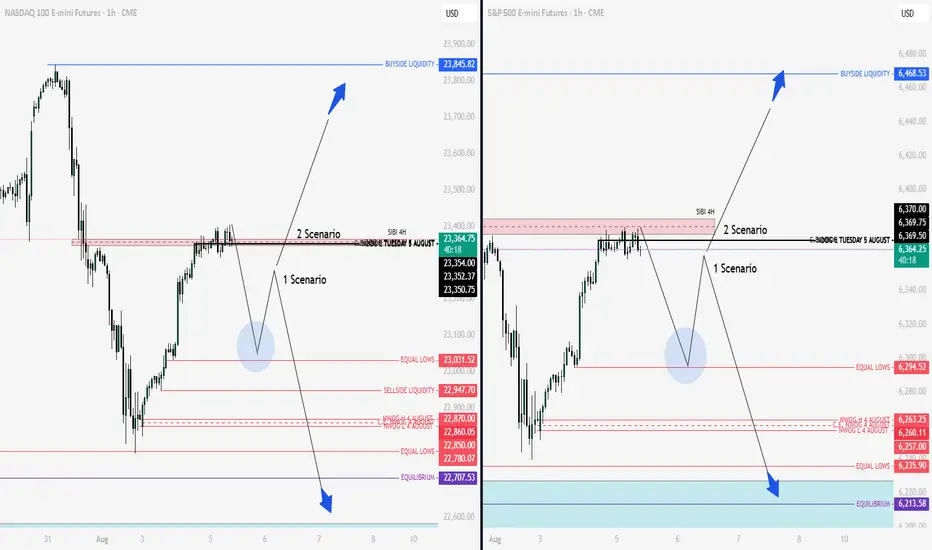
Nq & Es Key Levels and Scenarios 05-08-2025 We are currently positioned in a premium zone. This suggests that the price is likely to seek lower levels within discount areas. Therefore, upon the market opening, it will be crucial to observe price action in light of the increased volatility expected to enter the market.
The prevailing bias is that prices are likely to decline toward the predefined zones indicated on the chart. Depending on how price reacts at these key levels, we will be able to assess whether the downward movement will continue or if significant support will emerge, potentially leading to a full reversal to the upside.
In summary, there may be initial shorting opportunities, followed by potential long setups depending on the market’s reaction. Two scenarios have been outlined.
Wishing you all successful and well-considered trades.
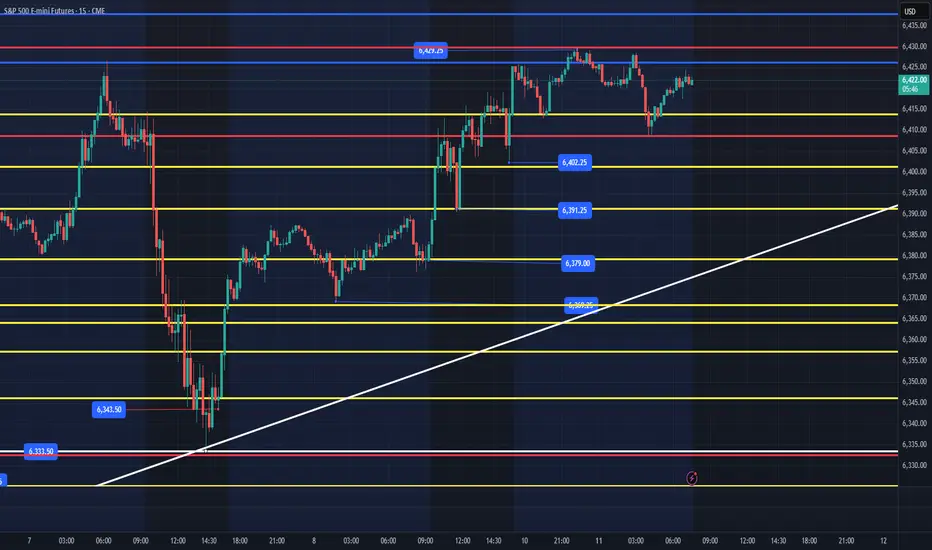
ES - August 11th - Daily Trade Plan7:30am EST - August 11th
I have posted my weekly trade plan that is available to read in the related publication section of this week daily plan posts.
I still believe that price can keep moving higher to my weekly targets of 6452, 6482. We have some economic numbers being released and its OPEX.
In the overnight session price dropped down to 6413 and bounced to 6430. When we came back down price was bought back up around 6408 and we put in a nice reclaim of the overnight low session level and rallied to 6425 around 7am.
I am looking for price to flush the 6402 level (possible 6397-99) and reclaim that level for a good 10pt+ move. I have marked the levels in yellow that I will be watching for a nice reaction to grab some points today. (6402, 6391, 6379) are the main levels I want to look for price to flush and reclaim. IF, price does break out before a pull back this am. You can look for a back test of the 6430 level as a potential entry on strength.
I will post more of an update around 10am once the NYSE opens and we see what price is trying to do in the first 30 mins.
After the morning forecast 07-08-2025As we saw, it finally happened, the price dropped, giving us shorting opportunities and now we probably have to look for Longs... tomorrow we'll meet here at 09:00 Am NY Time.

Day 4 — Trading Only S&P Futures — +$207, Patience Pays OffWelcome to Day 4 of Trading Only S&P Futures!
After two tough losing days, I took a morning yoga session to clear my mind and approach the market calmly. I started trading late but found a strong A+ setup near 6355, aligned with a major gamma zone and RSI signals, which led to a $200+ profit.
📈 What you’ll learn
The importance of mindset and mental clarity in trading
How to identify strong setups using market structure and gamma zones
Reading RSI on multiple timeframes for confirmation
Managing risk and knowing when to call it a day
⏰ Timestamps
0:00 — Intro & Day 4 Overview
0:30 — Mindset Reset & Trade Recap
1:30 — VX Algo Signal Recap & Setup Breakdown
3:00 — Market News & Impact
3:30 — Key Levels for Tomorrow
4:00 — Closing Thoughts & Next Steps
🔔 VX Algo Signals (9:30am – 2pm EST)
9:39 AM Market Structure flipped bullish on VX Algo X3!
11:20 AM VXAlgo ES X1 Buy signal (triple buy)
11:52 AM VXAlgo ES X1 Buy signal
12:40 PM VXAlgo ES X1 Sell signal
📰 News Highlights
U.S. jobless claims rose to 226,000 vs. estimate 221,000, signaling increased layoffs.
🔑 Key Levels for Tomorrow
Above 6332 = Remain Bullish
Below 6315 = Bearish

Nq & Es Key Levels 04-08-2025 After MarketClosing exactly at the level I gave this morning...Incredible Accuracy...Just see the previous post to understand

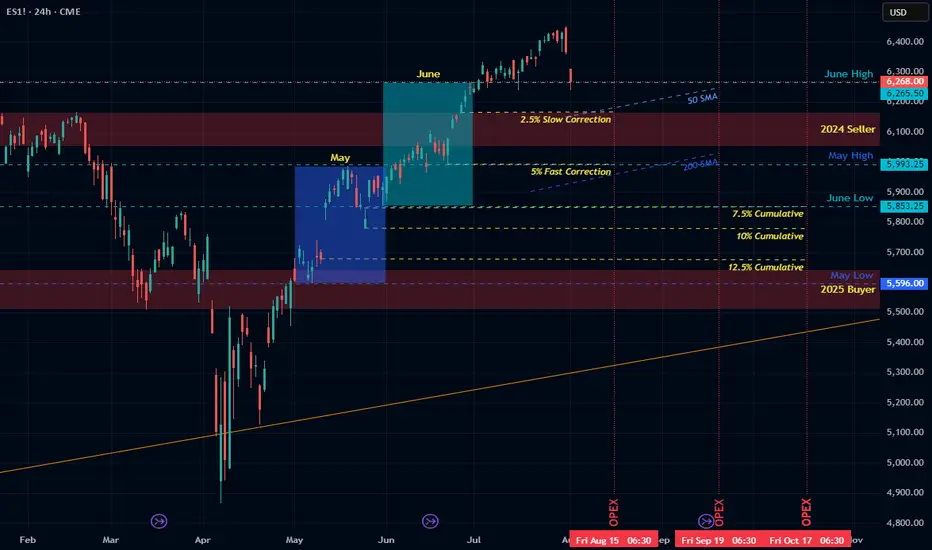
Path into Q3Outlook for the Next Few Months
• Now–August OpEx: -2.5% to -5% slow correction
• August–September OpEx: potential 5–7.5% additional decline
• By late Q3: cumulative 10–12.5% drawdown (target S&P ~5700).
• October: possible bounce — or acceleration if data worsens
• End of Year: risk of deep drop à la Oct–Dec 2018 if trends continue
Macro Backdrop
• Watch for margin compression, CPI surprise, and unemployment uptick
• Private data shows more fragility than government numbers
• QRA-driven liquidity tightening may amplify downside risk
Political Timing and Fed Policy
• Administration may welcome controlled decline to enable early 2026 rate cuts
• If market doesn’t decline soon, blow-off top/melt-up into midterms possible