I Made $977 Trading S&P Futures | Day 67 Market BreakdownI made $977 today trading S&P Futures, catching both sides of the move — shorting early weakness, then flipping long after a confirmed bullish structure shift.
The VX Algo signals lined up perfectly with the government shutdown resolution, giving clear reads on momentum reversals. Patience, structure, and signal confirmation were key today.
Above 6830 stays bullish, below 6807 turns bearish.
Watch for structure continuation into midweek.
Trade ideas

ES (SPX, SPY) Analysis, Levels, Setups for Wed (Nov 12)Price closed near the prior week’s highs after a clear four-hour impulsive leg from last Friday’s low. Momentum appears constructive while the 15-minute swing structure holds higher lows above the New York value shelf.
Setups:
Play A — Acceptance Long: Wait for a 15m full-body close ≥6,900 and a 5m pullback that holds ≥6,892–6,895. Enter on a 1m HL reclaim. Hard SL = 15m trigger-wick low minus 0.25–0.50. TP1 6,915. TP2 6,935. TP3 6,955–6,975. Viability gate: TP1 must be ≥2.0R versus the 15m stop.
Play B — Rejection Fade: If 6,900–6,915 rejects with a 15m close back inside ≤6,889, enter on a 5m re-close lower and a 1m LH. Hard SL = 6,905–6,912 (above rejection wick). TP1 6,872. TP2 6,852. TP3 6,839→6,810 if momentum accelerates.
Bias & Invalidation: Bias is mildly bullish while 6,865–6,872 holds on 15m closes. Bias flips neutral-to-bearish on decisive 15m body-through below 6,839.
Kill-Zones (ET): NY AM 09:30–11:00 for entries. Manage through Lunch. NY PM 13:30–16:00 for follow-through or fades into exhaustion.
News & Events (tomorrow): No CPI risk on the docket. Watch the U.S. 10-Year Note auction around 13:00 ET and headline risk from the OPEC and IEA monthly oil reports in the morning; both can sway rates and index tone.

A shift away from tech stocksThe price action in the daily chart of the S&P 500 implies a potential shift away from tech stocks. Capital is still in the stock sector the structure implies this potential capital shift.

ETF ScannerGabriel’s ETF — Institutional Performance & Efficiency Screener
Description:
Gabriel’s ETF screener isolates high-efficiency, institutional-grade exchange-traded funds (ETFs) that combine superior long-term performance with low structural drag.
It’s designed to uncover funds that outperform peers through strong 5-year returns, consistent NAV growth, low expense ratios, and disciplined yield management — essentially finding the “alpha carriers” of the ETF world.
This screener serves as both a portfolio foundation builder and a benchmark comparison tool for systematic investors, portfolio managers, and capital allocators.
Scanner: www.tradingview.com
⚙️ Interpretation: Strategy Intent
The set is effectively constructing a “Quality Growth + Liquidity + Efficiency” model, targeting:
Consistent long-term compounding (≥ 30 % 5Y Perf)
Healthy recent trend (≥ 10 % 1Y NAV Return)
Low-cost structure (≤ 0.4 %)
Institutional-grade liquidity (≥ 2 B AUM + ≥ 900 M USD volume)
Dividend reliability (≥ 0.45 %)
Moderate volatility (ADR < 1.55 %)
This combination favors stable, mega-cap ETFs suitable for core allocation portfolios or All-Weather ETF models.
📊 Expected Results
With these filters, your screener will likely highlight ETFs such as:
SPY / VOO / IVV – Core S&P 500 index trackers with large AUM, strong 5-year performance, low fees.
QQQ / VGT / XLK – Tech-heavy growth ETFs with > 30 % 5-year gains.
SCHD / VYM / HDV – Dividend-weighted funds meeting your minimum yield and efficiency filter.
XLF / XLI / XLE / XLV / XLK – Sector ETFs with institutional liquidity.
IWF / IWD / RSP – Style-based or equal-weight funds passing both momentum and liquidity screens.

S&P500 ON IT'S WAY TO TEST ALL TIME HIGH!Hey Traders so we are back in action checking out the Stock Indexes again.
From now on my main focus will only be the indexes I feel they are the best markets to trade for trend followers like me. Although I may occasionally make a post about other markets the indexes are my main area of study so with that being said lets dive in!
So Govt Shutdown? Seasonally Strength? Inflation Fears? Interest Rates Cuts/Hikes?
I say if you read all the headlines you will find your self in a whirlwind of ideas of how you could trade this market. But imo forget the headlines and go to what we can trust in my opinion is the charts!
For me I believe trade what I see not what we think, not what we hear, only focus on what we see the charts always have been and always will be at least for me the best guide on how to sail these uncharted waters so what do we actually see?
Well I se a strong uprtrend in place since April and I also see the market has rejected the 6690 level 3 times that tells me without any indicators needed what so ever that the market does not want to move lower than that level for now.
Support and Resistance is all you need imo to see whats happening every trading day tells a story follow the story and you will hopefully get on the right side of the market.
So therefore scenarios for today are...
Bullish- this is market is a buy imo on a pullback to the trendline around 6813. Try to put a stop somewhere out of harms way but give the market breathing room around 6760 ish looks safe. Also November seasonally is a strong month normally for stocks. If the Shutdown ends the market could celebrate and the move could be epic!
Bearish- stay in hibernation for the winter. 😁
No seriously the odds and the probabilites are really against the bears here. I would wait for January where normally market Seasonally weakens till march. Watch for maybe a top or break below support and a break below the trendline on a daily close to be sure. Then consider selling a rally.
Commitment of Traders- no report at this time due to govnt shutdown.
Good Luck & Always use Risk Management!
(Just in we are wrong in our analysis most experts recommend never to risk more than 2% of your account equity on any given trade.)
Hope This Helps Your Trading 😃
Clifford
RISK DISCLOSURE
TRADING IN THE FUTURES AND FOREX MARKET INVOLVES SIGNIFICANT RISK. ALWAYS CONSULT A FINANCIAL ADVISOR AS HIGH RISK ASSET CLASSES MAY NOT BE SUITABLE FOR ALL INVESTORS. THIS IS NOT A RECOMMENDATION TO BUY OR SELL ANY ASSETS. ALL IDEAS ARE MADE FOR EDUCATIONAL PURPOSES. PAST PERFORMANCE DOES NOT GUARANTEE FUTURE RESULTS.
CFTC RULE 4.41 – HYPOTHETICAL OR SIMULATED PERFORMANCE RESULTS HAVE CERTAIN LIMITATIONS. UNLIKE AN ACTUAL PERFORMANCE RECORD, SIMULATED RESULTS DO NOT REPRESENT ACTUAL TRADING.

ES - November 11th - Daily Trade PlanNovember 11th- Daily Trade Plan - 8:45am
*Before reading this trade plan, IF, you did not read yesterdays, or the Weekly Trade Plan take the time to read it first! (You can see both posts in the related publication section) *
If my posts provide quality information that has helped you with your trading journey. Feel free to boost it for others to find and learn, also!
My daily trade plan and real-time notes that I post are intended for myself to easily be able to go back and review my plan and how I did from an execution perspective.
--------------------------------------------------------------------------------------------------------
I was off my desk yesterday and I am now catching up for this week.
Overnight Low is 6836 and the Overnight High is 6867. We have been moving sideways since 1pm yesterday in this range and we must respect the short-term trend that is bullish. We still have the 6765-level gap that needs to be filled at some point. We have CPI & PPI this week, so I do expect some volatility.
Key Levels Today -
1. Loss of 6836 and reclaim
2. Loss of 6796 and reclaim
3. Loss of 6772 and reclaim (possibly as low as 6765 to close the gap)
4. Loss of 6743 and reclaim (possibly down to 6731)
Below those areas and we will most likely need to retest 6654. Price needs to clear 6878 to continue higher and change the macro trend.
Key Support Levels - 6836, 6824, 6809, 6796, 6772, 6765, 6753, 6743, 6731, 6710, 6695
Key Resistance Levels - 6854, 6867, 6885, 6893, 6908
We are in a tricky spot as you have short term resistance at 6847 then 6854 and 6867. Ideally, we can lose 6836 down to 6824, 6809 and then reclaim those levels to move higher.
I will post an update around 10am EST
----------------------------------------------------------------------------------------------------------------
Couple of things about how I color code my levels.
1. Purple shows the weekly Low
2. Red shows the current overnight session High/Low (time of post)
3. Blue shows the previous day's session Low (also other previous day's lows)
4. Yellow Levels are levels that show support and resistance levels of interest.
5. White Levels are previous days session High/Low

Greedy Short Gone Wrong | Day 66 Trading S&P FuturesI started the day strong, shorting the 6830 resistance level for quick profits — but got greedy and went for more at 6852, thinking the market couldn’t push higher.
It did. I got squeezed, gave back all my gains, and ended the day basically flat.
Some days remind you: the market doesn’t owe you anything.
VX Algo had 4 out of 5 clean signals today — structure nailed the direction early.
Tomorrow’s levels: Above 6810 bullish, below 6780 bearish.

Follow through to the upside is expectedFollow through to the upside is expected for the daily chart of the S&P 500. The next objective to the upside 6885.

Do you get Deja vu?Some say that history is repeating itself according to the dot-com bubble and the nifty fifty crash that led to a dark period in the US market. Why are we scared that the same situation will happen again? For starters, The Mag 7 who is consisted of the seven biggest company of the S&P 500 have a combined market cap of 22 trillion, which mean around 35-37% of the whole index… In fact, the same thing happened before the dot-com crash and the nifty fifty catastrophe. They were traded 40 times their valuations, so the price-to-earning ratio wasn’t considered healthy. Plus the biggest companies in the Nifty fifty composed of around 25% of the entire S&P.
But… The dot-com crash was a lot due to many start up being invested in and not giving the merchandise they should’ve, leading to many bankruptcy. The Nifty fifty was composed of businesses that people thought were untouchable, like McDonald’s, Coca-Cola, Polaroid, Disney and more. A bunch of people invested blindly in those businesses thinking they’ll just never stop growing… but those company could not innovate anymore. So once they showed lower than expected gains months after months they couldn't do anything else than watch people leaving with the pedal to the metal which led to atrocious losses.
Now, do we have the same pattern? It is true that the Mag7 is taking a huge chunk of the S&P, as they should, but can we anticipate a sell off?
If you analyze the facts; Businesses invest billions day after day into AI companies who can boost their platform and propel them in front of the innovation race. We can’t stop being amazed by every giant step they take in AI automatization and in the progress of the LLMs. Months after months those companies innovate and give back to their investor an excellent ROI. They expand and try to see what’s gonna be the next best thing and come out on top. Tech is not the same as those nifty fifty and dot com businesses who were over traded (which is a misconception, cause the Mag7 is also “over traded” but it is just a indicator of high liquidity and investor interest not necessarily an imbalance in their whole market value.) But i still mention it cause it is a an argument many people employ.
So ask yourself: is what’s happening with AI the same as the nifty fifty or the dot-com bubble, or did AI just took the S&P, those Mag7 companies or should i just say the world to an other level?
I guess only time will tell, till then,
Your friendly day trader,
Esteban.

ES (SPX, SPY) Analysis, Key Levels, Setups for (Nov 11th)S (Dec) Plan for Tue, Nov 11 — Level-KZ Protocol (15/5/1).
Bias is constructive while trading above the 6,838–6,845 range; the first test into 6,880–6,900 serves as a decision point. Thinner liquidity is expected around the U.S. holiday, so execute trades only within NY kill zones.
Setups (trade the level → next level; 15m→5m→1m sequence)
Long — Bounce at 6,838–6,845: sweep/quick-reclaim → 5m re-close → 1m HL entry. Hard SL below 6,830 wick. TP1 6,872–6,880, TP2 6,900, TP3 6,930. Viability gate: TP1 ≥ 2.0R.
Long — Acceptance above 6,900: full 15m body close >6,900 → hold the retest → 1m HL. SL below trigger wick. TP1 6,930, TP2 6,955–6,970, runner eyes weak-high cleanup.
Short — Rejection fade 6,900–6,930: wick through → 15m close back below 6,895 → 5m LH. SL above session high. TP1 6,872, TP2 6,845, TP3 6,805; lose 6,805 and momentum can slide toward 6,770 then 6,733.
News & session conditions (ET)
U.S. Veterans Day — equities open; U.S. bond market closed; U.S. macro slate is light. Overnight focus: NZ inflation expectations (evening ET), U.K. Labour Market (pre-London), Germany ZEW (pre-NY). Expect patchy liquidity around the holiday; be strict with the 2R viability gate and trade only inside NY AM/PM kill-zones.

S&P 500 (ES1!): Is This The Dip We Were Waiting For? Yes!Welcome back to the Weekly Forex Forecast or the week of Nov. 10-14th.
In this video, we will analyze the following FX market: S&P 500 (ES1!)
The S&P500 is respecting the Weekly +FVG... barely! Friday's rally may indicate the pullback is over and the resumption of the bullish momentum is upon us.
Look for valid buy setups only! Sells are not valid unless there is a bearish break of structure!
Enjoy!
May profits be upon you.
Leave any questions or comments in the comment section.
I appreciate any feedback from my viewers!
Like and/or subscribe if you want more accurate analysis.
Thank you so much.
Disclaimer:
I do not provide personal investment advice and I am not a qualified licensed investment advisor.
All information found here, including any ideas, opinions, views, predictions, forecasts, commentaries, suggestions, expressed or implied herein, are for informational, entertainment or educational purposes only and should not be construed as personal investment advice. While the information provided is believed to be accurate, it may include errors or inaccuracies.
I will not and cannot be held liable for any actions you take as a result of anything you read here.
Conduct your own due diligence, or consult a licensed financial advisor or broker before making any and all investment decisions. Any investments, trades, speculations, or decisions made on the basis of any information found on this channel, expressed or implied herein, are committed at your own risk, financial or otherwise.

ES UpdateTrying to break through the resistance line, not sure what's gonna happen tonight.
Open gap always makes me bearish, so I did not go long again after I dumped my calls on open. Just waiting for MFI to get overbought so I can buy puts. Guessing that will happen by Wed open.
Not sure why foreign markets gapped up because of the shutdown ending, and the market didn't tank because of the shutdown so there's really no reason for it to rally now that it's ending..... so I'm expecting a pump and dump.
Sorry, no arrows today.

ES1 technical trade ideas for this week11/10/25-ES1 technical trade ideas for this week11/10/25
well be looking forward to a short pull back in the 6900-6920 range has a high selling pressure in those lv

Long ESLong ES, try to time the entry and you should get a good RR.
Also cut your position in half if the price touches the blue line.
If you have a spesific request about certain instrument that you want me to analyize, just let me know.
Goodluck everyone!!

S&P500/ES Intraday Trade Idea VideoThoday I see a potential trade setting up in the S&P500 Futures.
My overall thesis is to the upside, so no Shorts today. Unless we come up to the first resistance level, or even beter, the 1/4 line. From there I'll be willing to risk some of my money.
Long option 2:
From the CIB or Centerline, after a pullback to these lower levels.
Happy Monday all §8-)

Investing in the World Market (Global Investing)🌍 1. What Is the World Market?
The world market refers to all financial markets across the globe where people trade assets such as stocks, bonds, currencies, commodities, and real estate. When you invest globally, you are participating in this large network of financial activities happening in different regions and time zones.
It includes:
Developed markets like the U.S., U.K., Japan, Germany, and France.
Emerging markets like India, Brazil, China, and Indonesia.
Frontier markets, which are smaller and less developed, like Vietnam or Nigeria.
Each region has its own economic drivers, growth opportunities, and risks. Together, they form the world market.
💡 2. Why Invest in the World Market?
Here are the main reasons why global investing makes sense:
a. Diversification of Risk
When you invest only in your home country, your money depends heavily on one economy. But global investing spreads your risk across multiple countries.
If one market underperforms—say, the Indian market slows down—the U.S. or Japanese markets might still perform well, balancing your returns.
b. Access to Global Growth
Different parts of the world lead in different industries.
For example:
The U.S. dominates technology (Apple, Microsoft, Google).
Europe leads in luxury goods (LVMH, Ferrari).
Asia excels in manufacturing and electronics (Samsung, TSMC).
By investing globally, you gain exposure to all these growth stories.
c. Currency Advantage
If your home currency weakens compared to others, your foreign investments may gain in value when converted back. For instance, if you invest in U.S. stocks and the U.S. dollar strengthens, your returns increase when converted to Indian rupees.
d. Inflation Hedge
Global assets, especially commodities or foreign real estate, can protect against inflation. When local inflation rises, global investments may provide a cushion.
🏗️ 3. How to Start Investing in the World Market
Here’s a step-by-step guide that’s easy to follow:
Step 1: Understand Your Goals and Risk
Decide why you want to invest globally.
Are you seeking growth opportunities abroad?
Do you want to hedge against domestic risks?
Or do you just want to diversify your portfolio?
Your goal determines where and how much you should invest. For example, a conservative investor may prefer global mutual funds or ETFs, while an aggressive investor might buy foreign stocks directly.
Step 2: Choose the Right Route
There are several ways to invest globally:
Global Mutual Funds:
These are mutual funds in your country that invest in international markets. You don’t need a foreign trading account. Examples include funds focused on U.S. technology or global healthcare sectors.
Exchange-Traded Funds (ETFs):
ETFs are like mutual funds but trade on stock exchanges. You can buy global ETFs that track indexes like:
S&P 500 (U.S.)
MSCI World Index (global developed markets)
MSCI Emerging Markets Index
Direct International Stocks:
You can buy shares of global companies such as Apple, Google, or Toyota through platforms that allow cross-border trading.
Foreign Index Funds:
These funds track international indexes. They’re low-cost and simple for beginners.
Alternative Assets:
You can even invest globally in commodities (like gold, oil), real estate, or startups through specialized funds.
Step 3: Understand Costs
Global investing involves certain costs, such as:
Currency conversion fees
Brokerage charges
Tax implications
Expense ratios in global funds
Before investing, compare these costs to your potential returns.
Step 4: Learn About Tax Rules
Different countries have different tax laws. For instance, U.S. dividends are taxed for foreign investors, and you might need to declare them in your home country too. Always check Double Taxation Avoidance Agreements (DTAA) to avoid paying tax twice.
Step 5: Stay Updated
Global markets react to different economic events—like U.S. Federal Reserve rate changes, European inflation, or China’s manufacturing output.
Keep track of global trends, news, and currency movements that can impact your portfolio.
📊 4. Examples of Global Investment Options
Here are some easy examples to understand where people commonly invest globally:
Investment Type Example Region Focus
U.S. Stocks Apple, Microsoft, Amazon USA Tech innovation
European Stocks Nestlé, BMW, LVMH Europe Consumer goods & luxury
Asian Stocks Samsung, Toyota, TSMC Asia Manufacturing & electronics
ETFs S&P 500 ETF, MSCI World ETF Global Broad diversification
Global Mutual Funds Franklin Global Equity Fund Global Mixed assets
🌐 5. Understanding Global Market Risks
Just like domestic investing, global investing has risks. Here are key ones to know:
a. Currency Risk
When foreign exchange rates move against you, returns can drop. For instance, if the dollar weakens after you invest in U.S. stocks, your profits may reduce in your home currency.
b. Political and Economic Risk
Every country faces unique challenges—like wars, elections, policy changes, or recessions—that can affect its market.
c. Liquidity Risk
Some foreign markets may not have as many buyers and sellers, making it harder to sell your investments quickly.
d. Regulatory Differences
Different countries have different rules and reporting standards, which may affect transparency.
📈 6. Strategies for Success in Global Investing
Here are a few simple strategies that can help:
1. Start Small
You don’t need to move all your money abroad. Start with 10–20% of your total portfolio in global assets.
2. Diversify Across Regions
Avoid putting everything into one country. Instead, mix developed markets (like the U.S.) with emerging markets (like India or Brazil).
3. Use Global Index Funds
If you’re unsure which countries or stocks to pick, use broad index funds that automatically diversify your investments.
4. Focus on Long-Term Growth
Global investments might fluctuate in the short term but tend to deliver solid returns over time. Patience is key.
5. Rebalance Regularly
Revisit your portfolio every 6–12 months. Adjust if one region becomes overweight or underperforming.
🌎 7. The Future of Global Investing
Global investing is becoming easier and more digital. With the rise of fintech platforms, fractional investing, and ETFs, even small investors can own global assets.
Emerging themes include:
Sustainable investing (ESG) – investing in companies with environmental and social responsibility.
Artificial Intelligence (AI) and Tech – global funds focusing on innovation.
Renewable Energy – a growing global sector as the world moves toward clean energy.
Healthcare and Biotech – driven by aging populations and new medical breakthroughs.
As economies become more connected, global investing will no longer be an “option”—it’ll be a necessity for building wealth.
💬 Final Thoughts
Investing in the world market opens doors to immense opportunities beyond your borders. It allows you to benefit from global innovation, economic growth, and diversification. But it also requires understanding of currency risks, market differences, and long-term patience.
Start small, choose the right instruments, and gradually expand your exposure. With a disciplined and informed approach, global investing can transform your portfolio into a balanced, future-ready powerhouse that grows with the world economy.
In short — think global, invest wisely, and stay patient. 🌍💰
ES1This Pair has given us enough clues in the past to take trades based on Technicals , i am not prdicting the future but hope this will be a guide line for me to follow as Price continues it's path

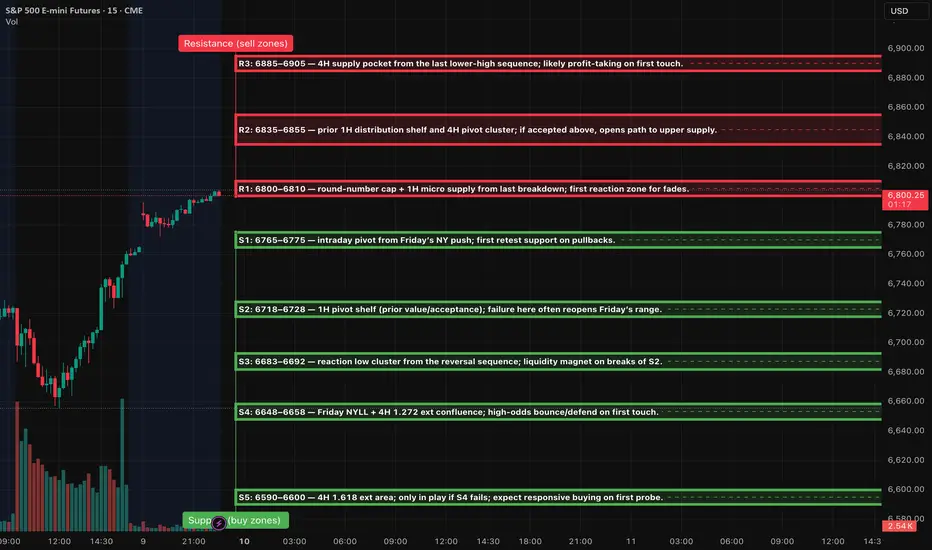
ES (SPX, SPY) Week Ahead Analysis, Levels (Nov 10th - 14th)Context (HTF)
Price action has shown a notable rebound from the 6655 level, currently approaching the 6800 to 6810 range, which is characterized by recent supply identified on the 1-hour and 4-hour charts. Despite the ongoing lower-highs structure observed on the 4-hour timeframe, momentum appears to be shifting positively following Friday’s significant low. Traders should anticipate a period of two-way trading early in the week, likely within the 6650 to 6850 corridor, until mid-week economic data provides clearer direction.
Setups (Level-KZ Protocol 15/5/1)
1) Rejection Fade @ 6800–6810 (Tier-1 if first touch)
15m rejection back inside → 5m re-close below with LH → 1m first pullback fail.
Entry: 6798–6808 on 1m fail. SL: 15m wick-high +0.25–0.50.
TP1: 6768–6775 (S1). TP2: 6723 (S2). Viability gate: TP1 ≥ 2.0R using the 15m-wick stop.
2) Acceptance Continuation > 6810
15m full-body close above → 5m pullback holds 6805–6810 → 1m HL entry.
Entry: 6808–6812. SL: 6794–6798 (15m wick).
TP1: 6838–6848 (R2). TP2: 6885–6905 (R3). No trailing before TP2; at TP1 close ~70%, set runner to BE.
3) Quick-Reclaim Bounce @ 6765–6775 (Tier-2)
Sweep S1 → instant reclaim on 5m → 1m HL.
Entry: 6767–6774. SL: 6756–6759.
TP1: 6798–6810. TP2: 6835–6845.
4) Exhaustion Flush Bounce @ 6648–6658 (Tier-3)
Capitulation wick into S4 → 5m reversal signal → 1m HL.
Entry: 6651–6657. SL: 6639–6642.
TP1: 6686–6692. TP2: 6718–6728.
What can move ES this week (keep risk light around release windows)
• Tue (Nov 11): Veterans Day — equities open, U.S. bond market closed; liquidity can be thinner.
• Thu (Nov 13, 8:30 ET): October CPI.
• Thu (Nov 13, 8:30 ET): Initial jobless claims (weekly).
• Fri (Nov 14, 8:30 ET): October PPI and Advance Retail Sales.
• Fed speakers/boards: See the Fed’s official calendar for any added talks this week.
• Earnings of note: Several large caps report mid-week (e.g., Cisco; Disney). Expect single-name volatility spillover.
Notes for execution: mark the zones on 15m; wait for your 15→5→1 confirmation sequence; enforce the 2.0R viability gate using the 15m wick stop; no partials before TP1; max two tries per level.
Amy5 min for set up and one minute for entry
Volume shelf is white dotted line, and two blue lines are GEX Walls, so you have Confluence on the 5-minute chart. Go to one minute for entry, look for buyside imbalance for entry and use latest swing low as stop loss.

ES Open GapFutures gapped up this afternoon, and that gap will eventually have to fill. Not sure when. Probably when MFI hits overbought, I don't see it going back and filling quickly.
I'll post an update in the morning if I have time.

Sp500We just hit important trend line and bounce inverting a 4H with not resistance so if we can return to this 4H OB/ FVG staying above the 50% of the daily wick above 6725. Taking a long set up pushing away from PDA is a high probability trade targeting 6800s. If this level fail consolidation and lower prices are more likely.
Note: Watch for Gap up or Gap down. They can alter the set up.

SP500We just hit important trend line and bounce inverting a 4H with not resistance so if we can return to this 4H OB/ FVG staying above the 50% of the daily wick above 6725. Taking a long set up pushing away from PDA is a high probability trade targeting 6800s. If this level fail consolidation and lower prices are more likely.
Note: Watch for Gap up or Gap down. They can alter the set up.

ES QuantSignals V3 Futures 2025-11-08ES QuantSignals V3 Futures 2025-11-08
ES Futures Signal | 2025-11-08
• Direction: SELL | Confidence: 68%
• Type: Index Futures | Timeframe: 1H
• Entry Range: $6757.50
• Target 1: $6665.00
• Stop Loss: $6810.00
• Volume vs Avg: 1.0×
• Recent Move: -1.34%
• ⚠️ MODERATE RISK WARNING: Consider reducing position size due to moderate confidence level.
⚖️ Compliance: Educational futures commentary for QS Premium. Not financial advice.
🚀 QS V3 ELITE FUTURES ANALYSIS
Generated: 2025-11-08 16:18:07 ET
Instrument: ES ($6753.75)
Type: Index Futures
Trend: BEARISH
Confidence: 67.7%
Timeframe: 1H
Model: QS + Katy AI
Strictness: MEDIUM
🎯 TRADE RECOMMENDATION
Direction: SELL
Confidence: 68%
Conviction Level: MEDIUM
🧠 ANALYSIS SUMMARY
Katy AI Signal: Bearish with 67.7% confidence, predicting decline to $6662.98 (-1.34%)
Technical Analysis: Current price $6753.75 showing immediate weakness after -1.34% drop. Katy's prediction shows initial choppy action with clear bearish trajectory emerging from November 12th, accelerating downward through November 13-14. Key resistance at $6780-6800 zone, support levels at $6700 then $6650.
Macro & News: Light news flow with mostly energy sector specifics. Market appears to be driven by technical positioning rather than major catalysts. Normal VIX at 19.08 suggests orderly selling pressure.
Flow & Positioning: Volume at average levels indicates normal participation. Options flow data appears incomplete/unreliable. Katy's prediction shows consistent selling pressure building over the 120-period horizon.
Risk Level: MODERATE - Primary risk is initial choppiness before bearish trend establishes. Stop must account for potential false breakdowns.
💰 TRADE SETUP
Contract: ES
Entry Price: $6750 - $6765
Take Profit 1: $6665
Take Profit 2: $6590
Stop Loss: $6810
Position Size: 2 contracts (moderate conviction with proper risk management)
⚡
Image
QS Analyst
APP
— Yesterday at 4:18 PM
COMPETITIVE EDGE
Why This Trade: Katy AI provides high-confidence bearish signal with detailed time-series validation showing clear downward trajectory after initial consolidation
Timing Advantage: Entry during Globex session allows positioning before potential acceleration of selling pressure during regular hours
Risk Mitigation: Wide stop-loss accounts for initial volatility, while tiered take-profits capture momentum at key support levels
🚨 IMPORTANT NOTES
Monitor for any unexpected bullish catalysts that could reverse the technical bearish setup
Be prepared for choppy price action between November 9-11 before clearer bearish trend establishes
Position size should be reduced if market shows unexpected strength above $6780 resistance
Trade Validation: Katy AI's bearish prediction aligns perfectly with current technical weakness and normal volatility environment, providing strong directional conviction for short positions.
📊 TRADE DETAILS 📊
🎯 Instrument: ES
🔀 Direction:
💵 Entry Price: 6757.50
🎯 Profit Target: 6665.00
🛑 Stop Loss: 6810.00
📏 Size: N/A
📈 Confidence: 68%
⏰ Entry Timing: N/A
🕒 Signal Time: 2025-11-08 19:18:04 EST
⚠️ MODERATE RISK WARNING: Consider reducing position size due to moderate confidence level.
---
QS V3 Futures Strategy System - Professional futures trading with Katy AI intelligence.
