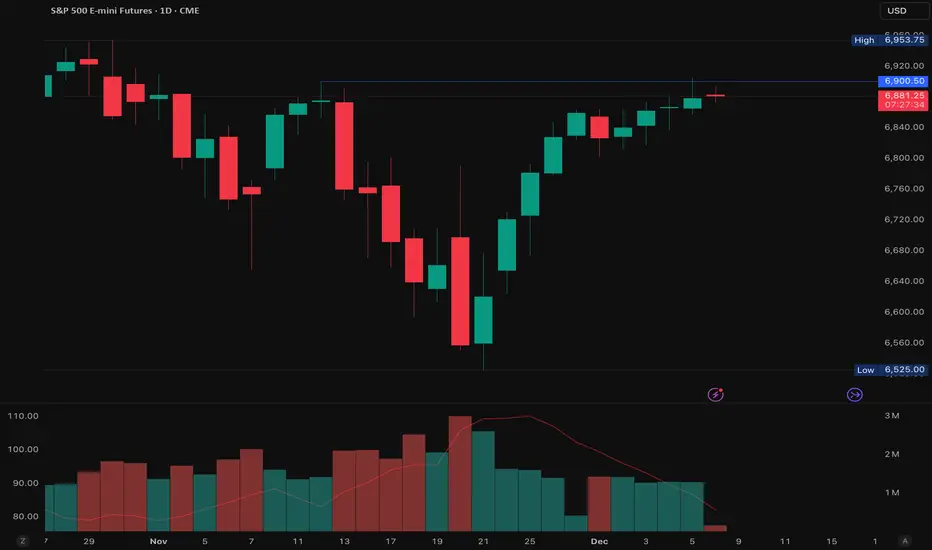
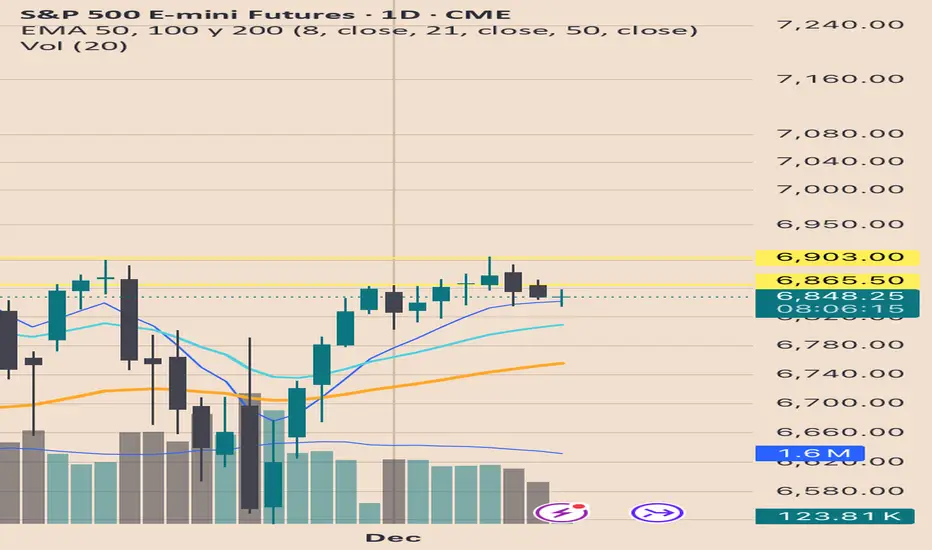
Buyers made an attemptBuyers in the daily chart of the S&P 500 made an attempt to push the market to new lies but it failed to hold onto those highs and backed off to lower prices by the close. The expectation is buyers will make another attempt towards the upside with an objective of 6881.
Micro E-mini S&P 500 Index Futures
No trades
Trade ideas

ES the big fall day ?Looking to short ES today to 6720 area.
based on yesterday movement that weren't able to make new local HOD => assuming today we will go lower .
SL close above 6855
S&P Futures Trading Day 77 — Locking Gains in a Scary MarketEnded the day +$247.39 trading S&P Futures. I came into the session with a bullish bias thanks to the market structure, and initially, things looked great as I caught a nice move breaking over the 1-minute MOB. However, the market had some tricks up its sleeve—I got stop-hunted trying to play the breakout zone at 6828, giving back some profits. I didn't let that rattle me, though; I went long again at support off the 11:10 signal, made the money back, and hit my ~$250 goal. With how "scary" and fragile everything feels lately, I decided to just lock in the smaller gains and call it a day.
📰 News Highlights
*BITCOIN TUMBLES 5% TO $86K AMID CRYPTO SELLOFF
🔔 VX Algo Signals
9:00 AM — MES Market Structure flipped bullish (X3) ✅
11:10 AM — VXAlgo NQ X1DP Buy Signal ✅
2 out of 2 signals worked — 100% accuracy today.
🔑 Key Levels for Tomorrow
Above 6830 = Bullish Below 6800 = Bearish

Sideways move is expectedSellers returned to the daily chart in the S&P 500 but a dramatic drop from these levels is not expected. The current expectation is an inside and only slightly lower movement in this market.

S&P 500 (ES1!): Bullish! Look For Valid Buys!Welcome back to the Weekly Forex Forecast or the week of Dec. 1-5th.
In this video, we will analyze the following FX market: S&P 500 (ES1!)
The S&P500 rallied last week, closing strong! Look for follow through going into this week.
Go with the overall bullish trend until there is a bearish market structure break.
Enjoy!
May profits be upon you.
Leave any questions or comments in the comment section.
I appreciate any feedback from my viewers!
Like and/or subscribe if you want more accurate analysis.
Thank you so much.
Disclaimer:
I do not provide personal investment advice and I am not a qualified licensed investment advisor.
All information found here, including any ideas, opinions, views, predictions, forecasts, commentaries, suggestions, expressed or implied herein, are for informational, entertainment or educational purposes only and should not be construed as personal investment advice. While the information provided is believed to be accurate, it may include errors or inaccuracies.
I will not and cannot be held liable for any actions you take as a result of anything you read here.
Conduct your own due diligence, or consult a licensed financial advisor or broker before making any and all investment decisions. Any investments, trades, speculations, or decisions made on the basis of any information found on this channel, expressed or implied herein, are committed at your own risk, financial or otherwise.

ES LONGES long trade.
target 6900
SL close below 6790.
we have support loss at 4h and 1h but its fake as all Higher TF are bullish.
go long

ES (SPX, SPY) Deep Analyses for Upcoming Week (Dec 1st - 5th)Multi-Timeframe Market Structure Analysis
Weekly Trend Overview
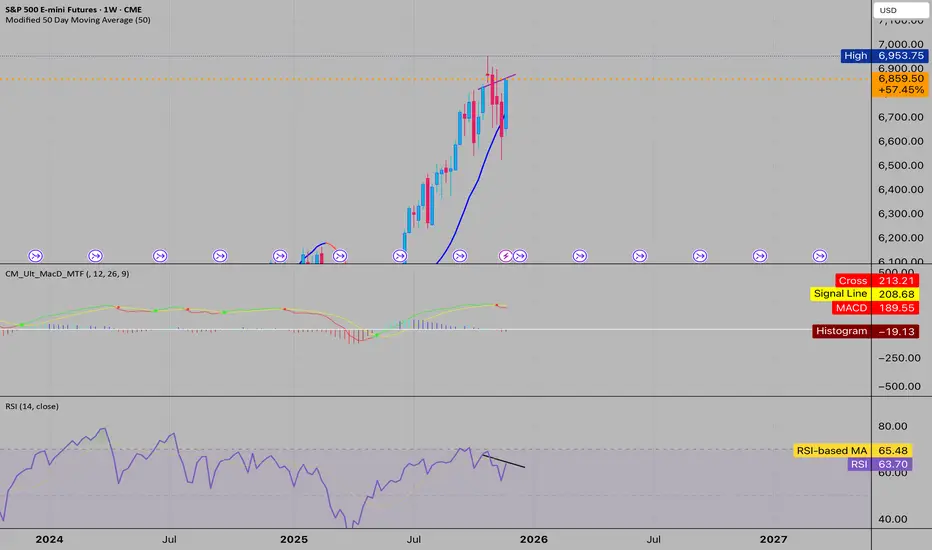
The E-mini S&P 500 (ES) continues to reflect a robust bullish trend on the weekly chart, characterized by a series of higher highs and higher lows. The most recent swing low is situated in the mid-6,500s, while prices are currently testing the previous weekly high zone around the high-6,800s, accompanied by a labeled weak high band overhead.
In terms of market positioning, prices reside firmly in the upper half of the annual range, trading within a premium supply band rather than at a discount. Momentum indicators are showing signs of a slowdown, with the weekly oscillator retreating from overbought conditions and gently sloping downward, even as prices hold near their highs. This situation exemplifies early-stage negative momentum divergence, suggesting that while the overarching trend remains intact, any upside progress is now slower and increasingly susceptible to pullbacks.
The structural bull market on the weekly timeframe is still valid, but the current price action falls into a costly zone, placing the onus on buyers to maintain upward momentum.
Daily Trend Analysis
Following a notable decline in November from the all-time high, ES established a higher low around the mid-6,500s, coinciding with a key extension bundle. Subsequently, it rebounded through the mid-6,700s, successfully reclaiming the essential daily midrange. The latest price action reflects a sequence of lower lows (LL), higher lows (HL), and a higher high, signaling a short-term bullish trend within a broader sideways pattern just beneath the recent highs.
The active daily range is delineated between 6,650 and 6,900, with current trading situated in the upper third. The daily momentum oscillator has sharply ascended from oversold territory and sits comfortably in the 60s—nearing overbought conditions but not quite there yet.
The daily trend indicates an uptrend initiated from a higher low, now testing resistance levels. Trend-following participants are positioned long, though late entrants may find themselves crowded near the upper edge of the trading range.
Four-Hour Structural Insights
The 4-hour chart reveals a strong reversal from a low around 6,525, where price structure has formed a clean stair-step of higher highs and higher lows. The latest 4-hour higher low rests in the high-6,700s. The recent impulse leg from this higher low has driven prices into the prior week's high and supply band near the high-6,800s. Observations indicate that candles are narrowing while wicks are extending, typically signaling an impending maturation of the current price leg.
While this remains largely an impulse move rather than a complete correction, the risk-to-reward ratio for entering fresh long positions at these levels appears unfavorable without a corrective pullback.
The 4-hour trend is decidedly bullish, yet this leg is maturing. A retracement toward the last observed higher low band in the high-6,700s would be both typical and healthy for the ongoing progression.
One-Hour Intraday Context
The 1-hour chart indicates a prolonged consolidation phase in the low-to-mid-6,800s, succeeded by a breakout thrust toward the prior week’s high. Recent micro-structural developments show small higher highs with diminished follow-through into the resistance zone. The emergence of upper wicks on the 1-hour candles suggests we're in the later stages of this move which originated from Friday’s New York low.
For intraday traders, entering new positions at this stage carries poor asymmetry. Strategies may involve either capitalizing on a potential exhaustion spike higher or considering buys only after a reset lower.
The intraday price leg is nearing maturity; anticipate either a minor mean reversion back into the breakout base or a final overshoot into the overhead extension band, followed by a more substantial pause.
Oscillator Insights on Weekly and Daily Timeframes
On the weekly front, the oscillator is rolling over from overbought levels, keeping prices near previous highs. While this in itself does not constitute a sell signal, it does imply that any additional advances will likely become increasingly challenging and volatile. Conversely, the daily oscillator remains robust, exhibiting positive momentum and trending upwards, although already sitting at mid-to-high levels. While there remains potential for one more uptick toward resistance, the risk of a sharp downturn looms larger should market news or flows fail to meet expectations.
Bottom Line: The primary timeframe indicators (weekly/daily) maintain a bullish outlook, while the active swings on the 4-hour and 1-hour charts are showing maturity and extension into resistance. The upcoming trading week will likely focus on navigating this late-stage upswing, either through fading exhaustion at the range's peak or by purchasing on controlled dips into well-defined demand zones.
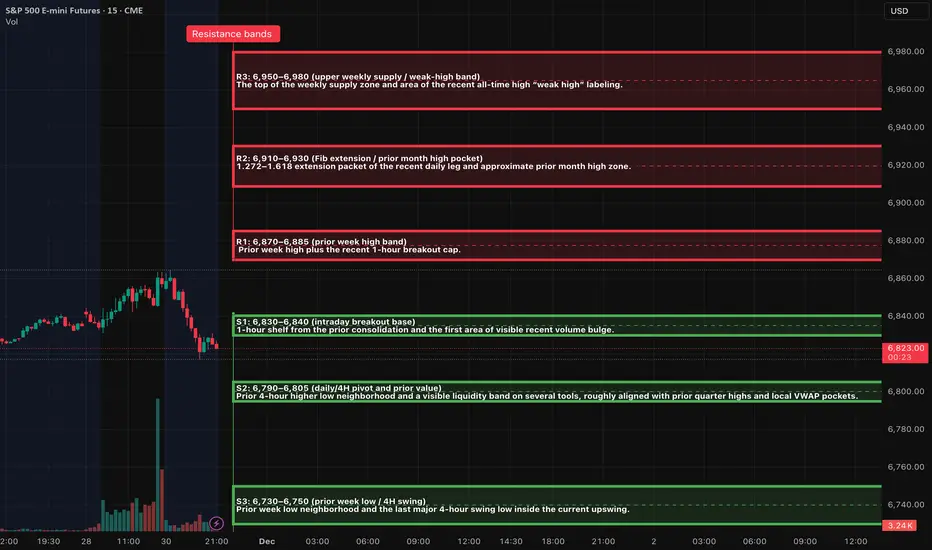
Market Overview: Key Levels and Dynamics
Trend Boundary Analysis: 6,780 Area
The pivotal threshold for discerning between a healthy pullback and a significant trend reversal lies around the 6,780 mark. A sustained daily close below this level—specifically under S2 and near the last daily higher low—would signal a transition from what appears to be a “healthy pullback in an uptrend” to a more pronounced “daily correction.” In contrast, remaining above 6,780 allows for the interpretation of pullbacks as buyable dips into existing demand. However, should the market close below this threshold with consistent acceptance evidenced by multiple 4-hour closes and significant volume, the prevailing sentiment would shift towards anticipating a larger trading range or an early trend change.
Volatility Metrics Overview
The volatility index (VIX) closed at approximately 16.35 on Friday, a considerable drop from the mid-20s earlier in the month, indicating a low-to-moderate equity volatility regime. The options market appears relaxed rather than panicked. The VIX term structure has returned to contango, with the front month trading cheaper than the back month, supporting a risk-on environment without veering into euphoria. On the treasury front, the MOVE index remains elevated at around 69, having retreated from mid-80s spikes earlier in November, signaling that rate volatility has cooled yet remains high compared to pre-2022 standards.
The recent readings suggest that the fear that overshadowed the mid-month selloff has largely been priced out. Both equity and rate volatility have begun to mean-revert, typically favoring range trading and a more orderly trend rather than severe sell-offs. However, it’s important to note that the current state makes protective measures inexpensive, hinting that abrupt corrections could emerge unexpectedly.
Options Positioning Dynamics
The total put/call ratio is hovering around 0.70 for the latest session, suggesting a slight tilt towards puts relative to longer-term averages. The equity put/call ratio stands at about 0.44, indicating a bullish, call-heavy sentiment among traders, predominantly in single-name options. The 10-day moving average of the put/call ratio is roughly 0.92, slightly below neutral, indicating some short-term complacency, although not excessively stretched.
The SKEW index has stabilized around 143, down from the 160s a year ago but still above the traditional baseline of 120-130. This points to an inclination for tail hedging that is present but not extreme. Given the mid-teen VIX levels and a neutral total put/call ratio combined with a low equity put/call ratio, it is reasonable to deduce that dealers are likely not heavily short gamma at current spots. They may be positioned closer to long or flat gamma within the 6,750-6,900 range, which generally dampens intraday volatility and suggests a tendency toward mean-reversion. Conversely, movement outside this band—specifically above 6,950 or below 6,730—could alter the gamma positioning and pave the way for more significant directional shifts.
Market Breadth and Internal Strength
The S&P 500 concluded the week with a modest 0.5% gain on Friday, reflecting small gains throughout the month, while the Nasdaq faced a 1.5% decline, primarily driven by weakness in large technology stocks. The S&P 500 remains above both its 50-day and 200-day moving averages, having reclaimed the 50-day line last week after an earlier dip, suggesting renewed market participation beyond just a few mega-cap stocks.
Sector performance varied notably, with technology facing headwinds throughout November—most notably from AI-linked companies—while sectors such as energy, consumer cyclicals, and certain areas of healthcare and financials saw positive movements towards month-end. Despite an earlier warning from indicators like the McClellan Oscillator suggesting internal weaknesses, the recent rebound has begun to improve breadth. However, concerns linger that this rally might be more fragile than typical broad-based advances, given its rotational and choppy nature.
Credit and Funding Landscape
The high-yield index (HYG) hovers around 81, near recent highs, indicating generally favorable credit conditions as it has progressively climbed through November. High-yield spreads are tightening relative to recent standards, reinforcing a “risk-on” attitude within credit markets. There are no apparent signs of acute funding stress; previous operational disruptions in futures markets were not indicative of systemic issues.
Currently, credit markets are not signaling alarms. As long as HYG remains above approximately 79, equity dips are more likely to be viewed as buying opportunities rather than triggers for widespread liquidation.
Sentiment and Investor Positioning
In the latest AAII survey, the bull-bear spread stands at around -11%, indicating a modest bearish sentiment, with bears outnumbering bulls by approximately 11 percentage points—below the historical mean of +6%. Conversely, the low equity put/call ratio suggests that traders are actively pursuing upside positions in individual equities.
In summary, while survey data points to cautious investor sentiment, options markets illustrate a preference for call buying and a diminishment of fear. This dichotomy often results in uneven uptrends with the potential for sudden pullbacks when complacency is inevitably challenged.
Global Risk Sentiment and Cross-Asset Overview
In the cryptocurrency sector, Bitcoin has stabilized around 90-91k following a significant correction earlier in the month, with modest recovery observed in the past week. This development underscores a risk-on atmosphere among investors.
Macro and data-calendar context
• The coming week (Dec 1–5) is busy but not as pivotal as the mid-December CPI/Payrolls
• Key events:
• Monday: ISM Manufacturing and construction spending.
• Tuesday: JOLTS job openings.
• Wednesday: ADP employment and ISM Services, plus several PMI and industrial-production figures.
• Thursday: Challenger job cuts, weekly jobless claims, and trade balance.
• Friday: Critically, the delayed PCE and core PCE inflation data for September, pushed back by the recent government shutdown.
• Fed communication: The Fed is effectively entering its pre-meeting quiet period; Powell’s upcoming speech is one of the last major remarks before the December meeting.
Macro narrative: Markets are leaning heavily toward another Fed rate cut in December and a benign inflation path.  Given that, negative surprises in PCE or labor data could trigger a sharp repricing.
The late-November rally appears to be a recalibration of positioning and sentiment following a mid-month scare within the tech sector, rather than a direct response to any significant data shock. This week's major macroeconomic event is Friday's PCE report; other data releases are expected to influence intraday fluctuations rather than alter the overarching trend.
Scenario Analysis and Probabilities
These scenarios represent probabilistic outcomes rather than certainties.
Primary Path — “Controlled Grind with Dip-Buying” (Approximately 50%)
As we enter Monday, expect a modest pullback from Friday's late gains, with overnight Globex trading projected to fluctuate between 6,820 and 6,880. Early in the week, the market may test support levels S1 (6,830–6,840) or potentially S2 (6,790–6,805), ultimately leading to renewed attempts to breach resistance at R1 and possibly R2. By the week’s end, prices are anticipated to oscillate within a broad range of 6,790–6,930 ahead of Friday's PCE announcement, with only temporary moves outside this zone.
Confirmation Criteria: This path will be validated if we observe rejections below the 6,780 level holding firm on a closing basis, accompanied by repeated failures of sellers to maintain downward pressure beneath S2.
Bear-Extension Path — “Deeper Reset Before Year-End” (Approximately 30%)
This scenario is triggered by a failed breakout above R1/R2 early in the week, coupled with a significant intraday reversal and a decisive 4-hour close beneath S2 and potentially S3. Initial price action may feature a spike into the 6,910–6,930 range followed by swift sell-offs, leading to a rapid retreat back through S1 and S2, particularly if the PCE data comes in above expectations or labor statistics surprise on the upside, prompting a re-assessment of potential Fed rate cuts.
Target Area: The initial aim would be the 6,650–6,700 region (near S4), with the possibility of a complete reversal down toward the more robust 6,620–6,650 band.
Confirmation Criteria: Continuous acceptance below approximately 6,730 on a 4-hour basis, combined with a daily close under the 6,780 threshold, would indicate a return to the narrative of a higher low for November.
Bull-Surprise Path — “Breakaway Into New Highs” (Approximately 20%)
This scenario is set in motion by a clear 4-hour and subsequent daily close above R2 and R3, driven by exceptionally benign PCE numbers and a supportive stance from the Federal Reserve. Initial price action should reflect minimal pullback in the early part of the week, steadily climbing past R1 and R2, ultimately resulting in a trend day that aggressively squeezes shorts above the 6,950 mark.
Target Area: The market will likely gravitate toward the extension zone of 7,050–7,100.
Confirmation Criteria: Sustained trading above 6,930 without significant reversals, robust market breadth, and a VIX that remains comfortably anchored in the mid-teens or lower will serve as key indicators for this bullish outlook.
Two A++ setups for the week
A++ Setup 1: Rejection short from R2
Fade spike into 6,910-6,930; Entries, SL, TPs
Entry zone: 6,890–6,900 on the first clean 1-minute pullback after the 5-minute lower high.
Initial stop: Above the rejection high plus a small buffer; planning number ~6,935. That is about 35-45 points of risk if filled near 6,895-6,900; refine to the actual 15-minute wick when it forms.
TP1: 6,830-6,840 (S1 / breakout base). From a 6,895 entry, that is roughly 55–65 points, giving at least 1.3-1.5R with the conservative stop and significantly more if the wick is tighter.
TP2: 6,790-6,805 (S2 demand pocket).
TP3 (runner): 6,730-6,750 (S3), only if tape is heavy (e.g., PCE or data shock).
A++ Setup 2: Continuation long from S2
ES Long (A++) - Buy reclaim of 6,790–6,805; Entries, SL, TPs
Entry zone: 6,805-6,815 on the first 1-minute higher-low after the 5-minute confirmation.
Initial stop: A few points below the spike low; planning number ~6,780, which gives about 25–35 points of risk.
TP1: 6,870-6,885 (R1 / prior week high band). From a 6,810 entry, that is roughly 60–75 points, delivering comfortably more than 2R with the planned stop.
TP2: 6,910-6,930 (R2 extension band).
TP3 (runner): 6,950-6,980 (R3 / upper weekly supply) if PCE and flows are supportive.
Good Luck !!!
Weekly and Daily Bearish DivergenceSPX is starting to show the bearish divergence everyone has been anticipating. Let’s see how this plays out with Treasury tight liquidity, over night funding rates going up. I think we are going to see a Red 12/01 though the week.
ES UpdateI think ES bounces when NA hits oversold, but there is a chance that ES needs to go oversold too.
Recommend waiting until Monday to go long.

SP500 Intraday LONG Trade No. 2 Trade for the Day Series - #ESHSP500 Intraday LONG Trade No. 2 in The Trade of the Day Series – #ESZ2025
Looking for a move up from approx. current level (value area) via intraday continuation 📈
Expecting a rotation higher with step-by-step acceptance toward: TP1 → TP2 → TP3, + potential extension toward TP4 in case we get a final melt-up.
Let’s see how the day unfolds 👀
#ESFutures #SP500

ES finishing a distribution schematic here?Seems to be rolling over on a distribution schematic. Right now the value appears to be in Dividend names like some of which I shared on my profile ( NYSE:NKE for example). Amongst others I'm eying are NYSE:SWK NYSE:NVO and $NESN.
Nasdaq seems to be rolling over, and so do a couple of big tech names like NASDAQ:NVDA and NASDAQ:GOOG hitting a 1.618 extension. Meanwhile small caps are shooting up. And so it looks like we are entering or at least nearing a final phase before a steeper correction.

Can buyers follow throughCan buyers follow through on the daily structure in the S&P 500 on Friday? Buyers reentered the market on Thursday but the real test will be the closing price and the level of confidence shown by these buyers with a positive close.

Inflation Impact on the Market1. Impact on Stock Market
Inflation influences stock markets in complex ways, creating both opportunities and risks for traders and investors.
a. Corporate Earnings and Profit Margins
When inflation rises, companies face higher costs for raw materials, labor, transportation, and utilities. If businesses cannot pass these costs to customers through higher prices, their profit margins shrink. Lower profits often lead to a decline in stock prices because investors expect reduced future earnings.
b. Investor Sentiment
High inflation creates uncertainty. Investors begin to worry about:
Reduced consumer spending
Declining profitability
Increased interest rates
Slower economic growth
This negative sentiment causes selling pressure in equity markets, especially in growth stocks.
c. Sector-Wise Impact
Inflation does not affect all sectors equally:
Beneficiaries: Energy, commodities, metal, mining, and FMCG often benefit because they can pass on higher costs to customers.
Losers: Technology, banking, real estate, and discretionary sectors often struggle because their valuations depend heavily on future growth. When inflation rises, the present value of future earnings decreases.
d. Value Stocks vs. Growth Stocks
Value stocks generally perform better during high inflation because they have stable cash flows today.
Growth stocks tend to underperform because higher inflation reduces the future value of their expected earnings.
2. Impact on Bond Market
Bonds are significantly affected by inflation because their returns are fixed.
a. Rising Inflation Reduces Bond Value
When inflation rises, the real return on bonds falls. For example, if a bond gives 6% interest and inflation rises to 7%, the bond has a negative real return of –1%. As a result, investors sell bonds, causing bond prices to fall and yields to rise.
b. Central Bank Response
To control inflation, central banks like the RBI typically raise interest rates. Higher interest rates push bond yields upward and reduce the attractiveness of older bonds with lower rates.
c. Impact on Long-Term Bonds
Long-term bonds suffer more during inflation because they lock in low interest rates for many years. Investors shift to short-term bonds or inflation-protected bonds.
3. Impact on Currency Market
Inflation directly influences exchange rates and currency strength.
a. Weakening Domestic Currency
When inflation rises in a country faster than its trading partners:
The domestic currency loses value
Imports become costlier
Foreign investors withdraw money
A weak currency increases inflation even more because imported goods like crude oil, electronics, and chemicals become more expensive.
b. Foreign Investment Outflows
High inflation reduces real returns for foreign investors. They move money to stable and low-inflation countries like the U.S., causing depreciation of the domestic currency.
4. Impact on Commodity Market
Commodity markets are highly sensitive to inflation because commodities are physical goods used in production.
a. Commodities Act as an Inflation Hedge
During inflation, investors prefer:
Gold
Silver
Oil
Natural Gas
Metals
These commodities usually rise in value, making them a hedge against inflation.
b. Cost-Push Inflation
When commodity prices rise, the cost of production increases for companies. This leads to:
Higher retail prices
Reduced consumer spending
Lower corporate profits
This is known as cost-push inflation, which slows economic growth.
5. Impact on Real Estate Market
Inflation influences real estate in multiple ways.
a. Rising Property Prices
Inflation increases the cost of construction materials like cement, steel, and labor. This results in:
Higher property prices
Increased rental yields
Real estate is often seen as a hedge against inflation.
b. Higher Interest Rates Affect Demand
When central banks raise interest rates:
Home loans become expensive
Demand for housing slows
Real estate transactions reduce
Thus, inflation can both push real estate prices up (due to costs) and reduce demand (due to financing costs).
6. Impact on Consumers
Inflation directly hits consumers’ pockets.
a. Reduced Purchasing Power
Consumers can buy fewer goods and services with the same amount of money. This reduces:
Savings
Consumption
Discretionary spending (luxury items)
b. Shift in Spending Patterns
Consumers prioritize essentials:
Food
Utilities
Healthcare
Transport
and reduce spending on:
Travel
Clothing
Electronics
Dining out
This shift affects sectors differently in the stock market.
7. Impact on Businesses
Companies face several challenges during inflation.
a. Higher Operating Costs
Input costs such as raw materials, transportation, and wages increase. Companies must decide whether to:
Pass higher costs to customers
Absorb the impact and reduce margins
b. Uncertain Forecasting
Inflation makes it difficult for businesses to plan:
Budgets
Future investments
Expansion strategies
High unpredictability leads to slower business growth.
c. Wage Inflation
Employees demand higher salaries to maintain living standards. Companies face increased payroll costs, which affects earnings.
8. Impact on Economic Growth
Inflation influences the broader economy through multiple channels.
a. High Inflation Slows Growth
If inflation rises too fast:
Consumption decreases
Investment slows
Borrowing becomes expensive
Business expansion reduces
This leads to slower GDP growth.
b. Risk of Stagflation
Stagflation refers to a situation where:
Inflation is high
Growth is low
Unemployment is rising
This is considered the worst-case economic scenario.
c. Central Bank Intervention
To control inflation, RBI raises interest rates and tightens monetary policy. Although this helps reduce inflation, it can slow economic momentum.
9. Impact on Investment Strategies
Traders and investors change strategies based on inflation trends.
a. Portfolio Rebalancing
Investors move money from:
Growth stocks → value stocks
Bonds → commodities
Domestic investments → foreign markets
b. Defensive Stocks Become Attractive
During inflation, sectors like:
FMCG
Utilities
Pharma
perform better because demand for their products remains stable.
Conclusion
Inflation plays a central role in shaping financial markets, economic conditions, business decisions, and investment strategies. While mild inflation indicates a healthy and growing economy, high or unpredictable inflation can create wide-ranging negative effects—market volatility, currency depreciation, reduced corporate earnings, and slower economic growth. Understanding how inflation impacts different sectors and asset classes helps investors make informed decisions and adapt their strategies based on current economic conditions.

ES UpdateSee..... I told you to wait for the Fed meeting. Much easier trading this afternoon. Easy money with calls.
Held a few of my calls because RSI has not hit overbought yet. Not sure if it's going to be a pump and dump or just more whipsaw after, but I'm panning on cashing out tomorrow morning (assuming a gap up), and possibly taking Friday off. Made enough money today anyways.
Based on some major stocks like MSFT, V, NVDA, NFLX and META staying red today, I do not anticipate a huge melt up. I'm doing my best to avoid the whipsaw and trading only when I see a good opportunity. Worked pretty well today.

ES testing 8EMA again8EMA provides some support here, if hold this we have the next key level to break resistance, then finally if we Santa rally over the upper resistance we could see 7000 EOY
Sustainable Investing in the World Market1. What Is Sustainable Investing?
Sustainable investing integrates Environmental, Social, and Governance (ESG) criteria into investment decisions to generate long-term financial returns while having a positive global impact.
Environmental (E)
Focuses on:
Carbon emissions
Renewable energy adoption
Waste management
Water usage
Biodiversity protection
Social (S)
Covers:
Labor standards
Diversity and inclusion
Community impact
Health and safety
Human rights
Governance (G)
Includes:
Board structure
Executive compensation
Shareholder rights
Ethical business practices
Transparency in reporting
Companies with strong ESG practices often demonstrate operational efficiency, lower regulatory risk, and a forward-thinking culture—all of which contribute to stable and sustainable long-term value.
2. Why Sustainable Investing Is Growing in the Worldwide Market
a. Climate Change and Global Environmental Risks
Climate change has become a financial risk, not just an environmental issue. Floods, extreme heat, rising sea levels, and supply chain disruptions influence corporate earnings. As a result, global investors now demand that companies disclose climate risks and decarbonization plans.
b. Government Regulations and Global Policies
Countries like the U.S., European Union, Canada, Japan, and India have introduced regulations requiring:
ESG disclosures
Carbon neutrality targets
Green finance frameworks
Penalties for environmental violations
The EU’s Sustainable Finance Disclosure Regulation (SFDR) and India's BRSR (Business Responsibility and Sustainability Reporting) are strong examples.
c. Consumer and Stakeholder Expectations
Modern customers prefer brands that:
Use renewable energy
Maintain ethical supply chains
Treat workers fairly
Millennials and Gen Z, who will dominate future investment flows, strongly prefer sustainable portfolios.
d. Corporate Responsibility and Reputation
Companies with strong ESG scores often enjoy:
Better credit ratings
Lower cost of capital
Stronger brand loyalty
Higher employee productivity
This drives more corporations to adopt ESG policies, reinforcing the trend.
e. Performance and Profitability
Contrary to old beliefs, sustainable investing does not sacrifice returns. Many ESG-focused indexes—such as MSCI ESG Leaders—have matched or outperformed traditional benchmarks over the years. Sustainable businesses tend to be:
More resilient
Less exposed to environmental fines
Better at governance
More adaptable to technological change
3. Global Sustainable Investment Strategies
Sustainable investing is broad and flexible. Major strategies include:
1. ESG Integration
The most widely used approach. Here, ESG scores are systematically used in traditional financial analysis. Portfolio managers evaluate:
Carbon footprint
Board diversity
Risk governance
Labor policies
Investment decisions balance ESG data with revenue, valuations, debt, cash flows, and other financial metrics.
2. Negative or Exclusionary Screening
This strategy excludes industries like:
Tobacco
Weapons
Coal mining
Alcohol
Gambling
Hazardous chemicals
It allows investors to avoid supporting harmful sectors while focusing on ethical businesses.
3. Positive Screening
Investors actively choose companies with:
High ESG ratings
Sustainable operations
Strong governance practices
For example, choosing energy companies that are rapidly shifting to renewables.
4. Green and Climate Themed Funds
These funds invest specifically in:
Green energy (solar, wind, hydrogen)
Electric vehicles
Sustainable agriculture
Water technology
Circular economy businesses
Climate-focused funds are expanding fast across the U.S., Europe, and Asia.
5. Impact Investing
Investments intentionally aimed at measurable positive impact, such as:
Affordable housing
Clean energy access
Education technology
Microfinance
Impact investors target financial returns alongside social/environmental benefits.
6. Shareholder Activism
Investors directly push companies to:
Reduce emissions
Improve labor rights
Increase transparency
Adopt ethical sourcing
Large institutional investors (BlackRock, Vanguard, State Street) often lead these engagement strategies.
4. Major Global Markets Leading Sustainable Investing
1. Europe
Europe holds the highest share of ESG capital globally due to:
Strict regulations
Strong public awareness
Policy commitment to carbon neutrality
Countries like Germany, Sweden, Netherlands, and the UK dominate green investments.
2. United States
Despite political debate, the U.S. houses massive ESG funds run by:
BlackRock
Vanguard
Fidelity
Clean energy and tech-driven sustainability are fast-growing segments.
3. Asia-Pacific
Countries like Japan, Singapore, South Korea, and India are catching up quickly. India, specifically, has growing ESG ETFs, BRSR reporting rules, and rising green bond issuance.
4. Emerging Markets
Brazil, South Africa, UAE, and China are investing heavily in:
Renewable power
Green infrastructure
Electric mobility
This makes emerging markets hotspots for future ESG growth.
5. Financial Instruments for Sustainable Global Investing
a. ESG Stocks
Companies with strong ESG scores (ex: Tesla, Ørsted, NVIDIA’s governance upgrades).
b. ESG Mutual Funds & ETFs
Popular global ETFs include:
MSCI Global ESG Leaders ETF
iShares ESG Aware MSCI USA ETF
Vanguard ESG International ETF
c. Green Bonds
Issued to finance:
Renewable energy
Clean transportation
Waste reduction
The green bond market has surpassed trillions of dollars globally.
d. Sustainability-Linked Loans
Loan interest rates shift based on a company’s ESG performance.
6. Challenges in Global Sustainable Investing
1. Greenwashing
Some companies exaggerate their sustainability. Regulators now require stricter guidelines to prevent misleading claims.
2. Lack of Standardized ESG Ratings
Different rating agencies often score the same company differently, creating confusion.
3. Short-Term Market Cycles
Oil prices or political shifts may temporarily favor non-ESG sectors.
4. Limited Data in Emerging Markets
Smaller companies often lack transparent ESG reporting.
7. Future of Sustainable Investing in the World Market
The future is optimistic. Key drivers include:
Global push for Net Zero by 2050
Rise of ESG-focused fintech
AI-based sustainability analytics
Corporate decarbonization roadmaps
Growth in green hydrogen, EVs, and carbon markets
By 2030, sustainable investing is projected to form a major share of global assets under management.
Conclusion
Sustainable investing in the world market is no longer a moral choice—it is a strategic financial decision. As environmental pressures intensify and societies demand ethical business practices, companies with strong ESG foundations gain competitive advantage. Investors focusing on sustainability benefit from lower risk, stronger governance, long-term resilience, and alignment with the future global economy. Sustainable investing enables individuals and institutions to earn returns while supporting a cleaner planet, fairer society, and more transparent global marketplace.

SPUZ - SP500 - balancing | FOMC SPUZ - SP500 - balancing | FOMC data to monitor .
Fed Fund rates at 87.6% odds!

How AI is Revolutionizing Risk ManagementIn a world where bots can fire off hundreds of orders in the time it takes you to sip your coffee, risk management isn't a checkbox at the end of your plan it's the core operating system.
AI has given traders incredible leverage:
Faster execution than any human
Exposure to more markets and instruments
Complex position structures that would be impossible to manage manually
But that same leverage cuts both ways. When something breaks, it doesn't trickle it cascades.
The traders who survive this era won't be the ones with the most aggressive models. They'll be the ones whose risk frameworks are built to handle both human mistakes and machine speed.
Why Old-School Risk Rules Aren't Enough Anymore
For years, the standard advice looked like this:
"Never risk more than 1–2% per trade"
"Always use a stop loss"
"Diversify across assets"
Those principles still matter so much. But AI and automation helped improve and changed the landscape:
Orders can hit the market in microseconds your "mental stop" is useless
Correlations spike during stress what looked diversified suddenly moves as one
Multiple bots can unintentionally stack risk in the same direction
Feedback loops between algos can turn a normal move into a cascade
In other words: the classic rules are the starting point , not the full playbook.
How AI Supercharges Risk Management (If You Let It)
Used well, AI doesn't just place trades it monitors and defends your account in ways a human never could.
Dynamic Position Sizing
Instead of risking a flat 1% on every trade, AI can adjust size based on:
Current volatility
Recent strategy performance
Correlation with existing positions
Market regime (trend, range, chaos)
When conditions are favorable, size can step up modestly.
When conditions are hostile, size automatically steps down.
The goal isn't to swing for home runs.
It's to press when the wind is at your back, and survive when it's in your face.
Smarter Stop Placement
Fixed stops at round numbers are magnets for liquidity hunts.
AI can analyze:
ATR-based volatility bands
Clusters of swing highs/lows
Liquidity pockets in the book
Option levels where hedging flows are likely
Stops get placed where the idea is broken, not where noise usually spikes.
Portfolio-Level Heat Monitoring
Most traders think in single trades. AI thinks in portfolios.
It can continuously measure:
Total percentage of equity at risk right now
Sector and theme concentration
Correlation clusters (everything tied to the same macro factor)
Worst-case scenarios under shock moves
If your "independent" trades are all secretly the same bet, a good risk engine will tell you.
The 4-Layer Risk Stack for AI Traders
Think of your protection as layered armor:
Trade Level
Clear stop loss
Defined target or exit logic
Position size tied to account risk, not feelings
Strategy Level
Max number of open positions per strategy
Daily loss limit per system
"Three strikes" rules after consecutive losing days
Portfolio Level
Total open risk cap (for example: no more than 2% at risk at once)
Limits by asset class, sector, and narrative
Rules to prevent over concentration in one theme (AI stocks, crypto, etc.)
Account Level
Maximum drawdown you're willing to tolerate
Hard kill switch when that line is crossed
Recovery plan (size reductions, pause period, review process)
AI can monitor all four layers at once every position, every second and trigger actions the moment a rule is violated.
Kelly, Edge, and Why "More" Is Not Always Better
The Kelly Criterion is a famous formula that tells you how much of your account you could risk to maximize long‑term growth.
Kelly % = W - ((1 - W) / R)
Where:
W = Win probability
R = Average Win / Average Loss
Example:
Win rate (W) = 60%
Average win is 1.5× average loss (R = 1.5)
Kelly = 0.60 - (0.40 / 1.5) ≈ 0.33 → 33%
On paper, that says "risk 33% of your account each trade." In reality, that's a fast path to a margin call.
Serious traders and any sane AI risk engine treat Kelly as the ceiling , then scale it down:
Half‑Kelly (≈ 16%)
Quarter‑Kelly (≈ 8%)
Or even less, depending on volatility and confidence
AI can recompute W and R as fresh trades come in, adjusting risk when your edge is hot and cutting risk when your edge is questionable.
Designing Your AI‑Era Risk Framework
You don't need hedge‑fund infrastructure to think like a pro. Start with five questions:
What is my absolute pain threshold?
At what drawdown (%) would I stop trading entirely?
Write that number down. Build backwards from it.
How many consecutive losses can I survive?
If you want to survive 10 straight losses at 20% max drawdown, your per‑trade risk must be ~2% or less.
How will I shrink risk when volatility spikes?
Tie your size to ATR, VIX‑style measures, or your own volatility index.
What are my circuit breakers?
Daily loss limit
Weekly loss review trigger
Conditions where all bots shut down automatically
Is everything written down?
If it's not in rules, it's just a wish.
Rules should be clear enough that a bot could follow them.
Four AI Risk Mistakes That Blow Accounts Quietly
Over‑optimization - Training models until the backtest is perfect… and live trading is a disaster.
Ignoring tail risk - Assuming the future will look like the backtest, and underestimating rare events.
No true kill switch - Letting a "temporary" drawdown turn into permanent damage.
Blind trust in the model - Assuming "the bot knows best" without understanding its logic.
AI should be treated like a high‑performance car: powerful, fast, and absolutely deadly if you drive it without brakes.
Discussion
How are you handling risk in the age of automation?
Do you size positions dynamically or use fixed percentages?
Do you cap total portfolio risk, or just think trade by trade?
Do your bots or strategies have clear kill switches?
Drop your thoughts and your best risk rules in the comments. In the future of trading AI will be the one watching your back.....
How I Use SMA Angle + Pullbacks for High-Probability EntriesIn today’s video I reveal a powerful strategy using my SMA Angle Alert Indicator combined with precision pullback entries.
This setup helps filter fake breakouts, avoid chop, and only take trades when momentum AND price structure align.
👉 SMA Angle + Pullback Entry Indicator
www.tradingview.com
➡️ Core Concept:
Use the SMA Angle to confirm trend direction + strength, then wait for a pullback into value before entering.
This creates high-probability continuation trades that work beautifully on MES, ES, NQ, MGC, and Forex pairs.
📌 What You’ll Learn in This Video
How the SMA Angle detects trend strength
The exact pullback entry trigger I use
How to avoid chop and false breakouts
How to time entries with precision (no guessing)
My personal tips for SL/TP placement
Live chart examples
How to add alerts for automated entries
💡 Why This Works
Most traders enter too late.
This strategy forces you to:
✔ Identify strong trend
✔ Wait for a clean pullback
✔ Enter when momentum returns
✔ Avoid over-trading
✔ Catch the meat of the move—not the noise
This video is for educational purposes only and is not financial advice. Trading futures, Forex, and derivatives involves substantial risk and may not be suitable for all investors. Always trade with money you can afford to lose. Past performance is not indicative of future results. You are responsible for your own trading decisions.

ES1! S&P 500 E-mini Futures - The Fed Week Pivot📈 Executive Summary - The Setup
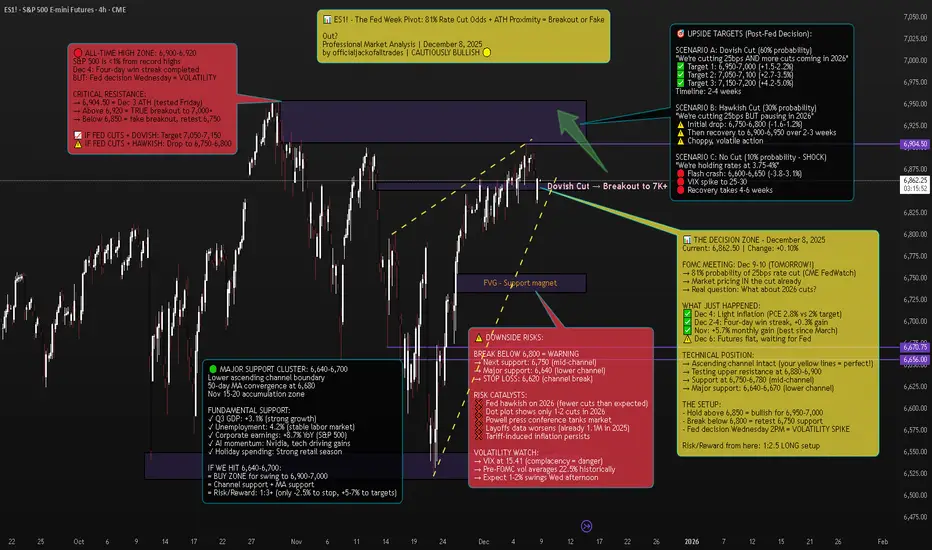
Current Price: 6,862.50 | Date: December 8, 2025 | Change: +6.75 (+0.10%)
The S&P 500 E-mini futures are sitting less than 1% from all-time highs on the eve of the Federal Reserve's most anticipated meeting of 2025. After a four-day win streak that added 0.3% to the index, markets are now in a classic consolidation pattern at resistance, waiting for Wednesday's 2PM ET catalyst.
The Technical Picture:
Pattern: Ascending channel (intact since November)
Current Position: Testing upper resistance at 6,880-6,900
ATH: 6,904.50 (December 3) - 0.6% away
Support: 6,750-6,780 (mid-channel), 6,640-6,670 (lower channel)
The Fundamental Backdrop:
FedWatch shows a near-90% probability the FOMC will cut the target range for the federal funds rate by another 25 basis points. But here's what markets are REALLY pricing: not just the cut itself (that's a given), but Powell's guidance on 2026.
Minutes from the October meeting showed "many" FOMC members saying no more cuts are needed at least in 2025. Yet the market now indicates an 80% likelihood of a December rate cut, following dovish statements from NY Fed President John Williams and Fed Governor Christopher Waller.
The Trade: This is a tactical long from 6,850-6,870 targeting 6,950-7,050, with stop at 6,820. Risk/reward: 1:2.5.
But the real opportunity? Buying any Fed-induced dip to 6,750-6,800 for a swing to 7,000+.
🔎 Market Context - What's REALLY Happening
The Pre-Fed Calm
US stock futures stall as traders wait for the Fed meeting, with the S&P 500 just below record highs. This is textbook behavior: The indexes have quietly stitched together consistent gains. The Dow and Nasdaq scored back-to-back positive weeks; the S&P 500 added another 0.3% and now sits only a touch from record territory.
S&P 500 futures (ES) traded around 6,880-6,885, roughly 0.1% higher by 6:00-7:30 a.m. ET on Monday.
But don't mistake the calm for weakness. Even after November's wobble, dip-buyers came back as shutdown fears faded and AI jitters cooled.
The Fed's Dilemma
The Federal Reserve is in an impossible position:
Argument FOR cutting:
Concerns about a softening labor market
Employers cut more than 1.1 million jobs through November, the most since 2020 and a 54% increase from the same period a year ago
Job growth remains too low to keep up with labor supply growth and a rising unemployment rate
Argument AGAINST cutting:
Latest inflation scorecard, the Fed's preferred PCE index, is running at 2.8 percent a year, close to its 2 percent goal but not quite there
The annualized inflation rate grew to 3% in September from 2.9% in August and 2.7% in July
Officials expressing skepticism about the need for an additional cut that markets had been widely anticipating, with "many" saying that no more cuts are needed at least in 2025
The Missing Data Problem:
Here's something CRITICAL that most traders don't know: The U.S. central bank will have to make its decision without some key government data. Hiring data for November and the latest inflation number have been delayed until mid-December, after the Fed's meeting, because of the U.S. government shutdown.
The meeting minutes indicated the decision-making was complicated by a lack of government data during the 44-day federal government shutdown. Powell himself compared this to "driving in the fog".
Translation: The Fed is making a $28 TRILLION (SPY market cap) decision BLIND.
The Internal FOMC War
"It's difficult to recall a time when the Federal Open Market Committee has been so evenly divided about the need for additional rate cuts than the upcoming December meeting," Michael Pearce, chief U.S. economist at Oxford Economics, said.
Jerome Powell faces a credibility issue as he tries to satisfy hawks and doves on the most divided Fed in recent memory.
The October meeting vote was 10-2, but the 10-2 vote was not indicative of how split officials were at an institution not generally known for dissent. The minutes revealed multiple camps:
Some favored cutting
Some supported cutting but could have supported holding
Several were against cutting
For December, Mericle expects at least two dissents in favor of no rate cut as well as one in favor of a larger rate cut.
📊 Technical Analysis - The Ascending Channel At Decision Point
The Pattern: Ascending Channel (Bullish Structure)
Your chart annotation is PERFECT. The yellow dashed ascending channel captures the exact structure driving ES1! since the November bottom.
Channel Characteristics:
Lower Support: 6,640 (tested Nov 15, Nov 29) → 6,670 (current)
Upper Resistance: 6,850 (Nov 25) → 6,900 (Dec 3-6) → 6,920 (projected)
Angle: ~25° (strong bull trend)
Tests: 6 touches (3 upper, 3 lower) = highly reliable pattern
Current Position: We're at the UPPER boundary of the channel, testing 6,880-6,900 resistance.
Key Technical Levels:
🔴 RESISTANCE (Selling pressure zones):
6,880-6,900: Current test, upper channel boundary
6,904.50: All-time high from December 3
6,920-6,950: True breakout zone (if we clear ATH)
7,000: Psychological milestone
🟢 SUPPORT (Buying interest zones):
6,850: Immediate support, bull/bear line
6,800-6,820: Minor support cluster + FVG
6,750-6,780: Mid-channel support + 23.6% Fib
6,700-6,720: 38.2% Fib retracement
6,640-6,670: Major support (lower channel + 50-day MA + November accumulation)
Technical Indicators:
Moving Averages:
50-day MA: ~6,680 (rising, bullish)
200-day MA: ~6,450 (rising, bullish)
Golden Cross: Active since mid-November = long-term bullish
RSI (Relative Strength Index):
Current: 58-60 (neutral/slightly bullish)
Not overbought (room to run to 70+)
Not oversold (not panic selling)
Interpretation: Healthy consolidation before next leg
Volume Analysis:
Declining volume into Fed decision = normal pre-FOMC behavior
Stock volatility averages around 22.5% in the month preceding rate cuts, compared with roughly 15% during normal periods
Expect volume spike Wednesday 2PM-4PM (100K+ contracts)
VIX (Fear Index):
VIX at 15.41, down -0.37 (-2.34%)
This is LOW = market complacency
Pre-FOMC, VIX typically rises to 18-22
IF VIX spikes to 20+ Wednesday = sell signal
🎯 Scenario Analysis - Three Possible Outcomes
SCENARIO A: Dovish Cut (60% Probability) - BULLISH
What Happens:
Fed cuts 25bps to 3.50-3.75% range ✓
Dot plot shows 3-4 more cuts in 2026 ✓
Powell says "labor market concerns outweigh inflation" ✓
Balance sheet runoff stops as planned (December 1) ✓
Market Reaction:
Immediate: ES pumps 1-1.5% to 6,930-6,950
Day 1-3: Consolidation at 6,920-6,950
Week 1-2: Breakout to 7,050-7,100
Month 1: Target 7,150-7,200 (+4.2%)
Sector Leaders:
Small caps (Russell 2000) +2-3%
Tech (Nasdaq) +1.5-2%
Financials +1-1.5%
Trade Setup:
Enter: ANY dip to 6,850-6,870 before Fed
Add: On breakout above 6,910 with volume
Target: 7,050 (+2.7%), 7,150 (+4.2%)
Stop: 6,820 (-0.6%)
Risk/Reward: 1:4
SCENARIO B: Hawkish Cut (30% Probability) - NEUTRAL/CHOPPY
What Happens:
Fed cuts 25bps to 3.50-3.75% range ✓
BUT dot plot shows only 1-2 cuts in 2026 ❌
Powell says "we're near neutral, will pause to assess" ❌
Market had priced in 3-4 cuts for 2026 = DISAPPOINTMENT
Market Reaction:
Immediate: ES drops 0.8-1.2% to 6,790-6,820
Day 1: Volatility, chop between 6,780-6,850
Week 1-2: Dip-buying brings it back to 6,870-6,900
Month 1: Grind back to 6,950-7,000 (+1.3%)
Sector Rotation:
Small caps (Russell 2000) -1.5-2%
Tech holds up better (mega-caps)
Defensives (utilities, staples) outperform
Trade Setup:
DO NOT chase before Fed (risk of -1.2% drop)
Buy: Dip to 6,750-6,800 (mid-channel support)
Target: 6,900-6,950 (+2-3% from dip entry)
Stop: 6,720 (-1%)
Risk/Reward: 1:2
SCENARIO C: No Cut OR Very Hawkish (10% Probability) - BEARISH
What Happens:
Fed HOLDS at 3.75-4% range (SHOCK) ❌
OR cuts but says "this is the last one for 6+ months" ❌
Powell cites inflation persistence, tariff risks ❌
Market has 90% priced in for cut = PANIC
Market Reaction:
Immediate: ES flash crashes 2-3% to 6,650-6,750
Day 1: Volatility, VIX spikes to 25-30
Week 1-2: Bounce attempt to 6,750-6,800 fails
Month 1: Retest 6,600, then recovery to 6,800-6,850
Sector Carnage:
Small caps (Russell 2000) -3-4%
Tech -2-3%
Everything bleeds
Trade Setup:
Exit ALL longs immediately on no-cut announcement
Wait for VIX to spike above 25
Buy: Capitulation at 6,600-6,650 (lower channel)
Target: Recovery to 6,850-6,900 (+3-4%)
Risk/Reward: 1:3 (but high stress)
🎯 THE TRADE SETUP - Professional Execution Plan
🟢 PRIMARY LONG SETUP: BUY ES1!
Entry Strategy (Scale In):
Option A: Conservative (Wait for Fed)
50% at 6,750-6,780 (IF hawkish cut dips)
50% at 6,720-6,750 (IF deeper dip)
Best for: Risk-averse traders
Option B: Tactical (Enter Now)
40% at 6,860-6,870 (current - small position)
30% at 6,820-6,840 (IF pre-Fed dip)
30% at 6,750-6,780 (IF post-Fed dip)
Best for: Experienced traders comfortable with volatility
Stop Loss: 6,620 (HARD STOP)
Below 6,620 = channel break on daily close
Below this = technical structure invalidated
Max loss from 6,862 entry: -3.5%
Take Profit Targets:
TP1: 6,950-7,000 (Probability: 70%)
Initial breakout above ATH
Psychological 7,000 level
Action: Take 40% profit, move stop to 6,850
Gain: +1.3-2.0% | Risk/Reward: 1:2
TP2: 7,050-7,100 (Probability: 50%)
Momentum continuation
Channel projection
Action: Take 30% profit, trail stop to 6,920
Gain: +2.7-3.5% | Risk/Reward: 1:3
TP3: 7,150-7,200 (Probability: 30%)
Full breakout extension
TradingView puts it, with a potential breakout in S&P 500 futures above the 6,900 area
Action: Take 20% profit, let 10% ride
Gain: +4.2-4.9% | Risk/Reward: 1:4
Entry Confirmation Checklist:
Before entering, CHECK:
✅ Price holding above 6,850 (bull/bear line)
✅ Volume spike on bounce (80K+ contracts on 15min)
✅ RSI crosses above 60 (momentum shift)
✅ VIX drops below 16 (fear subsiding)
✅ Fed announces 25bps cut (as expected)
✅ Powell's tone is dovish or neutral (not hawkish)
WAIT FOR 4/6 BEFORE FULL POSITION
Fed Day Volatility Protocol:
December 10, 2PM ET - Fed Announcement:
1:45 PM: Tighten stops to 6,830 (before announcement)
2:00 PM: Fed statement released - READ IMMEDIATELY
2:00-2:05 PM: Algorithmic reaction (ignore, volatile)
2:05-2:30 PM: Human digestion of statement
2:30 PM: Powell press conference begins - WATCH LIVE
2:30-3:15 PM: Powell Q&A determines direction
3:15-4:00 PM: Final positioning for overnight
IF DOVISH: Add to position on dip to 6,900
IF HAWKISH: Cut 50%, trail rest tight at 6,820
Weekly Monitoring:
Check EVERY DAY:
Fed speakers: Any 2026 guidance changes
Economic data: Jobs (Dec 16), CPI (Dec 18)
Technical levels: Is channel intact?
VIX: Spikes above 20 = warning
Volume: Declining = weak trend
Emergency Exit Conditions:
❌ Daily close below 6,620 = EXIT ALL (channel break)
❌ VIX spikes above 25 = EXIT 50%, tight stop on rest
❌ Fed announces NO cut (10% scenario) = EXIT ALL immediately
❌ Powell says "this is the last cut for 2026" = EXIT 50%
❌ ES gaps down >1.5% overnight = reassess, likely exit
📊 Fundamental Analysis - Why This Matters
CATALYST #1: The Fed's Impossible Position
Federal Reserve policymakers are expected to cut interest rates at this week's meeting despite inflation remaining above their target amid concerns about a softening labor market.
This is the classic Fed dual mandate dilemma:
Mandate #1: Maximum employment (FAILING - 1.1M layoffs in 2025)
Mandate #2: Stable prices (FAILING - inflation at 2.8% vs 2% target)
They can't fix both. So they have to choose.
David Mericle, chief U.S. economist at Goldman Sachs notes job growth remains too low to keep up with labor supply growth and a rising unemployment rate.
My take: The Fed will prioritize employment over inflation. That's dovish = bullish for stocks.
CATALYST #2: Corporate Earnings Remain Strong
Despite all the macro noise, corporate profits are SOLID:
S&P 500 earnings: +8.7% YoY
Tech sector leading: +12-15% earnings growth
AI spending driving margins higher
Q4 guidance mostly positive
Carvana (CVNA) stock rose 8% before the bell on Monday following news on Friday that it will join the S&P 500 as part of the index's quarterly rebalancing.
Translation: Fundamentals support higher prices, Fed just needs to cooperate.
CATALYST #3: Seasonal Tailwinds
Could spark a "year-end melt-up", as TradingView puts it, with a potential breakout in S&P 500 futures above the 6,900 area.
December-January has positive seasonality:
Holiday spending strong
Tax-loss selling done (Nov-early Dec)
January effect (fresh capital inflows)
Pension/401k rebalancing (buy equities)
Historically, S&P 500 averages +1.3% in December and +1.1% in January.
CATALYST #4: Institutional Positioning
Bloomberg's interviews with 39 investment managers show that most are still planning for a risk-on 2026, citing expectations of continued AI-driven productivity and earnings growth.
But here's the key: Asset managers such as EFG Asset Management and BNP Paribas Asset Management caution that with 2025 already a strong year, they are reluctant to increase equity exposure into thin year-end liquidity, preferring instead to wait for better entry points in early 2026.
Translation: Institutions are WAITING to buy. Any Fed-induced dip to 6,750-6,800 will be AGGRESSIVELY bought.
⚠️ Risk Factors - The Bear Case
RISK #1: Hawkish Powell Tanks Market
Feroli noted that the firm is anticipating at least two dissents in favor of no rate cut as well as one in favor of a larger rate cut.
If Powell leans hawkish to appease the dissenting hawks, market could drop 1-2%.
RISK #2: Tariff-Induced Inflation
Minutes mentioned Trump's tariff policies in forecasts they provided in early September, projecting higher inflation and unemployment, slower growth and a lower federal funds ratel.
If inflation accelerates in 2026 due to tariffs, Fed might have to HIKE again = very bearish.
RISK #3: Labor Market Deterioration
Employers cut more than 1.1 million jobs through November, the most since 2020 and a 54% increase from the same period a year ago.
If this accelerates, could trigger recession fears.
RISK #4: Technical Breakdown
Break below 6,620 = channel invalidated → target 6,500-6,550 (-4.5-5.2%)
🔥 The Bottom Line
Here's what I KNOW on December 8, 2025:
✅ 81% probability of 25bps cut Wednesday
✅ S&P 500 less than 1% from ATH
✅ Your ascending channel is PERFECT technical structure
✅ 39 investment managers planning risk-on 2026
✅ Corporate earnings strong (+8.7% YoY)
✅ Seasonal tailwinds (December +1.3% avg)
✅ Support at 6,750-6,800 = institutional buy zone
Here's what I DON'T know:
Will Powell be dovish or hawkish?
How many 2026 cuts will dot plot show?
Will Q&A reveal recession concerns?
But here's what the MATH says:
Risk: 6,862 → 6,620 = -3.5% (if channel breaks)
Reward: 6,862 → 7,050 = +2.7% (base case)
Extended: 6,862 → 7,150 = +4.2% (bull case)
Risk/Reward: 1:2.5 minimum
The Play:
Small position NOW at 6,860-6,870 (20-30% of intended size)
IF hawkish dip to 6,750-6,800 → ADD 50-70%
IF dovish → ADD on breakout above 6,910
Stop at 6,620 (non-negotiable)
Target 7,050, then 7,150
This is a PROBABILITY game. 60% dovish, 30% hawkish, 10% shock. Position accordingly.
📍 Follow officialjackofalltrades for institutional-grade technical analysis, professional risk management, and trades backed by data.
Drop a 📊 if you're trading the Fed decision.
Drop a 🎯 if this helped your ES1! analysis.
Drop a 💰 if you're ready for 7,000+ SPX.
US500 - 30MIN profile nuance and Cluster overlay viewUS500 - 30MIN profile nuance and Cluster overlay view.
Monitor if the value continue to build side ways inside last few days, note the highlighted data and markup prior to this level.
Leading upto FOMC - side ways balance vs flush down into clear the long inventory ?

ES | Week 50 | 1hr chartT.A explained -
BackSide (BS)
FrontSide (FS)
Inverse BS (Inv.BS)
Inverse FS (Inv.FS)
BS & FS levels are expected support when dashed lines, tested when dotted and resistance when solid lines.
The inverse is true for the Inv. BS Inv. FS levels, they are resistance as dashed lines, tested as dotted and support as solid lines.
Monthly timeframe is color pink
weekly grey
daily is red
4hr is orange
1hr is yellow
15min is blue
5min is green if they are shown.
strength favors the higher timeframe.
2x dotted levels are origin levels where trends have or will originate. When trends break, price will target the origin of the trend. its math, when the trend breaks, the vertex breaks too so the higher timeframe level/trend that breaks, the more volatility there could be as strength in the orders flow in to fuel the move.

why i quit forex for futures (and why you probably should too)i traded forex for about 3 years before switching to futures, and honestly i feel like an idiot for waiting so long.
CME_MINI:NQ1!
i see a lot of new guys asking "what's the difference?" so i wanted to break it down simply.
the big lie about forex is that when you trade "forex" on most retail brokers, you aren't trading the actual market. you are trading a cfd. basically, your broker is the casino. because there is no centralized exchange, the price on one broker might be different than the price on another. this means "hidden" spreads and weird slippage are rampant. you are playing in a decentralized pool where the big boys have way more info than you.
futures are cleaner because they trade on a centralized exchange like the CME. everyone sees the exact same price. everyone sees the exact same volume. there is no "broker A vs broker B" price difference.
the cost difference is huge too.
in forex, the "spread" is how the broker gets paid. it fluctuates. during news, it widens and stops you out. in futures, the spread is usually 1 or 2 tick. commissions are fixed and usually way cheaper if you are trading any decent size.
the data quality is the biggest one for me. in futures, you can see real volume data (order flow). in spot forex, "volume" is just tick volume (how many times price changed), not actual money changing hands.
it's useless for real analysis. anyway, not financial advice, just my 2 cents. if you are struggling with "stop hunts" in forex, try switching to futures. it felt like taking off training wheels for me.
anyone else make the switch recently?
CME_MINI:ES1!