NASDAQ 100 ABOUT TO TEST ALL TIME HIGH WITH UPTREND!Hey Traders so looking today at the Nasdaq 100 it's looking really bullish confirmed with 3 bar trendline.
However we are now approaching resistance of this all time high at 22,820 after bounce off support at around 21,500.
So I believe it's a good place to buy on pullback to trendline at around 21,900. This level is 50% of the last big candle with is showing strong bullish momentum.
With Stop under support around 21,400
As it approaches resistance it can do 3 things.
Break through, Pause, or Reverse so will be keeping on eye on how it reacts at that level.
So if bullish watch for pullback if bearish I would not short right now too much buying momentum or at least wait until market breaks suppport or trades below downtrend line.
Always use Risk Management!
(Just in we are wrong in our analysis most experts recommend never to risk more than 2% of your account equity on any given trade.)
Good Luck & Hope This Helps Your Trading 😃
Clifford
MNQ1! trade ideas

2025-06-25 - priceactiontds - daily update - nasdaq e-mini
Good Evening and I hope you are well.
comment: Market is leaving behind gaps and breakout prices are tested but we stay above. Also higher highs and higher lows. Max bullish for new ath still.
current market cycle: trading range
key levels: 21500 - 22300
bull case: Bulls want 23000. They have to keep it above 22400 to keep the max bullish momentum going for tomorrow. Below 22400 we could test down to 22200 before another leg up. Multiple way to draw the trend lines, all are correct until broken. So draw them and watch what market does when it gets near them.
Invalidation is below 22200.
bear case: Bears actually made money selling 22500, which was a surprise to me. Especially that we stay below the open price. Bad session for me today. I still got nothing for the bears until they print below 22200 again. Everything on this chart is bullish. Best bears can hope for is another pullback below 22500 and go sideways.
Invalidation is above 22550.
short term: Max bullish for 22800 or 23000.
medium-long term - Update from 2024-06-22: Daily close below 21500 is my validation for the new bear trend which has the first bigger target at 21000 but I think we will printed below 20000 again this year. Structure is obviously not yet bearish, so don’t be early if you want confirmation and can’t/won’t scale in to shorts higher. Getting into longer term shorts above 21500 seems like the banger trade right now.
trade of the day: Buying the double bottom 22390 or any long close to it. Wasn’t the trade with most profit but the most obvious one.

Automating Your Trading Pipeline: Series Overview
Hello fellow traders!
Over the next week I’ll be rolling out a short series on how to take your TradingView alerts all the way through to live orders—fully automated—using AWS and the Tradovate API.
Today’s post is just the big-picture overview. In the days ahead we’ll peel back the layers and show you exactly how each piece fits together:
TradingView PineScript Alerts: how to craft alert payloads in Pine.
AWS API Gateway web-hook: receiving and validating your alerts.
AWS Lambda Python – processing payloads & calculating SL and TP.
Tradovate REST API – placing bracket (OCO) orders.
Telegram Notifications – real-time trade confirmations to your phone.
At the end of this series you’ll have a fully-automated end-to-end pipeline, no more manual order entry!
Stay tuned for Part 2 , when we’ll dive into crafting precise JSON alerts in PineScript.

In the 2030's The Nasdaq 100 to 2X the Dow Jones.#CupandHandle don't fight the trend.
Technology vs Industrials.
AI
Robotics
Space Economy
Biotech
Artificial Super Intelligence to power GDP to insane levels.


NQ Power Range Report with FIB Ext - 6/25/2025 SessionCME_MINI:NQU2025
- PR High: 22412.00
- PR Low: 22384.50
- NZ Spread: 61.5
Key scheduled economic events:
10:00 | Fed Chair Powell Testifies
- New Home Sales
10:30 | Crude Oil Inventories
Session Open Stats (As of 12:35 AM 6/25)
- Session Open ATR: 372.52
- Volume: 18K
- Open Int: 253K
- Trend Grade: Neutral
- From BA ATH: -1.9% (Rounded)
Key Levels (Rounded - Think of these as ranges)
- Long: 22667
- Mid: 21525
- Short: 20383
Keep in mind this is not speculation or a prediction. Only a report of the Power Range with Fib extensions for target hunting. Do your DD! You determine your risk tolerance. You are fully capable of making your own decisions.
BA: Back Adjusted
BuZ/BeZ: Bull Zone / Bear Zone
NZ: Neutral Zone

4 Powerful, Daily Affirmations for Faith-Based TradersAffirmations make a huge difference.
But why?
It's because they shape our beliefs.
Whatever we think, affects what we say.
Whatever we say, affects what we do.
Whatever we do, is who we become and what our life actual looks like.
Repeat these affirmations daily and watch your life change before your eyes.
Wealth flows to me with ease as I walk in purpose.
I reject scarcity and embrace Kingdom abundance.
I am open to divine provision in expected and unexpected ways.
I have more than enough to thrive and to give.
Happy trading!
For those of you who are trading to make a bigger impact in the world, I am praying for you!

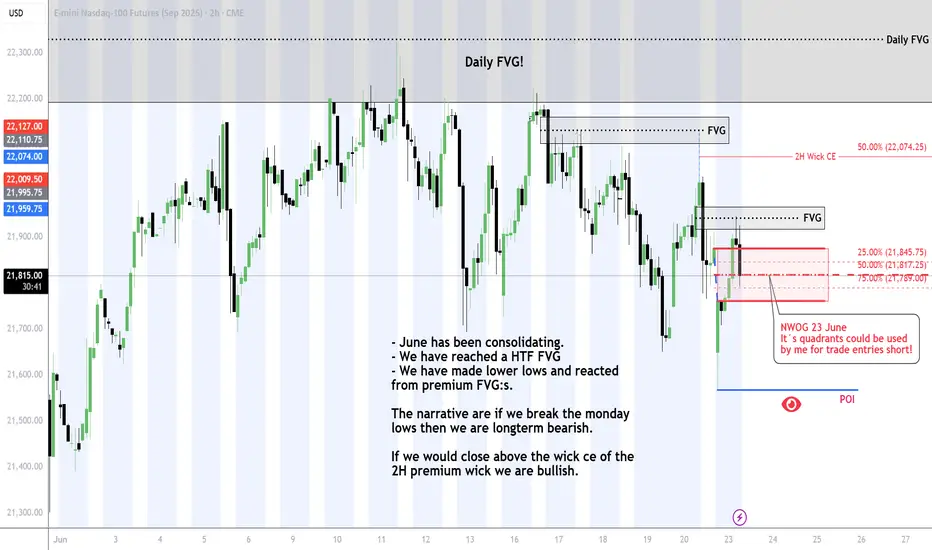
NQ Invalidated Bearish bias!We close above 2H wick CE and went for the Daily FVG. If we close this day, I´m bullish up to All Time Highs.

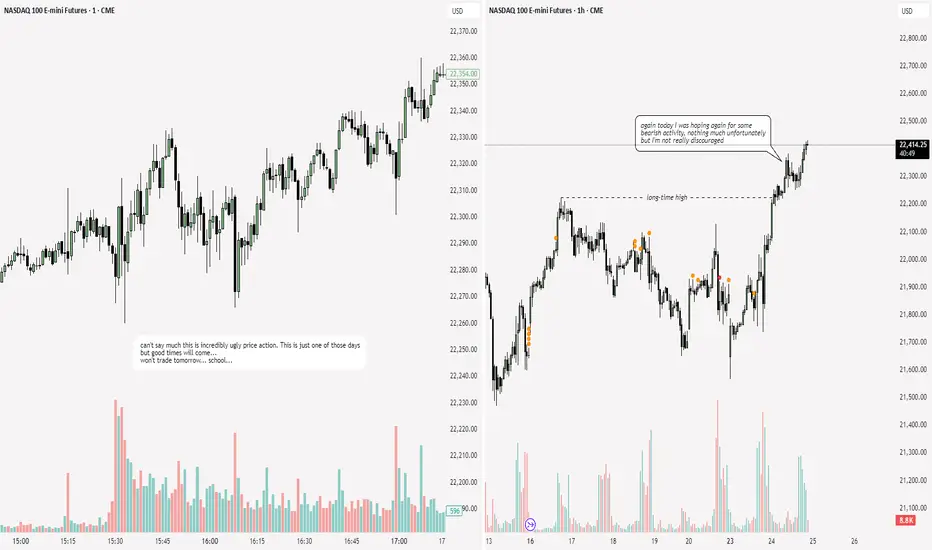
NQ: 209th trading session - recapToday wasn't the best day: My performance wasn't it tbh. Moreover I'm just really anxious about my future and I did NOT have it controlled during my session, not good.
Nasdaq Deep Bearish RetraceI Think we're going to retrace (potentially deeply) on FED release or just before it to then reverse aggressively higher.
I am considering the current "range" on m15 as re-distribution and expecting lower prices on Fed release or just prior before continuation higher that may be delayed till tomorrow next FED.

NQ Power Range Report with FIB Ext - 6/24/2025 SessionCME_MINI:NQU2025
- PR High: 22217.00
- PR Low: 22065.75
- NZ Spread: 337.75
Key scheduled economic events:
10:00 | CB Consumer Confidence
- Fed Chair Powell Testifies
Session Open Stats (As of 12:35 AM 6/24)
- Session Open ATR: 384.68
- Volume: 45K
- Open Int: 240K
- Trend Grade: Neutral
- From BA ATH: -2.8% (Rounded)
Key Levels (Rounded - Think of these as ranges)
- Long: 22096
- Mid: 20383
- Short: 19246
Keep in mind this is not speculation or a prediction. Only a report of the Power Range with Fib extensions for target hunting. Do your DD! You determine your risk tolerance. You are fully capable of making your own decisions.
BA: Back Adjusted
BuZ/BeZ: Bull Zone / Bear Zone
NZ: Neutral Zone

2025-06-23 - priceactiontds - daily update - nasdaq e-miniGood Evening and I hope you are well.
comment: Not even the US President joining a war can start the selling. Truly a special time. Above 22130 there is no reason this can’t test 22300 or higher. Market clearly does not care about the event and the pain trade seems up. Can’t hold bearish thoughts after today’s reversals. Very small chance that if we stay below 22130, bears come around and we test down to 21800 or lower.
current market cycle: trading range
key levels: 21500 - 22300
bull case: Bulls had the following legs up today: 380, 260, 350 points from swing lows to highs. On such a day, this is as bullish as it gets. They now need to print a higher high and then there is no more obvious reason why we can’t test back up to 22300 or higher.
Invalidation is below 21900.
bear case: Bears vanished after the double bottom in the US session and market closed at the high. Which is worst case for bears. Above 21130 they have to cover and I expect an acceleration upwards. If they somehow come around strongly and we go below 21950, then chances are decent that we can test down to 21800 again. Bears need to sell it early tomorrow or the bear trend line is gone and we could go much higher.
Invalidation is above 22130.
short term: Neutral. Only interested in shorts if we stay below 22130. I still think markets are grossly miss-priced and complacent but for now that thesis is wrong.
medium-long term - Update from 2024-06-22: Daily close below 21500 is my validation for the new bear trend which has the first bigger target at 21000 but I think we will printed below 20000 again this year. Structure is obviously not yet bearish, so don’t be early if you want confirmation and can’t/won’t scale in to shorts higher. Getting into longer term shorts above 21500 seems like the banger trade right now.
trade of the day: Buying literally every dip was good.

NQ Range (06-20-25)NAZ U Turn #45 or Bust, we have the Friday-Monday Long Rig test on deck. The F-M trade has been working for about a year and half, the break down here may be a big dipper. Watch the Tweet stall out and Reg Session selling, otherwise to the Moon with F-M lift.

MNQU2025 SELL IDEAMy bias for MNQ this morning with this trade of 2 contracts running. Would like to see price trade lower to 9:30am lows.
What do you guys think will happen? Will post results of the trade below.
Thanks for watching! Give a like if you enjoyed the explanation and a comment on what you'd like me to share with you guys about my trading journey.

ES/NQ Weekly LevelsES Weekly Levels:
Range: 5,937.01 - 6,109.29
Skew: +.86% 6,062.42
NQ Weekly Levels:
Range: 21,480.38 - 22,247.67
Skew: +1.06% 22,043.39

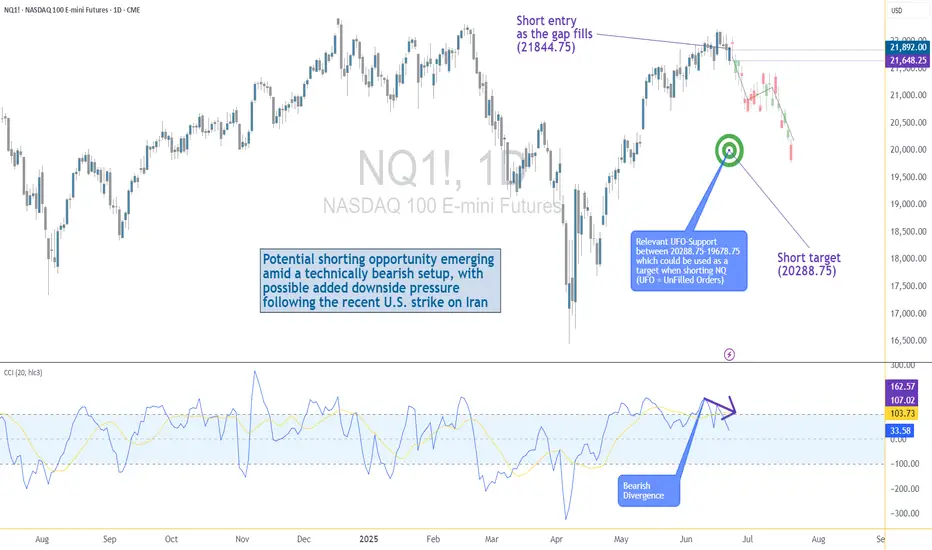
US–Iran Conflict Triggers a Potential Nasdaq Bearish Setup🟣 Geopolitical Flashpoint Meets Technical Confluence
The U.S. weekend airstrike on Iranian nuclear facilities has reignited geopolitical instability across the Middle East. While broader markets often absorb news cycles quickly, high-beta assets like Nasdaq futures (NQ) tend to react more dramatically—especially when uncertainty meets existing technical vulnerability.
Monday’s session opened with a notable gap to the downside, reflecting immediate risk-off sentiment among futures traders. While the initial drop is being retraced intraday, historical patterns suggest that such gap-fills can often serve as ideal shorting zones—particularly when other bearish signals confirm the narrative. The backdrop is clear: this is no ordinary Monday open.
🟣 Bearish Divergence on CCI Builds the Case
From a technical standpoint, the setup gains weight through a clear bearish divergence on the Commodity Channel Index (CCI) using a 20-period setting. While prices recently pushed higher, momentum failed to follow—an early indication that buyers may be running out of steam. This divergence appears just as price approaches the origin of Friday’s gap, a level that frequently acts as a resistance magnet in such contexts. This confluence of weakening momentum and overhead supply aligns perfectly with the geopolitical catalyst, offering traders a compelling argument for a potential reversal in the short term.
🟣 Gap Origin: The Line in the Sand
The origin of the gap sits at 21844.75, a price level now acting as potential resistance. As the market attempts to climb back toward this zone, the likelihood of encountering institutional selling pressure increases. Gap origins often represent unfinished business—zones where prior bullish control was suddenly interrupted. In this case, the added layer of global tension only strengthens the conviction that sellers may look to reassert dominance here. If price action stalls or rejects at this zone, it could become the pivot point for a swift move lower, especially with bearish momentum already flashing caution signals.
🟣 Trade Plan and Reward-to-Risk Breakdown
A potential short trade could be structured using 21844.75 as the entry point—precisely at the gap origin. A conservative stop placement would rest just above the most recent swing high at 22222.00, offering protection against a temporary squeeze. The downside target aligns with a prior UFO support area near 20288.75, where demand previously showed presence. This sets up a risk of 377.25 points versus a potential reward of 1556.00 points, resulting in a reward-to-risk ratio of 4.12:1. For traders seeking asymmetrical opportunity, this ratio stands out as a strong incentive to engage with discipline.
🟣 Futures Specs: Know What You’re Trading
Traders should be aware of contract specifics before engaging. The E-mini Nasdaq-100 Futures (NQ) represent $20 per point, with a minimum tick of 0.25 worth $5.00. Typical margin requirements hover around $31,000, depending on the broker.
For smaller accounts, the Micro Nasdaq-100 Futures (MNQ) offer 1/10th the exposure. Each point is worth $2, with a $0.50 tick value and much lower margins near $3,100.
🟣 Discipline First: Why Risk Management Matters
Volatility driven by geopolitical events can deliver fast gains—but just as easily, fast losses. That’s why stop-loss orders are non-negotiable. Without one, traders expose themselves to unlimited downside, especially in leveraged instruments like futures. Equally critical is the precision of entry and exit levels. Acting too early or too late—even by a few points—can compromise an otherwise solid trade. Always size positions according to your account, and never let emotion override logic. Risk management isn’t a side-note—it’s the foundation that separates professionals from those who simply speculate.
When charting futures, the data provided could be delayed. Traders working with the ticker symbols discussed in this idea may prefer to use CME Group real-time data plan on TradingView: www.tradingview.com - This consideration is particularly important for shorter-term traders, whereas it may be less critical for those focused on longer-term trading strategies.
General Disclaimer:
The trade ideas presented herein are solely for illustrative purposes forming a part of a case study intended to demonstrate key principles in risk management within the context of the specific market scenarios discussed. These ideas are not to be interpreted as investment recommendations or financial advice. They do not endorse or promote any specific trading strategies, financial products, or services. The information provided is based on data believed to be reliable; however, its accuracy or completeness cannot be guaranteed. Trading in financial markets involves risks, including the potential loss of principal. Each individual should conduct their own research and consult with professional financial advisors before making any investment decisions. The author or publisher of this content bears no responsibility for any actions taken based on the information provided or for any resultant financial or other losses.
NQ Power Range Report with FIB Ext - 6/23/2025 SessionCME_MINI:NQU2025
- PR High: 21787.00
- PR Low: 21566.75
- NZ Spread: 491.75
Key scheduled economic events:
09:45 | S&P Global Manufacturing PMI
- S&P Global Services PMI
10:00 | Existing Home Sales
Open weekend gap down ~0.33%
Session Open Stats (As of 12:45 AM 6/23)
- Session Open ATR: 382.81
- Volume: 38K
- Open Int: 234K
- Trend Grade: Neutral
- From BA ATH: -4.8% (Rounded)
Key Levels (Rounded - Think of these as ranges)
- Long: 22096
- Mid: 20383
- Short: 19246
Keep in mind this is not speculation or a prediction. Only a report of the Power Range with Fib extensions for target hunting. Do your DD! You determine your risk tolerance. You are fully capable of making your own decisions.
BA: Back Adjusted
BuZ/BeZ: Bull Zone / Bear Zone
NZ: Neutral Zone

Weekly Market Forecast: Wait To Buy S&P, NAS, & OIL!In this Weekly Market Forecast, we will analyze the S&P 500, NASDAQ, DOW JONES, Gold and Silver futures, for the week of June 22-28th.
The tensions in the Middle East take center stage, as Iran has signaled they are willing to discuss limitations on there Uranium enrichment program. This could allow outflows from safe havens and inflows to risk assets.
Keep and eye on Silver for shorts, in the near term, though.
Let's see if the market tilts its hand early next week. Monday should bring clarity.
Wait for confirmations before entering trades. A break of structure would be ideal! Enter on the pullback to that structure point.
Enjoy!
May profits be upon you.
Leave any questions or comments in the comment section.
I appreciate any feedback from my viewers!
Like and/or subscribe if you want more accurate analysis.
Thank you so much!
Disclaimer:
I do not provide personal investment advice and I am not a qualified licensed investment advisor.
All information found here, including any ideas, opinions, views, predictions, forecasts, commentaries, suggestions, expressed or implied herein, are for informational, entertainment or educational purposes only and should not be construed as personal investment advice. While the information provided is believed to be accurate, it may include errors or inaccuracies.
I will not and cannot be held liable for any actions you take as a result of anything you read here.
Conduct your own due diligence, or consult a licensed financial advisor or broker before making any and all investment decisions. Any investments, trades, speculations, or decisions made on the basis of any information found on this channel, expressed or implied herein, are committed at your own risk, financial or otherwise.

NQ Update 6.22.25NQ is currently sitting monthly and weekly supply zones.
On the weekly chart, price has consolidated upward but has mostly rejected every push into ATHs.
Note that there are still two untested highs with volumes of 2.336M and 3.392M sitting above. The last time price touched these points there was a 26.60% drawdown on SPY. Indicating lots of liquidity that could still be tapped before making a big move down, IF price decides to drop from here.
In addition to these bearish indicators, price is testing a monthly and weekly downtrend line while creating a head n shoulders pattern. Which could also be signaling a rejection of price.
Despite what I am seeing, I will treat price as if it is still bullish until market structure indicates otherwise.
On the daily timeframe, price can be seen to be clearing trending into a rising wedge. This chart pattern is known to be a bearish pattern but it can also signal a breakout continuation which is why it is important to wait for confirmation and never assume direction.
With price holding and sitting at the uptrend and downtrend on the LTFs, as well as 21,816 being a key area that price seems to be consolidated around. I will wait for price to break consolidation and choose a side before placing any trade on NQ.
If you MUST place a trade, do not place a trade until price moves above or below 21,922 and 21,775, respectively.

#202525 - priceactiontds - weekly update - nasdaq e-mini futuresGood Day and I hope you are well.
comment: Full bear mode. Below 21600 we see 21000 come real fast and bulls can kiss 22000+ goodbye for months or years. Market has not found enough buyers above 22000 for a month and we not got another potential huge risk-off event which will likely be too much for big institutions to ignore. Print above 22000/22100 means I am wrong.
Last week my bearish thesis was that we go down from last Friday but since market did not touch the daily ema for so long, we got another week sideways. Now bears got help from orange face and I can not see them coming back from this as well.
current market cycle: trading range - daily close below 21500 confirms my thesis
key levels for next week: 20900 - 21800
bull case: Still no close below daily ema but markets failed to print higher highs for 2 weeks now. If we gap down and print below 21500, you can not hold long on hope. Got nothing for the bulls unless they print above 22000 again and even then we can only expect sideways.
Invalidation is below 21500
bear case: I have laid out my bear case for the markets enough by now. I see a move below 21500 as confirmation and especially a daily close below. 21000 is the next obvious target before we can expect a pullback. 20400ish would be my next target below since that is the big bull gap close.
Invalidation is above 22000/22100
short term: Full bear mode. Expecting a big futures gap down on open and a daily close below 21500 if not 21000, which would mean we are in W1 which could be a spike and then only move sideways before W3 comes around. I have drawn a probably path down over the next weeks.
medium-long term - Update from 2024-06-22: Daily close below 21500 is my validation for the new bear trend which has the first bigger target at 21000 but I think we will printed below 20000 again this year. Structure is obviously not yet bearish, so don’t be early if you want confirmation and can’t/won’t scale in to shorts higher. Getting into longer term shorts above 21500 seems like the banger trade right now.

NQ: 207th trading session - recapPretty good end to a week. I'm completely focused on scalping for the next week.
I will be having my session everyday exepct wednesday: Schools just too long and I gotta stop skipping class or else my p.e teacher will actually catch on to it
