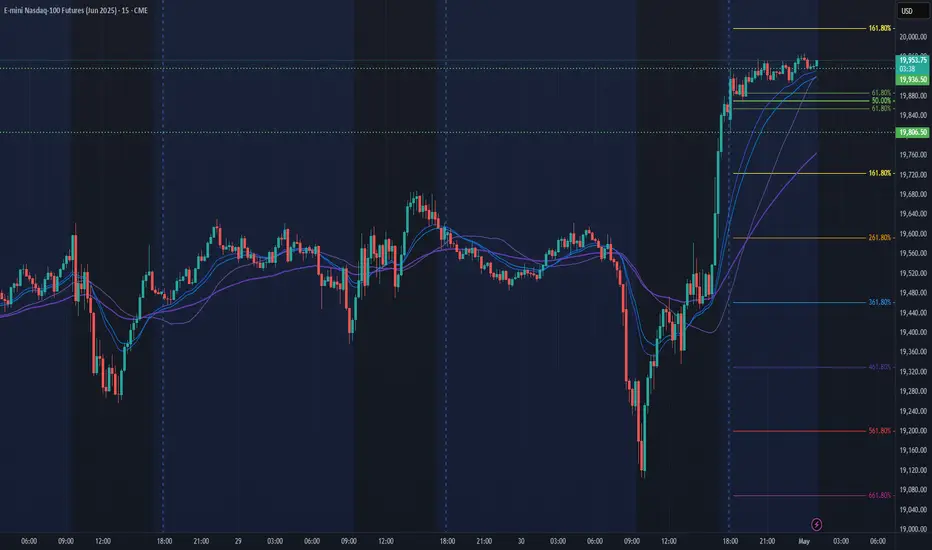
NQ Power Range Report with FIB Ext - 5/1/2025 SessionCME_MINI:NQM2025
- PR High: 19936.00
- PR Low: 19805.00
- NZ Spread: 292.5
Key scheduled economic events:
08:30 | Initial Jobless Claims
09:45 | S&P Global Manufacturing PMI
10:00 | ISM Manufacturing PMI
- ISM Manufacturing Prices
Wide previous session swing expanding week high and low
- Continuing to push highs back towards 20k
Session Open Stats (As of 12:25 AM 5/1)
- Session Open ATR: 662.61
- Volume: 47K
- Open Int: 241K
- Trend Grade: Bear
- From BA ATH: -11.9% (Rounded)
Key Levels (Rounded - Think of these as ranges)
- Long: 20954
- Mid: 19246
- Short: 16963
Keep in mind this is not speculation or a prediction. Only a report of the Power Range with Fib extensions for target hunting. Do your DD! You determine your risk tolerance. You are fully capable of making your own decisions.
BA: Back Adjusted
BuZ/BeZ: Bull Zone / Bear Zone
NZ: Neutral Zone
NQ1! trade ideas
NASDAQ - Point of Control - Stop and Up from here? This is the point of Control (most traded price) since the COVID crash.
Looks the same for the /YM Dow Jones continuous front month contract.
Why does this matter?
Because that is where the market stopped for COVID Crash - the point of control going back to 2008 GFC. (which I realized 6 months later) But NOT this time!
With that said - the /ES Futures are not quite to there - but interestingly and check yourself on a daily time frame the /ES Futures is at .618% Fib retracement.
That folks is confluence.
I'll it there for all to consider.

MAY 1ST - BULLISH IDEA - MNQ - NASDAQThe market seems to fill the 4 hours gap, and took al liquidity acumulated, now it's has all the path free to visit the daily bearish order block.

Nasdaq - In The Cards For Premium PricesIn comparison to S&P 500 and Dow Jones, Nasdaq is in the lead, steam rolling through short term buy stops this week which was a failure for ES and YM.
Going forward, i'd love to see how Sundays NWOG affects market structure and whether we continue to climb into the premium price range

NQ: 181st trading session - recapNothing happened today that was mentionable, wasn't really locked in today but I also wasn't expecting to trade so it is what it is ig. No coffee - that could've been why.

NASDAQ Analysis 07/100 with two trades The analysis is done with one long and one short trade. The first trade was closed at breakeven and second trade is in play. The GDP results came and they were totally opposite expectation, so the price has broken the channel in downwards direction.


NQ Power Range Report with FIB Ext - 4/30/2025 SessionCME_MINI:NQM2025
- PR High: 19611.75
- PR Low: 19563.25
- NZ Spread: 108.5
Key scheduled economic events:
08:15 | ADP Nonfarm Employment Change
08:30 | GDP
09:45 | Chicago PMI
10:00 | Core PCE Price Index (YoY|MoM)
10:30 | Crude Inventories
Maintaining inside print week range
Session Open Stats (As of 12:55 AM 4/30)
- Session Open ATR: 654.86
- Volume: 32K
- Open Int: 245K
- Trend Grade: Bear
- From BA ATH: -13.8% (Rounded)
Key Levels (Rounded - Think of these as ranges)
- Long: 20954
- Mid: 19246
- Short: 16963
Keep in mind this is not speculation or a prediction. Only a report of the Power Range with Fib extensions for target hunting. Do your DD! You determine your risk tolerance. You are fully capable of making your own decisions.
BA: Back Adjusted
BuZ/BeZ: Bull Zone / Bear Zone
NZ: Neutral Zone

2025-04-29 - priceactiontds - daily update - nasdaqGood Evening and I hope you are well.
comment: We see big bear spikes but no follow-through. Once every dip stalls, bears are out and bulls take over again and inching this higher. Tomorrow we either get a strong breakout above or below. As of now bulls are in full control, since bears have not traded below the prior’s day low for 6 consecutive trading days. Pain trade is up. Tomorrow is end of month, so I do think bulls want this monthly bar to be a big duck you to the bears and close it above 20000.
current market cycle: trading range
key levels: 19000 - 20000
bull case: Bulls want 20000. As long as they stay above 19379, they remain in control. Not a strong trend up but it’s making higher lows and higher highs. So buy pullbacks until it stops working. Do. Not. Buy. The. Highs.
Invalidation is below 19379.
bear case: Bears need to stop the higher highs and start making meaningful lower lows again. They are trying to get some selling going but on any decent resistance where market stalls, they run for the exits and bulls pump it higher. Bears are making money on selling new highs though. I turn bear again, once we drop below 19200. Neutral range is 19200 - 19700
Invalidation is above 19720.
short term: Can’t be anything but bullish. Bears could come around strongly any day, given that we only get bad news currently but so far, market does not care and we are squeezing hard. 20000 is the price to hit now.
medium-long term - Update from 2024-04-20: My most bearish target for 2025 was 17500ish, given in my year-end special. We are +18% from the lows and I do think, once this turns again, it will easily be the short trade of the year.
trade of the day: Buying the spike down below 19400 and betting on a lower high. Shorting 19600 was decent because you could have down it all day and made a duckton of money.

X2: NQ/US100/NAS100 Long - Day Trades 1:1.5X2:
Risking 1% to make 1.5%
NAS100, US100, NQ, NASDAQ Long for day trade, with my back testing of this strategy, it hits multiple possible take profits, manage your position accordingly.
Risking 1% to make 1.5%
Use proper risk management
Looks like good trade.
Lets monitor.
Use proper risk management.
Disclaimer: only idea, not advice

NQ Buyside IdeaTargetting that Asian session, After they stopped us out on a previous trade, once we traded above the NWOG and retested that 50% I entered once again expecting to find support. Final target being ASIAN Highs.

NQ: 180th trading session - recapI now exactly know what I need to do, I've categorized EVERYTHING. Took ya long enough.
For myself:
1. bearish opening
2. late bearish increase
3. strong bullish opening with higher timeframe setup/ fundamental confirmation
4. bearish tilted ranges.
I like bearish trades more than bullish ones, it's simple really. It's the fundamental idea behind it: People panic sell or sell because they want their contracts gone ASAP. People buy and wait. Price can go up now or in a few hours or whatever.
Bears move fast, bulls move slow, also on smaller timeframes, especially on slower timeframes.
Pair a bearish trend with fundamental price action and momentum as an entry signal and you got a great system.

NQ1! High Resistance Liquidity Run Market ProfileCME_MINI:NQ1!
Wanted to short NQ for daily FVG . Unable to get the draw after the displacement. Took two stops and stayed side lines for the rest of the day

NQ Live Trade Idea & ExecutionWhat's Up everyone! I know I have been MIA, but that's because I have been focusing on my learning and I realized that content creation takes away a lot of the time I have for that. Once in a while when I see something beautiful I will share it with you guys here. This trade was the perfect example of a beautiful trade idea and management. We were able to profit over $3,000
on a couple trades taken on NQ and this is 2 contracts that I had running, one was taken profit at the highs while the other was stopped out in profits. As you can see they are taking quite a while to go for those Asian highs so they are potentially building liquidity above I believe. We will have to wait and see what the market presents us.
We utilized a 15M Bullish FVG turned inverse as an entry on an earlier trade, then the NWOG 25% PDA level as a second entry and then again inside the NWOG another entry inside of a Bullish FVG turned IFVG as well which lined up perfectly with 50% of the NWOG as well.
These trades were all profitable and netted me over $3000 all together.

NQ1 - Might Pop SoonAnother tiny shakeout slump and another recovery.
These whipsawing moves can be printing a cause building coil.
Might pop soon I think - but there's always room for another shakeout 😅😃.
Not advice

NASDAQ ANALYSIS 06/100The analysis of NASDAQ is done with price still ranging on 15min/1hour time frame. Let's see the strong impact US news can break the range or not ? Specially the GDP news will be in focus.


NQ KEY ICT LEVELS - 29th APRIL 2025Levels marked on the chart using my free indicator which marks out all of the ICT key levels which can be used for potential POIs where price might react

NQ KEY LEVELS - 29th APRIL 2025Key levels marked by using low volume nodes for potential key levels where we may see price react.

$MNQ 4h Timeframe AnalysisEver since 24 Apr, we have been experiencing a wicky situation where we're squashed between the 1 Week Bearish Order block and the 4h Bullish FVGs.
Generally, in a consolidating range, I would expect any TP or SL to be less generous, we never know when we are going to go out from the range.
Even though we are expanding up, it is choppy, wicky, albeit. I consider this as consolidation.

MNQ - DAY TRADING - APRIL 29THToday we could have a range opening in the markets until the 9:30 am, 10:00 pm news. Both ideas long and short are expresed in the graphic with the reaction points.

nasdaq ready to fall cmp 19565-19600 rangewe can go short in nadaq cmp 19570-19600
sell order block still hold
we can see sharp fall from this level
most imp level to hold below 19630
short cmp 19570 - 19600
stoploss 19630 (60 points of risk)
target - 18800 (800 points of profit target)
Always respect our sl level focus on sell side trade untill it break 19630 sl level

NQ Power Range Report with FIB Ext - 4/29/2025 SessionCME_MINI:NQM2025
- PR High: 19490.25
- PR Low: 19455.50
- NZ Spread: 77.75
Key scheduled economic events:
10:00 | CB Consumer Confidence
JOLTs Job Openings
Session Open Stats (As of 12:35 AM 4/29)
- Session Open ATR: 685.67
- Volume: 32K
- Open Int: 245K
- Trend Grade: Bear
- From BA ATH: -13.7% (Rounded)
Key Levels (Rounded - Think of these as ranges)
- Long: 20954
- Mid: 19246
- Short: 16963
Keep in mind this is not speculation or a prediction. Only a report of the Power Range with Fib extensions for target hunting. Do your DD! You determine your risk tolerance. You are fully capable of making your own decisions.
BA: Back Adjusted
BuZ/BeZ: Bull Zone / Bear Zone
NZ: Neutral Zone
