December 1st action Hello,
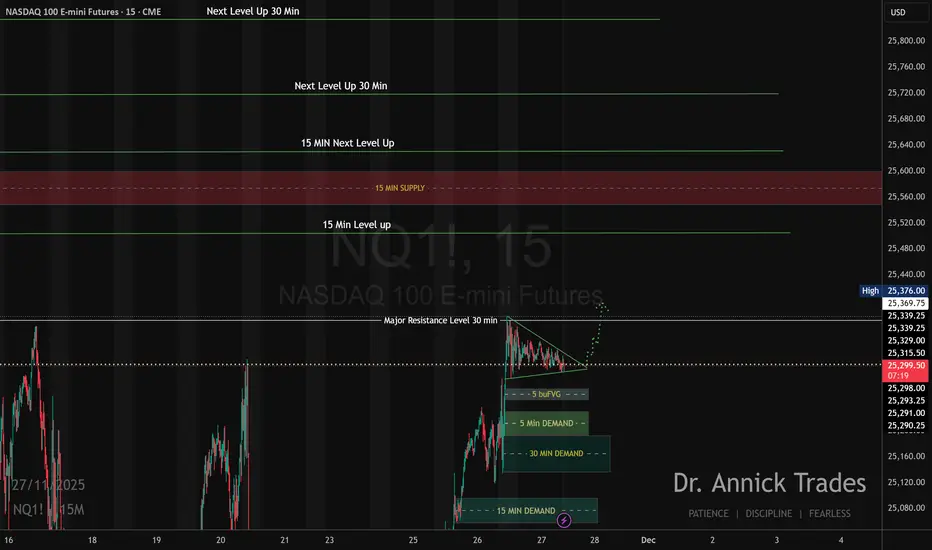
The market is at 25320 is right now.
The market will either go down to 25200-25000 first or it will go up to 25400-25500 before returning to 25200 on the 1st of December.
This is how the whales are planning to manipulate it today.
NASDAQ 100 E-mini Futures
No trades
Trade ideas
possible bounce NQ from trendlineNQ is testing a 4h symmetrical traingle line sfp frome here might deliver a bounce or otherwise we go lower.
NQ Power Range Report with FIB Ext - 12/1/2025 SessionCME_MINI:NQZ2025
- PR High: 25546.00
- PR Low: 25442.75
- NZ Spread: 230.25
Key scheduled economic events:
09:45 | S&P Global Manufacturing PMI
10:00 | ISM Manufacturing PMI
- ISM Manufacturing Prices
20:00 | Fed Chair Powell Speaks
Session Open Stats (As of 12:15 AM)
- Session Open ATR: 508.34
- Volume: 65K
- Open Int: 298.K
- Trend Grade: Long
- From BA ATH: -4.3% (Rounded)
Key Levels (Rounded - Think of these as ranges)
- Long: 26636
- Mid: 25410
- Short: 23426
Keep in mind this is not speculation or a prediction. Only a report of the Power Range with Fib extensions for target hunting. Do your DD! You determine your risk tolerance. You are fully capable of making your own decisions.
BA: Back Adjusted
BuZ/BeZ: Bull Zone / Bear Zone
NZ: Neutral Zone

NQ Daily Outlook | November 30, 2025Timeframe
1 Hour (1H)
EMAs Used
5 EMA
10 EMA
50 EMA
Market Structure
NQ is currently moving within a bullish impulse–correction sequence. Price has completed a correction after the last impulse and is pulling back into the area that formed the most recent break of structure. The 5, 10, and 50 EMAs are all aligned to the upside, maintaining bullish conditions.
What I Want to See
I want to see NQ transition out of this correction and begin the next impulse.
Bias
Bullish.

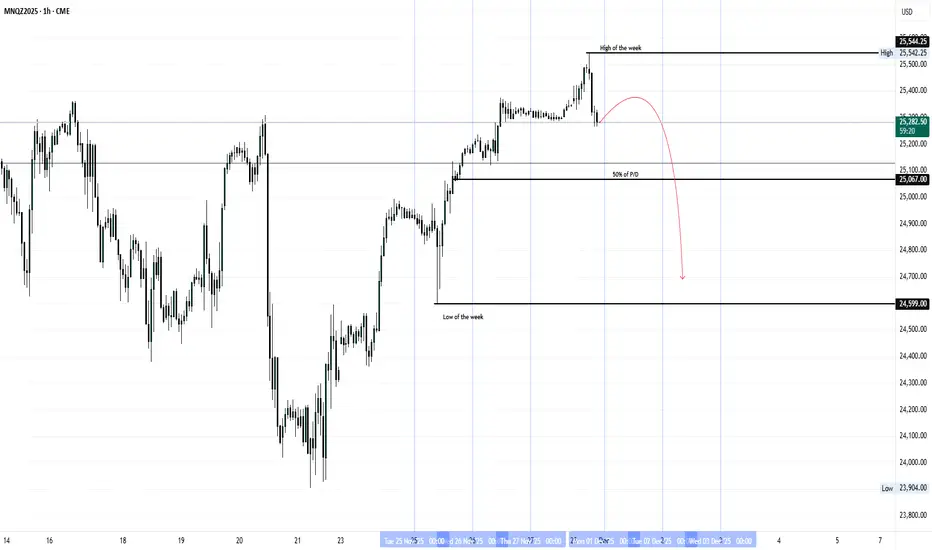
POSSSIBLE FORECAST MNZ2025For this week the highest probability is keep the Bearish scenarios to the prices 25062 porbavlu 24800, but we have to see high volatility this week, DO NOT trade on Tuesday and Wednesday try to avoid NFP is comming
NQ1! 1M Bearish ABCD harmonic pt2@12982NQ1 Bearish ABCD (represented with `~` icon in this chart) hit pt1 at 19465 after first JPN carry trade crisis, then bullish retracement up to 1.272, now projected to continue bearish to pt2 @ 12982 (or lower).

Take Profit trader 25,000 account challengescanning markets for set ups and asian presented a quick scalp!!!! check the video out on my journey to loss or profits!!

NQ Monday, 1 Dec to Sunday, 7 Dec trading weekly lookoutPrice has delivered to the downside and taken out massive sell side liquidity then railed higher causing market structure shift or it could be manipulation. From here we might continue to trade higher to external buyside liquidity then target lows or we could go down to take out some minor liquidity then rail higher to that buyside liquidity either way its likely going to be targeted.

Futures NQ strategy (NQ15BOS) A+ set up trade example.This is a example of a high probability trade for Nasdaq.
The strategy is tested on the 15m time frame specifically (must be applied on the 15m chart)
4 confluences must line up and check off before taking the trade for the trade to be A+.
(if there is only 3 confluences the trade becomes B set up, if there is only 2 confluences checking off then the trade is graded as C set up with the lowest probabilities)
leave comments with any questions you might have, thank you for watching.

Shipping, Freight, and Logistics Trading1. Introduction to the Global Shipping and Freight Ecosystem
Shipping and freight represent the physical movement of goods, while logistics covers the planning, coordination, and management that make this movement possible. Together, they form a vast network involving shipping lines, freight forwarders, port operators, customs agents, brokers, and traders. Globalization has made this sector indispensable: 90% of world trade moves through the maritime shipping industry.
Shipping is dominated by large vessels—tankers, container ships, bulk carriers—that transport everything from crude oil and LNG to electronics and automobiles. Freight, meanwhile, includes all modes of transportation—sea, air, road, and rail—often combined in multimodal systems. Logistics integrates these modes into a seamless flow, ensuring timely delivery, cost efficiency, and compliance with regulations.
2. How Shipping and Freight Markets Work
Shipping markets operate on supply and demand. Freight rates rise and fall depending on global trade volumes, vessel availability, fuel prices, geopolitical stability, and port congestion. For example:
When China increases steel production, demand for iron ore shipping rises.
If crude oil prices surge, tanker rates typically move higher.
Geopolitical tensions affecting key routes (like the Suez Canal or Red Sea) can cause disruptions and spike spot freight rates.
Freight markets are divided into two broad categories:
a. Spot Market
This is where vessels are chartered for immediate use. Rates fluctuate daily based on market conditions. Spot trading is common in container shipping and bulk carriers.
b. Contract Market
Long-term contracts (time charters, voyage charters) offer stable pricing and predictable supply. Large corporations rely on these for consistent supply chain operations.
Traders, shipping companies, and brokers constantly analyze these markets to capture opportunities in freight rate movements.
3. Types of Freight: Sea, Air, Road, and Rail
1. Sea Freight
Sea freight is the most cost-effective method for bulk goods. There are three core vessel types:
Dry bulk carriers (coal, grain, iron ore)
Tankers (crude oil, petroleum products, LNG)
Container ships (consumer goods, electronics, machinery)
Shipping trading is most active in this segment due to volatile freight rates.
2. Air Freight
Air freight is used for high-value or time-sensitive goods. It is expensive but essential for pharmaceuticals, electronics, perishables, and emergency shipments.
3. Road Freight
Road transport handles last-mile delivery and short- to medium-distance cargo. Trucking markets also have spot and contract rates influenced by fuel prices and driver availability.
4. Rail Freight
Rail is efficient for heavy industrial cargo—coal, steel, fertilizer, and automobiles. It plays a vital role in countries with large landmass, such as India, China, and the U.S.
4. Logistics: The Strategic Framework Behind Freight
Logistics is the science and strategy behind moving goods. It includes:
Inventory management
Warehousing
Distribution planning
Route optimization
Customs clearance
Packaging
Order fulfillment
Supply chain visibility
Advanced logistics uses technology such as GPS tracking, IoT sensors, warehouse automation, robotics, drones, and AI-driven demand forecasting.
Companies like DHL, FedEx, Maersk Logistics, and UPS are leaders in global logistics, providing end-to-end supply chain solutions.
5. Freight and Shipping Trading Markets
Trading in shipping and freight occurs through:
a. Physical Freight Trading
Actual cargo shipments are bought and sold. Traders negotiate:
Freight rates
Vessel chartering
Cargo booking
Port handling
Physical traders manage logistics for commodities like oil, LNG, coal, metals, grains, and chemicals.
b. Forward Freight Agreements (FFAs)
FFAs are financial instruments used to hedge against future freight rate fluctuations. They cover routes such as:
Baltic Dry Index (BDI)
Capesize, Panamax, Supramax segments
Tanker routes (VLCC, Suezmax, Aframax)
FFAs allow traders, ship owners, and charterers to lock in future freight rates, reducing exposure to volatility. They are settled in cash based on index prices.
c. Container Freight Rate Trading
This segment has grown due to global supply chain disruptions. Indices like:
Freightos Baltic Index (FBX)
Shanghai Containerized Freight Index (SCFI)
allow companies to hedge container shipping costs.
d. Logistics Derivatives
Emerging financial products that allow hedging warehousing costs, trucking rates, and port congestion costs.
6. Key Drivers of Shipping, Freight, and Logistics Prices
1. Global Trade Cycles
Economic expansion increases cargo flows, while recessions reduce demand.
2. Fuel Prices
Bunker fuel costs heavily influence freight rates.
3. Capacity and Fleet Supply
An oversupply of vessels leads to low shipping rates; undercapacity pushes rates up.
4. Geopolitics
Conflicts near major routes (Red Sea, Strait of Hormuz, Taiwan Strait) disrupt shipping lanes.
5. Port Congestion
Delays in ports such as Shanghai, Los Angeles, or Rotterdam cause freight surges.
6. Weather and Natural Disasters
Monsoons, hurricanes, and cyclones affect shipping schedules and capacity.
7. Regulations
IMO emission rules increase operational costs, influencing freight rates.
7. Major Players in Shipping and Logistics Trading
Shipping Lines – Maersk, MSC, CMA CGM, Hapag-Lloyd
Freight Forwarders – DHL Global Forwarding, Kuehne + Nagel
Commodity Traders – Glencore, Trafigura, Vitol, Cargill
Port Operators – DP World, PSA International, Adani Ports
Brokerage Firms – Clarksons, Simpson Spence Young
Logistics Integrators – FedEx, UPS, Maersk Logistics
These players create an interconnected ecosystem facilitating global commerce.
8. How Traders Participate in This Market
Shipping and freight traders engage through:
a. Speculating on Freight Rates
Buying FFAs when expecting rates to rise or selling when expecting a fall.
b. Chartering Vessels
Traders take vessels on time charter and sub-charter them at higher spot rates.
c. Cargo Arbitrage
Buying commodities in cheaper markets and shipping them to higher-priced regions.
d. Operational Trading
Managing logistics for commodity trades to optimize cost and efficiency.
e. Hedging Freight Exposure
Manufacturers and exporters use freight derivatives to lock in shipment costs.
9. Future Trends in Shipping, Freight, and Logistics Trading
1. Digitalization and AI
AI-powered routing, predictive freight pricing, and automated documentation.
2. Green Shipping
Zero-emission fuels such as ammonia, hydrogen, LNG, and methanol will transform operating costs.
3. Blockchain for Documentation
Digital bills of lading reduce fraud and speed up transactions.
4. Autonomous Vessels and Drones
Expected to reduce manpower dependency and increase operational precision.
5. Supply Chain Resilience
Companies are shifting to multi-route strategies after disruptions like COVID-19 and geopolitical tensions.
Conclusion
Shipping, freight, and logistics trading form the circulatory system of the global economy. From physical movement of goods to financial trading of freight derivatives, this sector is essential to global trade, commodity markets, and economic stability. Understanding how freight rates work, how logistics integrates each stage of movement, and how traders participate in these markets provides a powerful foundation for anyone interested in global commerce or financial markets.

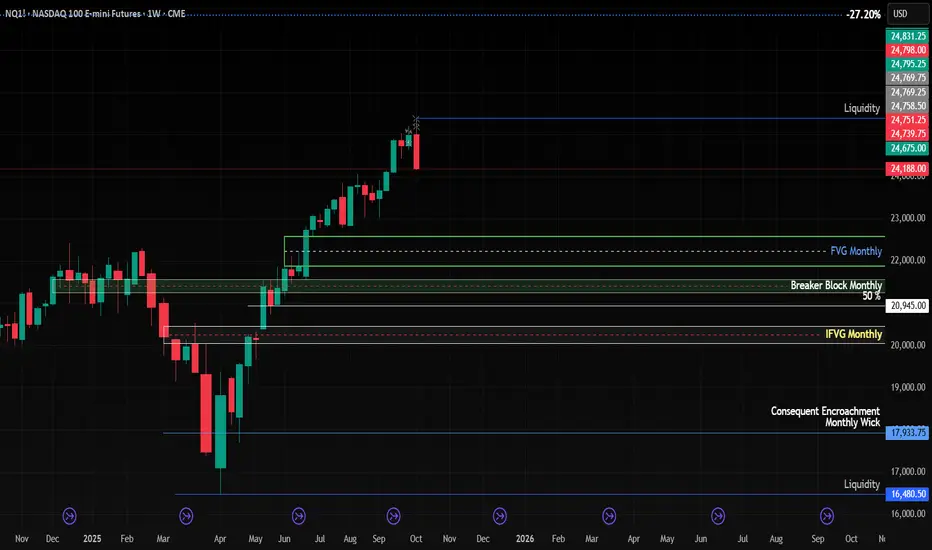
NQOn the monthly, we can see that price took out last month’s lows and rejected strongly, creating a failed 2-down that could potentially go outside — but we’ll see. If we get the strength to push higher, I’m ready, and if we collapse, I’m ready for that too.

Possibly Bearish Nasdaq has push above a major zone this weekend and currently at the neckline of that 4HR H&S so if price fall back below that major zone I can see sellers come into play and push it lower.

Global Currency Shifts1. The Foundations of Currency Movements
A currency’s value is determined by supply and demand in the foreign exchange (forex) market. Factors influencing this include:
Interest rates: Higher rates attract foreign capital, strengthening a currency.
Inflation: Lower inflation preserves purchasing power, boosting currency value.
Economic growth: Strong GDP performance increases investor confidence.
Trade balances: Surpluses strengthen currencies; deficits weaken them.
Political stability: Nations with transparent governance attract safer inflows.
Market sentiment: Sometimes fear and speculation drive rapid shifts.
Because all major economies interact, a shift in one currency often provokes adjustments in others.
2. Historical Context of Currency Shifts
Global currencies have never been static—they evolve with economic power. For instance:
The British pound dominated the 19th and early 20th centuries, supported by Britain’s status as the global industrial and colonial power.
The U.S. dollar emerged post-World War II, formalized through the Bretton Woods system in 1944. The U.S.’s economic scale, gold reserves, and geopolitical influence made the dollar the primary reserve currency.
Floating exchange rates began in the 1970s after the collapse of Bretton Woods, allowing currencies to fluctuate more freely.
Since then, currency power has correlated strongly with economic dominance, financial innovation, and political alliances.
3. The Current Dollar-Dominated Landscape
Today, the U.S. dollar is the world’s anchor currency. It is:
The primary reserve currency, held by central banks globally.
The default currency for international trade, especially in commodities like oil.
The most liquid financial currency, underpinning capital markets, bonds, and global banking.
Because of this dominance, shifts in the dollar—strengthening or weakening—ripple across the world. A strong dollar hurts emerging markets by increasing borrowing costs, while a weak dollar boosts global liquidity and risk assets.
However, the dollar’s dominance is increasingly challenged.
4. Drivers Behind Modern Global Currency Shifts
a. Economic Power Shifts
As nations rise economically, their currencies gain relevance. China’s rapid ascent over the past three decades has positioned the renminbi (yuan) as a serious contender, particularly in Asia and among emerging economies.
b. Trade Realignments
As supply chains become more regional (e.g., India, Vietnam, ASEAN), local currencies gain usage in trade settlements. The shift away from China-centric manufacturing has also influenced currency dynamics.
c. De-dollarization Efforts
Countries facing geopolitical tensions with the U.S.—Russia, Iran, parts of Africa, Middle East, and even groups within BRICS—are exploring non-dollar trade settlements.
This is driven by:
U.S. sanctions exposure
Desire for economic autonomy
Rising multipolar geopolitics
While de-dollarization is gradual, it reflects a broader shift toward diversified currency use.
d. Central Bank Digital Currencies (CBDCs)
Digital versions of national currencies are reshaping cross-border payments. China’s e-CNY is the most advanced CBDC globally, potentially accelerating yuan adoption. Many countries are experimenting with CBDCs to reduce reliance on traditional dollar-based settlement systems like SWIFT.
e. Global Debt Dynamics
Countries with high external debt are sensitive to currency depreciation. When global rates rise (like the U.S. Fed hikes), currencies of indebted nations weaken simultaneously, shifting the global balance.
f. Commodity Cycles
Resource-rich nations benefit during commodity booms. For example:
Australian and Canadian dollars strengthen during metal and energy upcycles.
Middle Eastern currencies benefit from oil price surges.
Commodity cycles are a repeating driver of currency shifts.
5. The Rise of New Currency Blocs
The world is gradually moving toward a multipolar currency environment, defined by:
a. The Dollar Bloc
Comprising the U.S., Europe, Japan, South Korea, and much of the global financial system.
The dollar remains the backbone due to trust, technology, liquidity, and stability.
b. The Renminbi Bloc
Centered on China’s trade relationships.
China is:
Leading in manufacturing
Expanding Belt and Road investments
Signing bilateral currency swap agreements
This increases RMB usage in Asia, Africa, and Latin America.
c. Regional Digital and Trade Currencies
Efforts like:
Gulf Cooperation Council (GCC) unified currency proposals
Africa’s AfriExIM settlement systems
India’s rupee-based trade settlement agreements
These signify regional alternatives gaining traction.
6. Impacts of Currency Shifts on the Global Economy
a. Trade Competitiveness
Currency appreciation makes exports expensive, hurting trade balance.
Depreciation boosts exports but increases import costs.
Governments often intervene to stabilize such effects.
b. Inflation and Purchasing Power
Weakening currencies raise the price of imported goods, fueling inflation.
Countries dependent on energy or food imports are particularly vulnerable.
c. Fiscal and External Debt Pressure
Nations with dollar-denominated debt face larger repayments when their currency weakens, triggering financial stress.
This dynamic has played out repeatedly in:
Latin America
Turkey
Sri Lanka
Sub-Saharan Africa
d. Global Investment Flows
Currency expectations shape capital movement:
Strong currencies attract foreign investment
Weak currencies lead to capital flight
Portfolio flows respond quickly to perceived risk.
e. Geopolitical Influence
Currencies are not just economic tools—they are instruments of power.
The ability to:
enforce sanctions
influence global lending
set financial rules
gives reserve-currency nations significant geopolitical leverage.
7. The Future of Global Currency Shifts
Several trends are set to define the next decade:
a. A Gradually Declining U.S. Dollar Share
Not a collapse, but a slow reduction as alternatives emerge.
b. Yuan Becoming a Trade and Commodity Settlement Currency
China’s influence continues to grow, but capital controls limit full convertibility.
c. Digital Currencies Reshaping Payments
Cross-border CBDC platforms may reduce costs and bypass the dollar-centric network.
d. Strengthening of Regional Currencies
As countries diversify supply chains and rewire trade, local currencies gain influence.
e. Increased Volatility
Geopolitical polarization, climate risk, and faster economic cycles will likely cause more frequent currency swings.
8. Conclusion
Global currency shifts are deep, complex, and constant. They reflect changes in economic strength, political alignments, technological progress, and global trade structures. While the U.S. dollar remains dominant, the world is clearly moving toward a more diversified, multipolar currency landscape. China’s rising economic power, the adoption of digital currencies, and regional cooperation are slowly reshaping how nations transact and interact. These shifts will continue to influence global markets, investment flows, and geopolitical strategies in the decades ahead.

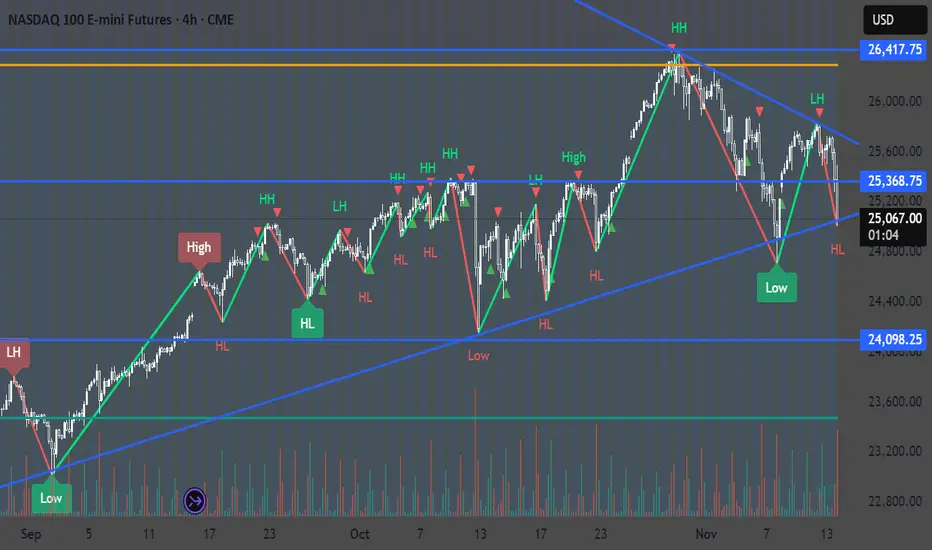
Key levels for reversals back to the upsideI’ve marked key levels where I believe the market could potentially reverse to the upside, allowing the bull run to resume. Of course, fundamentals and news can quickly change the market’s direction, but this represents my current technical analysis that I’ll be monitoring closely.

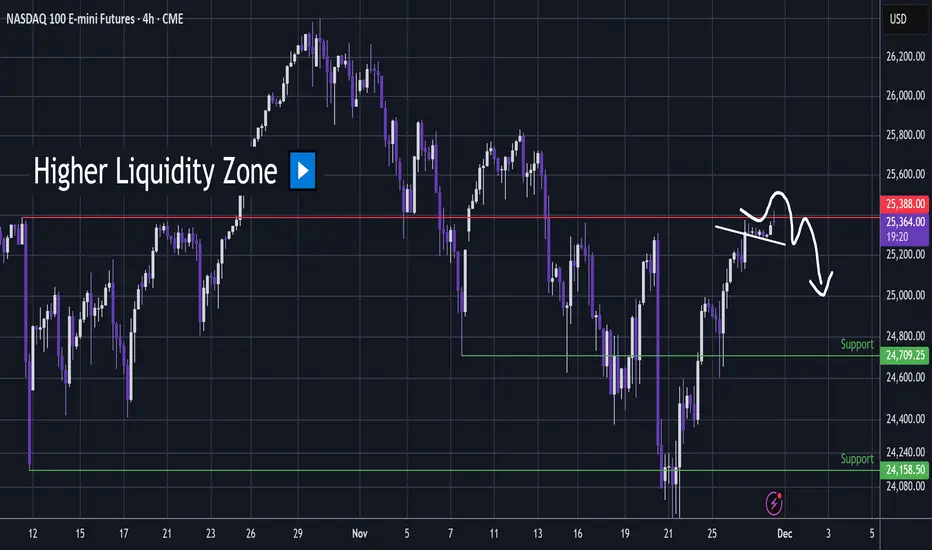
NQ1 - Bot Favourite Topping Pattern ?NQ1 Indices1
Notice the little descending line before the pop underway.
This is quite a bot favourite topping pattern with the textbook bullish pattern leading to a slightly higher high liquidity sweep - which here is into the higher liquidity zone above resistance.
So it is somewhat setting up for a pull back.
But until we see some upper wicks, I remain neutral 🧐.
NQ Week 48 T.A explained -
BackSide (BS)
FrontSide (FS)
Inverse BS (Inv.BS)
Inverse FS (Inv.FS)
BS & FS levels are expected support when dashed lines, tested when dotted and resistance when solid lines.
The inverse is true for the Inv. BS Inv. FS levels, they are resistance as dashed lines, tested as dotted and support as solid lines.
Monthly timeframe is color pink
weekly grey
daily is red
4hr is orange
1hr is yellow
15min is blue
5min is green if they are shown.
strength favors the higher timeframe.
2x dotted levels are origin levels where trends have or will originate. When trends break, price will target the origin of the trend. its math, when the trend breaks, the vertex breaks too so the higher timeframe level/trend that breaks, the more volatility there could be as strength in the orders flow in to fuel the move.

NQ UpdateOdd that MFI went up on no movement
At this point, I'm mostly cash. My favorite long play was GM calls, and that looks topped out.
Not sure about NQ, but I think ES will double top, so no put options for now. I did think about buying GM puts but decided not to.
FVG Reversal Play – NASDAQ 100 Futures [NQ1!]CME_MINI:NQ1! FVG Reversal Play – NASDAQ 100 Futures
Signal: 🟢 BUY
Entry: 25,106.00TP1: 25,327.75TP2: 25,376.00TP3: 25,500.00SL: 24,924.50
Insights:
Price retraced into a Fair Value Gap (FVG) and sits near the 0.618–0.705 Fibonacci cluster, aligning with high-volume nodes on VRVP.
RSI is recovering from oversold territory, MACD histogram shows bullish divergence, and price is near the 200 MA support zone.
Strong confluence across all indicators suggests a potential bullish reversal from a liquidity sweep zone.
🌟 Trade Like Hunter (for professional edge)
✅ High-Probability Setup:
VRVP shows volume concentration at entry zone
MA acts as dynamic support
RSI and MACD signal bullish momentum shift
📊 Risk-Reward Ratio:
R:R ≈ 2.5:1 (TP2), up to 3.5:1 (TP3)
🔑 Liquidity Zone Confirmation:
Entry aligns with imbalance zone and previous demand sweep
🧠 Market Psychology:
Signs of accumulation post-selloff; potential breakout momentum building
⚡ Probability Score:
80% High Probability
📈 Scalability:
Setup aligns with 1H and Daily timeframes for broader confirmation
🔒 Risk Disclaimer:Always use proper risk management. Past performance does not guarantee future results. Trade responsibly.
@LunaGoldHunter

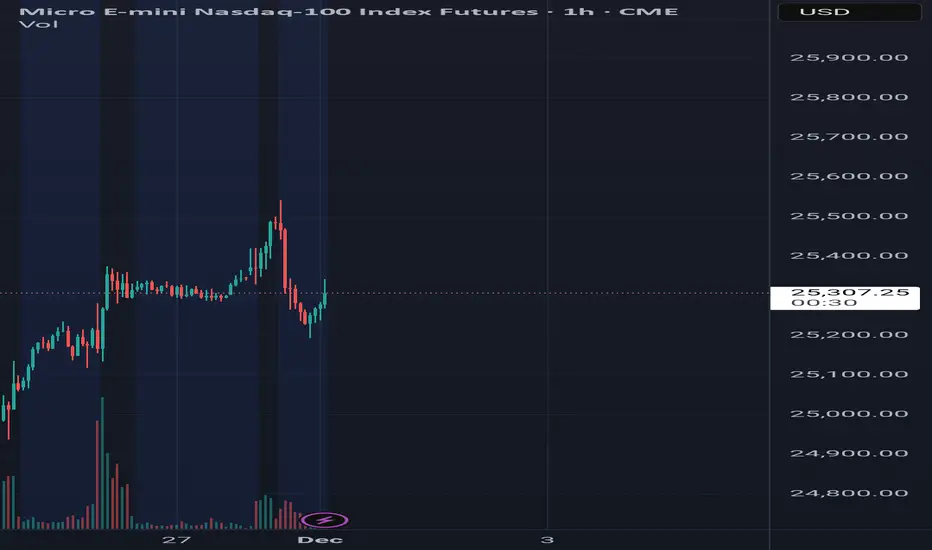
Thanksgiving NQ LevelsNasdaq-100 E-mini futures are trading near 25,318 this morning, showing a modest rise driven by growing optimism about a potential Federal Reserve rate cut in December. This momentum follows renewed strength in major tech names—especially AI-linked stocks—which has helped lift the broader Nasdaq Composite over the past several sessions. With expectations of lower rates, dovish Fed signals, and improving confidence in growth and tech sectors, the near-term outlook points toward continued upside or steady consolidation at current levels. However, gains may be capped if enthusiasm around AI fades or if upcoming economic data weakens the argument for rate easing.
Happy Thanksgiving to you all
Gobble, gobble!!
NQ1! – Bearish Descending Channel, Short Setup Active Nasdaq 100 futures remain trapped inside a bearish descending channel on the 4H chart after failing to reclaim the 25,500 zone.
Key points: Series of lower highs along the blue upper trendline
Strong rejection every time price touches the channel top
Support cluster 25,000–24,800 tested multiple times but showing weakening bounces
RSI slipping toward oversold, but momentum still favors sellers
Bearish plan
Current price rejecting the upper channel again around 25,300–25,320
→ Short entry zone 25,280–25,320
Target 1: 25,000
Target 2: 24,800 (lower channel boundary)
Target 3: 24,500 (channel breakdown target)
Stop-loss above 25,450 (clear invalidation)
Risk/Reward → 1:1.8 average Bullish reversal only on strong break and close above 25,400–25,450 with volume (then first target 25,800). As long as we stay inside this channel, bias is short. Holiday-thinned liquidity can accelerate the move on Friday open.
Short setup live.

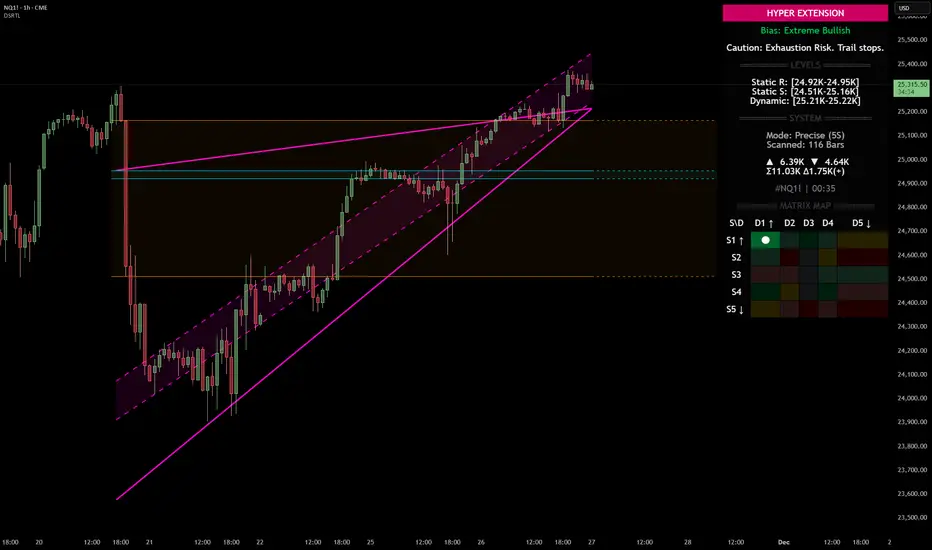
Nasdaq 100 (NQ): Hyper-Extended Momentum – Breakout or Exhaust
Category: Trend Analysis / Support & Resistance
Ticker: NQ1! (CME)
Analysis:
We are looking at the Nasdaq 100 Futures (NQ1!) on the 1H timeframe using the Dynamic Support & Resistance (DSRTL) system. The market is currently displaying a textbook example of a high-momentum breakout that has pushed into statistical extremes.
Here is the breakdown of the current technical landscape based on the indicator's Matrix Logic:
1. The "Hyper Extension" State (S1 / D1)
The indicator’s dashboard has triggered a "HYPER EXTENSION" alert. This specific state occurs when two conditions are met simultaneously:
• Static Breakout (S1): Price has cleared the horizontal resistance structures (indicated by the volume clusters).
• Dynamic Overextension (D1): Price has pierced above the upper limit of the dynamic trend channel (the purple trendlines).
2. Bias: Extreme Bullish
The current bias is rated as "Extreme Bullish". The trend is undeniably strong, confirmed by the positive Volume Delta (+965) shown on the dashboard. The price action is aggressive, creating a steep angle of ascent that has moved away from the mean.
3. The Warning Signal: Exhaustion Risk
While the trend is up, the system issues a cautionary note: "Exhaustion Risk. Trail stops."
In technical terms, when price action moves into "D1" (Dynamic Overextension), it indicates that the asset is trading significantly above its standard deviation or channel geometry. Historically, markets often seek mean reversion or consolidation after such rapid expansions to sustain the trend.
Key Levels to Watch:
• Dynamic Support (Immediate): The top of the purple channel (approx. 25,220) acts as the first layer of defense. A retest of this level is common after a breakout.
• Static Support (Structural): The breakdown level of the previous resistance, now turning into support around the 24.95K region.
Scenario Conclusion:
This is a pure momentum play. Traders should be aware that while the path of least resistance is up, the probability of a "snap-back" or consolidation increases the further price stretches above the dynamic channel. This is not a signal to short the trend immediately, but rather a signal to manage risk tightly on existing long positions.
Disclaimer: This analysis is for educational purposes only and explains the logic of the DSRTL technical indicator. It does not constitute financial advice.