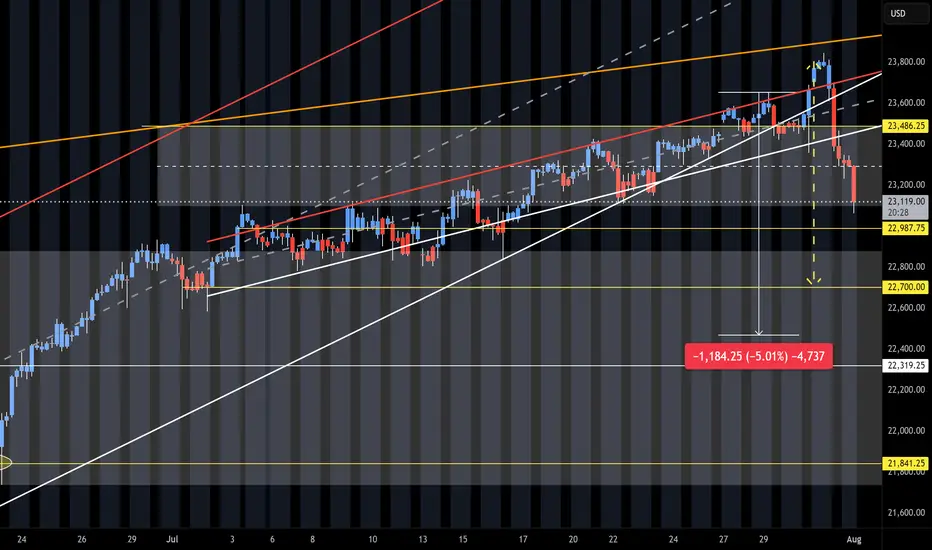
NQ Short (08-01-25)The 5% pull back is playing out. We had the heavy selling after the O/N Pump/Dump into the selling of the Reg Session and Outside Day Reversal. Up for weeks and down in hours. Next break down will have to be the failure of the long standing Friday into Monday Long Play. We did get the reg session se
Related futures
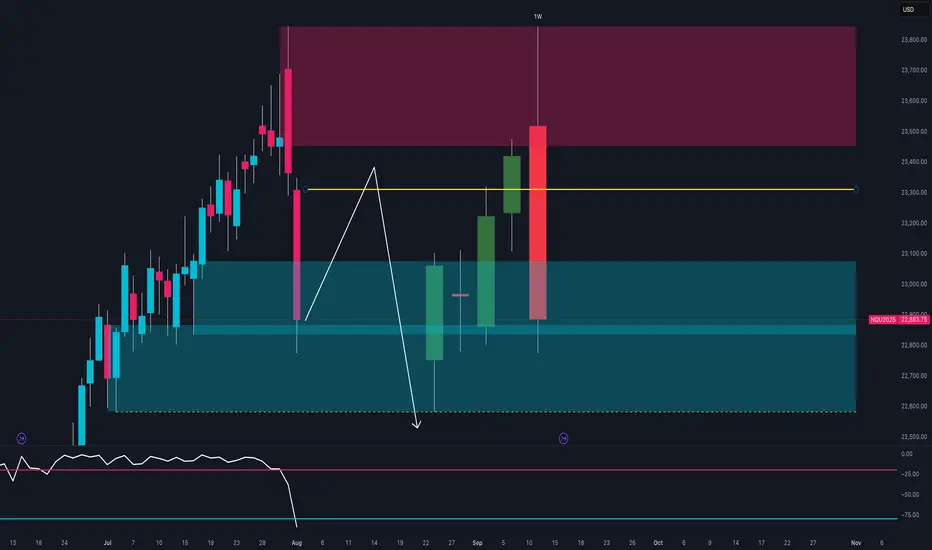
NASDAQ at Key Turning Point 🔍Technical Context
After testing the 23,600–23,800 supply zone, price printed a strong bearish rejection with a weekly engulfing candle.
The RSI broke decisively below the midline, signaling a clear loss of momentum.
Price is now trading back within the weekly demand zone between 22,800 and 22,950
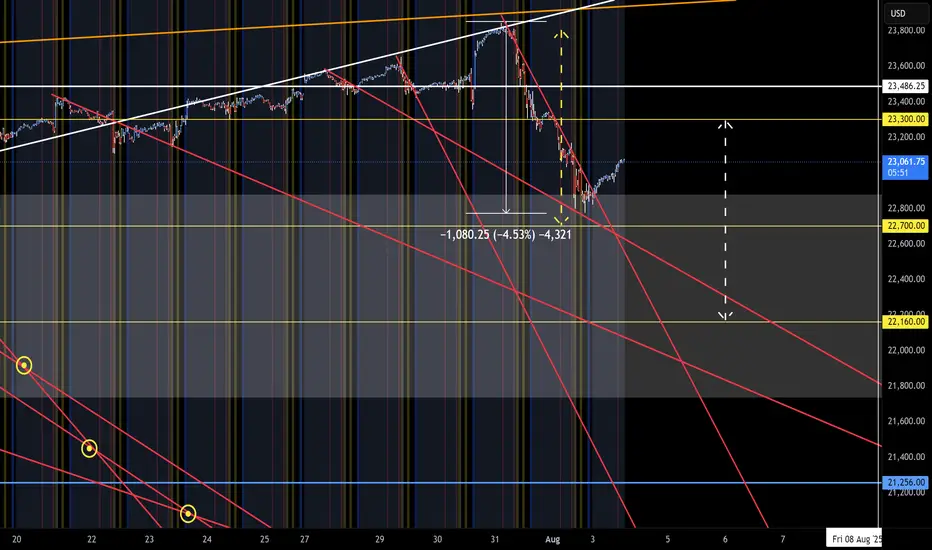
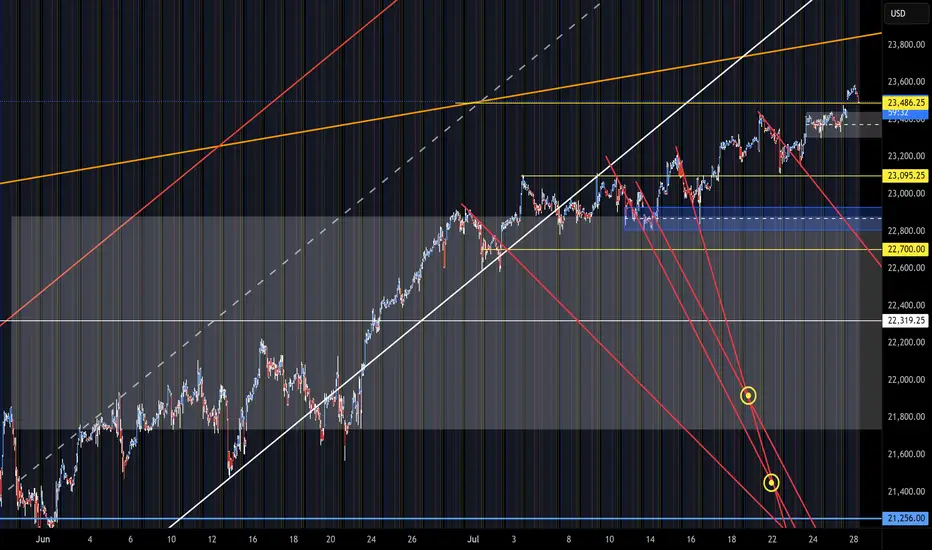
NQ Targets (08-04-25)Many calls did play out last week and looking for some targets to get tested this week. On 7/29 called the Yellow arrow (last week's called range), the white is this week's. NDX has some gaps to retest, YTD chart below and yellow arrows are the targets.
The 30M and 4HR charts are adjusted to matc
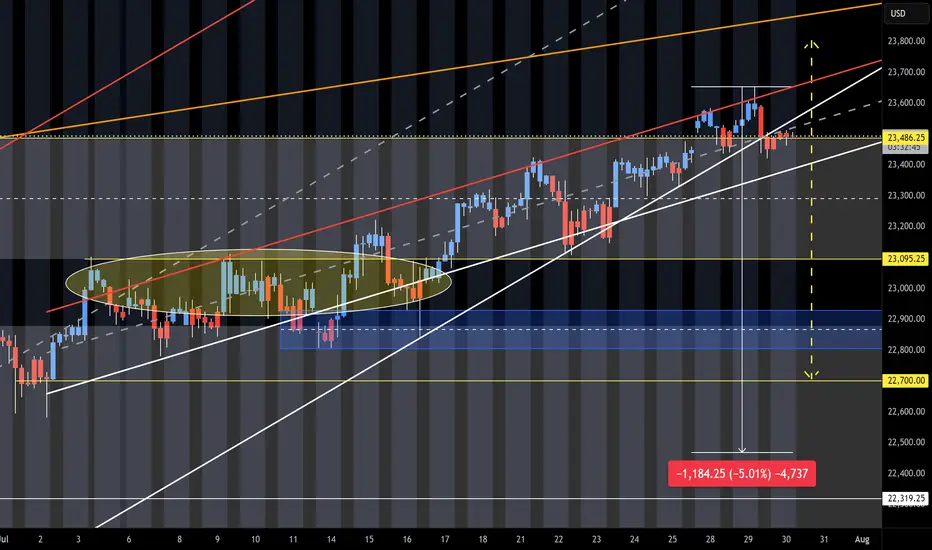
NQ Short (07-30-25)NAZ is at upper target and Turn Zone from May 12th post. Failure here should see a 5% drop test. The idea is that buyers will need some sellers in order to get higher. The sellers will help to test the level strength. Month end into a Friday-Monday Long play and a break in this long standing pattern
How to Use Engulfing Candles in TradingViewEngulfing patterns are among the most powerful candlestick formations because they signal strong momentum shifts and can help you spot dramatic trend reversal opportunities.
What You'll Learn:
• How to identify valid engulfing formations where one candle completely covers another's bo

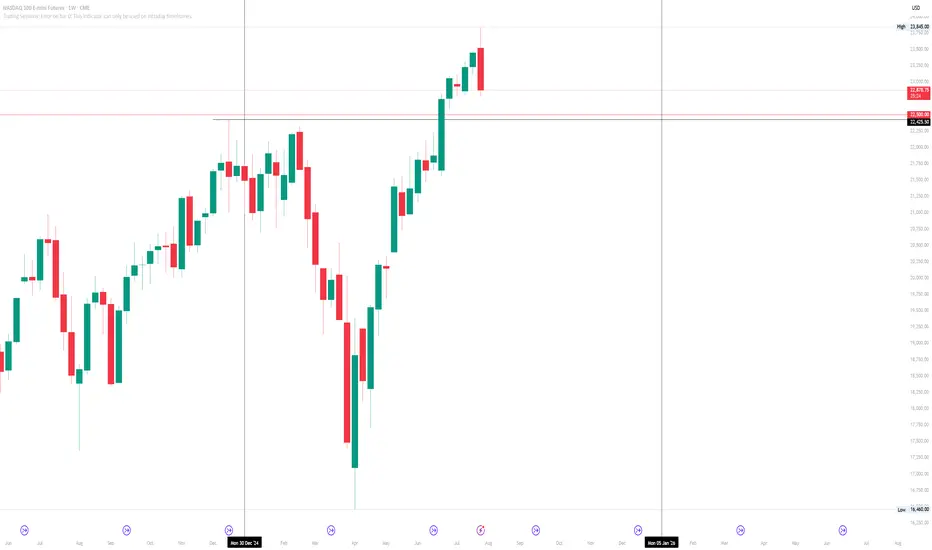
Nasdaq outlook on the weekly.... Where will price go next?Market cycle outlook on the year :
We have now reached a new month.
August 1st, which a new market cycle for the month to form, along beginning the backend of the year 2025 and the front end of a new week coming.
Closed bearish this week along with hitting all time highs once again for the Nasda
NASDAQ 100 LOOKING OVERBOUGHT RIPE FOR A CORRECTION?Hey Traders so today was looking at the Nasdaq 100 and it seems like it's approaching overbought territory at all time highs.
Of course no one knows what earnings season will bring and seasonally historically August is normally a good month for stocks.
So if we look at previous rallies market seem

Calm Before a StormSince the post-COVID period, we have not seen such a gentle and continuous uptrend. This phenomenon reminds me of the market before the COVID meltdown.
How do I going to interpret this "Gentle & Continuous Uptrend" move?
My answer: Cautiously bullish
Back then, market was cautiously bullish beca

NQ Short (07-28-25)The F-M Long Rig is active with a Gap Up and Pump/Dump play. Just notice KL 486 and how/when the NAZ gets above. In O/N, the Reg Session and previous hits at 23,440 got rejected and is why you are seeing the move in the off session. The BTD/FOMO chase is active, Pump/Dump near Open today for next mo
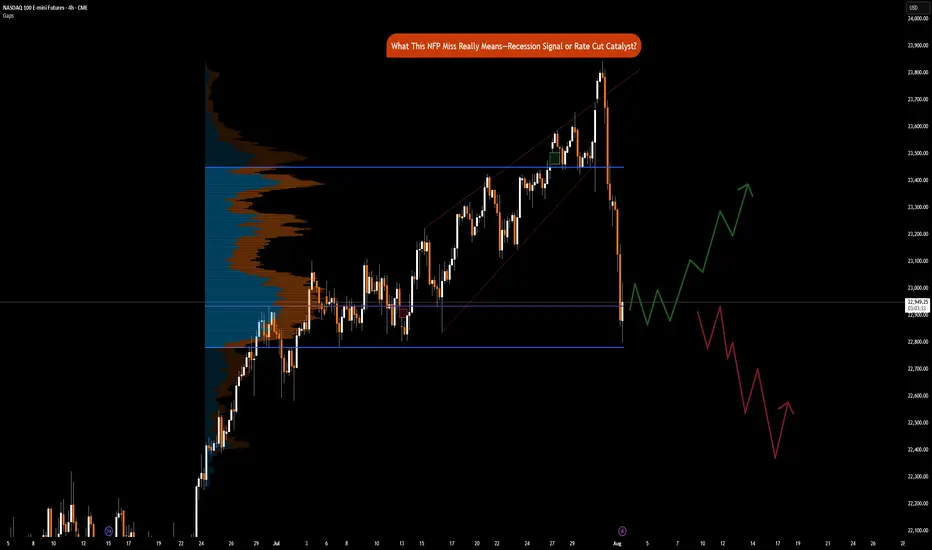
NFP Miss Implications: Recession Signal or Rate Cut CatalystCME_MINI:NQ1! CME_MINI:ES1! CME_MINI:MNQ1!
Happy Friday, folks!
Today is the first Friday of August, and that means the highly anticipated Non-Farm Payroll (NFP) numbers came in at 7.30 am CT.
US Non-Farm Payrolls (Jul) 73.0k vs. Exp. 110.0k (Prev. 147.0k, Rev. 14k); two-month net revision
See all ideas
Summarizing what the indicators are suggesting.
Neutral
SellBuy
Strong sellStrong buy
Strong sellSellNeutralBuyStrong buy
Neutral
SellBuy
Strong sellStrong buy
Strong sellSellNeutralBuyStrong buy
Neutral
SellBuy
Strong sellStrong buy
Strong sellSellNeutralBuyStrong buy
A representation of what an asset is worth today and what the market thinks it will be worth in the future.
Displays a symbol's price movements over previous years to identify recurring trends.
Frequently Asked Questions
The current price of E-mini Nasdaq-100 Futures (Jun 2026) is 24,125.00 USD — it has risen 1.22% in the past 24 hours. Watch E-mini Nasdaq-100 Futures (Jun 2026) price in more detail on the chart.
Track more important stats on the E-mini Nasdaq-100 Futures (Jun 2026) chart.
The nearest expiration date for E-mini Nasdaq-100 Futures (Jun 2026) is Jun 18, 2026.
Traders prefer to sell futures contracts when they've already made money on the investment, but still have plenty of time left before the expiration date. Thus, many consider it a good option to sell E-mini Nasdaq-100 Futures (Jun 2026) before Jun 18, 2026.
Open interest is the number of contracts held by traders in active positions — they're not closed or expired. For E-mini Nasdaq-100 Futures (Jun 2026) this number is 2.00. You can use it to track a prevailing market trend and adjust your own strategy: declining open interest for E-mini Nasdaq-100 Futures (Jun 2026) shows that traders are closing their positions, which means a weakening trend.
Buying or selling futures contracts depends on many factors: season, underlying commodity, your own trading strategy. So mostly it's up to you, but if you look for some certain calculations to take into account, you can study technical analysis for E-mini Nasdaq-100 Futures (Jun 2026). Today its technical rating is buy, but remember that market conditions change all the time, so it's always crucial to do your own research. See more of E-mini Nasdaq-100 Futures (Jun 2026) technicals for a more comprehensive analysis.